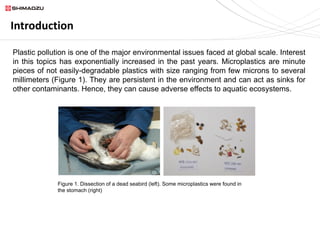
Microplastics Detection and
Characterization using FTIR
Microscopy
Shimadzu Scientific Instruments, Columbia, MD
Introduction
Plastic pollution is one of the major environmental issues faced at global scale. Interest
in this topics has exponentially increased in the past years. Microplastics are minute
pieces of not easily-degradable plastics with size ranging from few microns to several
millimeters (Figure 1). They are persistent in the environment and can act as sinks for
other contaminants. Hence, they can cause adverse effects to aquatic ecosystems.
Figure 1. Dissection of a dead seabird (left). Some microplastics were found in
the stomach (right)
Introduction
Therefore, the hazardous impact of increasing amount of microplastics in aquatic
environments calls for more scientific research to understand their occurrence, effects
and mitigation strategies. The FTIR (Fourier-Transform Infrared) and FTIR microscopy
techniques have shown that they are very powerful techniques to detect and
characterize a variety of microplastics.
In this work, we describe the analysis of primary and secondary microplastics. Primary
microplastics are used as raw materials for industrial polishing and scrubbing agents,
and are already 5.0 mm in size or less before entering the environment. On the other
hand, secondary microplastics are created from the degradation of larger plastic
products once they enter the environment through external processes such as
ultraviolet rays and crush.
Instruments and Measurement Parameters
Microplastic detection, characterization and mapping were carried out using Shimadzu
IRTracer-100 FTIR spectrophotometer with AIM-9000 FTIR automated microscope
system and ATR (Attenuated Total Reflectance) accessory (Figure 2). Method
conditions are listed in Table 1.
Figure 2: Shimadzu IRTracer-100 FTIR
spectrophotometer (left) attached to AIM-9000
Infrared Microscope (right)
Instrument
Shimadzu IRTracer-100 and AIM-
9000
Measurement
mode
Transmission
Resolution 4.0 cm-1
Number of
scan
50 times
Aperture size 100 x 100 μm Or 50 x 50 μm
Table 1: Measurement Parameters
Analysis of Primary Microplastics
Sample:
Primary microplastics in facial cleanser.
Pretreatment:
Microplastics dispersed in water was suction filtered using
cellulose filter paper (figure 4).
Measurement:
The micro plastic collected on the filter paper was moved to a
diamond cell to measure transmission. Area without plastics was
set as background.
Figure 3. Primary microplastic
sample
Figure 4. Microplastics on cellulose filter paper
Analysis of Primary Microplastics
Observation:
From transmission spectra of primary microplastics, we were able to determine that the
sample was a mixture of polyethylene (PE) and cellulose. The presence of cellulose in
the sample was confirmed carrying out appropriate background spectral subtractions to
eliminate spectra from the filter (also cellulose). Spectra are shown in Figure 5.
80010001200140016001800200024002800320036004000
cm-1
10
15
20
25
30
35
40
45
50
55
60
65
70
%T
80010001200140016001800200024002800320036004000
1/cm
30
40
50
60
70
80
90
100
%T
FTIR Measurement
Cellulose
Polyethylene
Figure 5. IR spectra of cellulose (top) and PE (bottom).
Analysis of Secondary Microplastics and
Mapping
Sample:
Secondary microplastics in ocean water.
Pretreatment:
Microplastics dispersed in water was suction filtered using PTFE
filter paper (infrared absorption in the vicinity of 1,200 cm-1).
Measurement:
The sample collected on the PTFE filter paper was moved to
diamond cell to measure transmission. PTFE is a convenient filter
for direct measurement although noisy spectra around 1,200 cm-1 is
observed.
Observation:
Library matching of spectra (Figure 6) and mapping results (Figure 7) allowed us to
determine the composition of microplastics in the ocean water sample.
Analysis of Secondary Microplastics and
Mapping
Figure 6. Data obtained from the FTIR systems were matched with library database to identify and
quantify microplastics
Analysis of Secondary Microplastics and
Mapping
Distribution of PE
(corrected area of 718 cm-1)
Distribution of PP
(corrected area of 2,839 cm-1)
Distribution of PET
(corrected area of 1,724 cm-1)
Visible microscope image
Figure 7. Distribution of types of plastics detected in sample.
Conclusion
FTIR and FTIR Microscopy are suitable techniques to detect and characterize
microplastic samples. The ease of use and mapping features provided by these
instruments keep the sample preparation minimum while helping properly identify
the different types of microplastics in real-world samples.
Need More Info?
Thank you for viewing this presentation. Should you have any
questions or require additional information about our research,
products, or services, please visit our Web site at:
www.ssi.shimadzu.com
Follow us on Twitter @shimadzussi

Microplastics Detection and Characterization using FTIR Microscopy

  • 1.
    Microplastics Detection and Characterizationusing FTIR Microscopy Shimadzu Scientific Instruments, Columbia, MD
  • 2.
    Introduction Plastic pollution isone of the major environmental issues faced at global scale. Interest in this topics has exponentially increased in the past years. Microplastics are minute pieces of not easily-degradable plastics with size ranging from few microns to several millimeters (Figure 1). They are persistent in the environment and can act as sinks for other contaminants. Hence, they can cause adverse effects to aquatic ecosystems. Figure 1. Dissection of a dead seabird (left). Some microplastics were found in the stomach (right)
  • 3.
    Introduction Therefore, the hazardousimpact of increasing amount of microplastics in aquatic environments calls for more scientific research to understand their occurrence, effects and mitigation strategies. The FTIR (Fourier-Transform Infrared) and FTIR microscopy techniques have shown that they are very powerful techniques to detect and characterize a variety of microplastics. In this work, we describe the analysis of primary and secondary microplastics. Primary microplastics are used as raw materials for industrial polishing and scrubbing agents, and are already 5.0 mm in size or less before entering the environment. On the other hand, secondary microplastics are created from the degradation of larger plastic products once they enter the environment through external processes such as ultraviolet rays and crush.
  • 4.
    Instruments and MeasurementParameters Microplastic detection, characterization and mapping were carried out using Shimadzu IRTracer-100 FTIR spectrophotometer with AIM-9000 FTIR automated microscope system and ATR (Attenuated Total Reflectance) accessory (Figure 2). Method conditions are listed in Table 1. Figure 2: Shimadzu IRTracer-100 FTIR spectrophotometer (left) attached to AIM-9000 Infrared Microscope (right) Instrument Shimadzu IRTracer-100 and AIM- 9000 Measurement mode Transmission Resolution 4.0 cm-1 Number of scan 50 times Aperture size 100 x 100 μm Or 50 x 50 μm Table 1: Measurement Parameters
  • 5.
    Analysis of PrimaryMicroplastics Sample: Primary microplastics in facial cleanser. Pretreatment: Microplastics dispersed in water was suction filtered using cellulose filter paper (figure 4). Measurement: The micro plastic collected on the filter paper was moved to a diamond cell to measure transmission. Area without plastics was set as background. Figure 3. Primary microplastic sample Figure 4. Microplastics on cellulose filter paper
  • 6.
    Analysis of PrimaryMicroplastics Observation: From transmission spectra of primary microplastics, we were able to determine that the sample was a mixture of polyethylene (PE) and cellulose. The presence of cellulose in the sample was confirmed carrying out appropriate background spectral subtractions to eliminate spectra from the filter (also cellulose). Spectra are shown in Figure 5. 80010001200140016001800200024002800320036004000 cm-1 10 15 20 25 30 35 40 45 50 55 60 65 70 %T 80010001200140016001800200024002800320036004000 1/cm 30 40 50 60 70 80 90 100 %T FTIR Measurement Cellulose Polyethylene Figure 5. IR spectra of cellulose (top) and PE (bottom).
  • 7.
    Analysis of SecondaryMicroplastics and Mapping Sample: Secondary microplastics in ocean water. Pretreatment: Microplastics dispersed in water was suction filtered using PTFE filter paper (infrared absorption in the vicinity of 1,200 cm-1). Measurement: The sample collected on the PTFE filter paper was moved to diamond cell to measure transmission. PTFE is a convenient filter for direct measurement although noisy spectra around 1,200 cm-1 is observed.
  • 8.
    Observation: Library matching ofspectra (Figure 6) and mapping results (Figure 7) allowed us to determine the composition of microplastics in the ocean water sample. Analysis of Secondary Microplastics and Mapping Figure 6. Data obtained from the FTIR systems were matched with library database to identify and quantify microplastics
  • 9.
    Analysis of SecondaryMicroplastics and Mapping Distribution of PE (corrected area of 718 cm-1) Distribution of PP (corrected area of 2,839 cm-1) Distribution of PET (corrected area of 1,724 cm-1) Visible microscope image Figure 7. Distribution of types of plastics detected in sample.
  • 10.
    Conclusion FTIR and FTIRMicroscopy are suitable techniques to detect and characterize microplastic samples. The ease of use and mapping features provided by these instruments keep the sample preparation minimum while helping properly identify the different types of microplastics in real-world samples.
  • 11.
    Need More Info? Thankyou for viewing this presentation. Should you have any questions or require additional information about our research, products, or services, please visit our Web site at: www.ssi.shimadzu.com Follow us on Twitter @shimadzussi