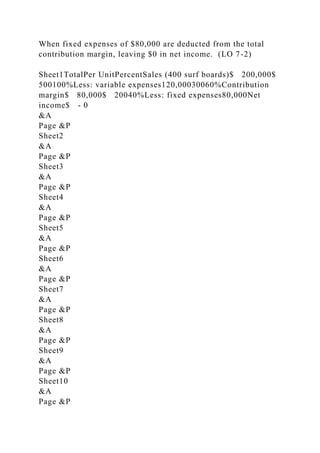
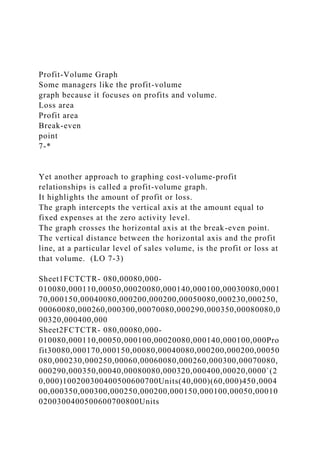
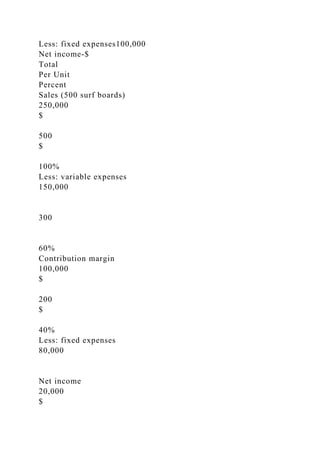
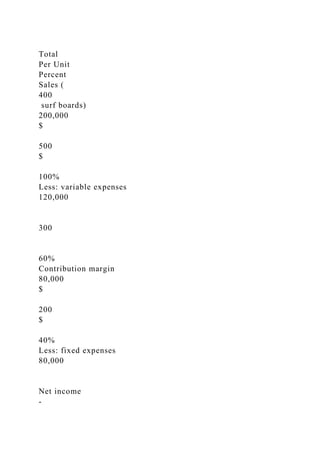
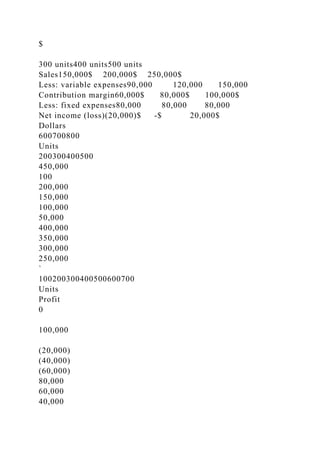
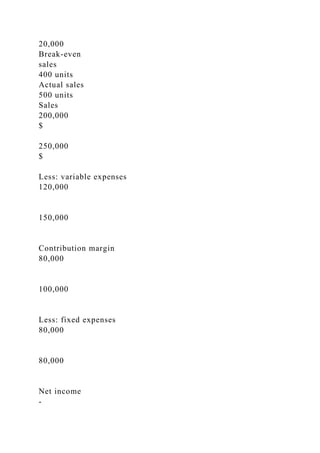
Cost-Volume-Profit Analysis
Chapter 7
Copyright © 2014 The McGraw-Hill Companies, Inc. All rights
reserved.
McGraw-Hill/Irwin
Helen (H) - Slide 1 NN
For format consistency, added the chapter and title as narration
notes for this slide.
Helen (H) - CHAPTER 1 CORRECTIONS REQUIRED
Note that not all slides have slide numbers.
Chapter 7: Cost-Volume-Profit Analysis
Learning Objective 7-1 – Compute a break-even point using the
contribution-margin approach and the equation approach.
7-*
Learning Objective 7-1. Compute a break-even point using the
contribution-margin approach and the equation approach.
The Break-Even Point
The break-even point is the point in the volume of activity
where the organization’s revenues
and expenses are equal.
7-*
The break-even point is the volume of activity where the
organization’s revenues and expenses are equal.
At this amount of sales, the organization has no profit or loss; it
breaks even.
This chapter will introduce an income statement highlighting
the distinction between variable and fixed expenses. Notice
that this income statement highlights the distinction between
variable and fixed expenses.
The statement also shows the total contribution margin, which
is defined as total sales revenue minus total variable expenses.
Total contribution margin is the amount of revenue that is
available to contribute to covering fixed expenses after all
variable expenses have been covered. (LO 7-1)
Sheet1Sales$ 250,000Less: variable
expenses150,000Contribution margin100,000Less: fixed
expenses100,000Net income$ - 0
&A
Page &P
Equation Approach
Sales revenue – Variable expenses – Fixed expenses = Profit
X = 400 surf boards
7-*
Unit
sales
price
Sales
volume
in units
×
Unit
variable
expense
Sales
volume
in units
×
($500 × X)
($300 × X)
–
–
$80,000 = $0
($200X)
–
$80,000 = $0
The equation approach can be used to find the break-even point.
This approach is based on the profit equation.
Income (or profit) is equal to sales revenue minus expenses.
Expenses can be separated in variable and fixed expenses.
At the break-even point, net income is $0. (LO 7-1)
Learning Objective 7-2 – Compute the contribution-margin ratio
and use it to find the break-even point in sales dollars.
7-*
Learning Objective 7-2. Compute the contribution-margin ratio
and use it to find the break-even point in sales dollars.
Contribution-Margin Approach
For each additional surf board sold, Curl generates $200 in
contribution margin.
Consider the following information developed by the accountant
at Curl, Inc.:
7-*
Helen (H) - Slide 6 NN
First sentence: Changed the learning objective '(LO2)' to read
'(LO 7-2).'
Curl, Inc. manufactures surf boards. Each surf board sells for
$500 and has variable costs of $300. (LO 7-2)
Therefore, the contribution margin per unit is $200. When
enough surf boards are sold so that the total contribution margin
is $80,000, Curl Inc. will break even for the period. (LO 7-2)
Sheet1TotalPer UnitPercentSales (500 surf boards)$ 250,000$
500100%Less: variable expenses150,00030060%Contribution
margin$ 100,000$ 20040%Less: fixed expenses80,000Net
income$ 20,000
&A
Page &P
Sheet2
&A
Page &P
Sheet3
&A
Page &P
Sheet4
&A
Page &P
Sheet5
&A
Page &P
Sheet6
&A
Page &P
Sheet7
&A
Page &P
Sheet8
&A
Page &P
Sheet9
&A
Page &P
Sheet10
&A
Page &P
Sheet11
&A
Page &P
Sheet12
&A
Page &P
Sheet13
&A
Page &P
Sheet14
&A
Page &P
Sheet15
&A
Page &P
Sheet16
&A
Page &P
Contribution-Margin Approach
Fixed expenses
Unit contribution margin
=
Break-even point
(in units)
7-*
$80,000
$200
= 400 surf boards
To compute the break-even volume of surf boards, divide the
total fixed expenses by the unit contribution margin.
For Curl, Inc., $80,000 is divided by $200, which equates to
400 surf boards. That means that the company must sell 400
surfboards to break-even. (LO 7-2)
Sheet1TotalPer UnitPercentSales (500 surf boards)$ 250,000$
500100%Less: variable expenses150,00030060%Contribution
margin$ 100,000$ 20040%Less: fixed expenses80,000Net
income$ 20,000
&A
Page &P
Sheet2
&A
Page &P
Sheet3
&A
Page &P
Sheet4
&A
Page &P
Sheet5
&A
Page &P
Sheet6
&A
Page &P
Sheet7
&A
Page &P
Sheet8
&A
Page &P
Sheet9
&A
Page &P
Sheet10
&A
Page &P
Sheet11
&A
Page &P
Sheet12
&A
Page &P
Sheet13
&A
Page &P
Sheet14
&A
Page &P
Sheet15
&A
Page &P
Sheet16
&A
Page &P
Contribution-Margin Approach
Here is the proof!
7-*
400 × $500 = $200,000
400 × $300 = $120,000
The break-even point of 400 units can be proven by first
calculating total sales: multiply $500 x 400 units for $200,000
in total sales.
The variable expenses are $300 per unit x 400 units, which is
$120,000.
Total sales less total variable expenses is total contribution
margin of $80,000.
When fixed expenses of $80,000 are deducted from the total
contribution margin, leaving $0 in net income. (LO 7-2)
Sheet1TotalPer UnitPercentSales (400 surf boards)$ 200,000$
500100%Less: variable expenses120,00030060%Contribution
margin$ 80,000$ 20040%Less: fixed expenses80,000Net
income$ - 0
&A
Page &P
Sheet2
&A
Page &P
Sheet3
&A
Page &P
Sheet4
&A
Page &P
Sheet5
&A
Page &P
Sheet6
&A
Page &P
Sheet7
&A
Page &P
Sheet8
&A
Page &P
Sheet9
&A
Page &P
Sheet10
&A
Page &P
Sheet11
&A
Page &P
Sheet12
&A
Page &P
Sheet13
&A
Page &P
Sheet14
&A
Page &P
Sheet15
&A
Page &P
Sheet16
&A
Page &P
Contribution Margin Ratio
Calculate the break-even point in sales dollars rather than units
by using the contribution margin ratio.
Contribution margin
Sales
= CM Ratio
7-*
Fixed expense
CM Ratio
Break-even point
(in sales dollars)
=
Sometimes management prefers that the break-even point be
expressed in sales dollars rather than units.
This can be accomplished by using the contribution margin
ratio.
The formula for the contribution margin ratio is contribution
margin divided by sales.
Then divide fixed expenses by the contribution margin ratio to
determine the total sales dollars at the break-even point. (LO 7-
2)
Contribution Margin Ratio
7-*
$80,000
40%
$200,000 in sales
=
For Curl, Inc., the fixed costs of $80,000 are divided by the
contribution margin ratio of 40% to determine the break-even
sales of $200,000. (LO 7-2)
Sheet1TotalPer UnitPercentSales (400 surf boards)$ 200,000$
500100%Less: variable expenses120,00030060%Contribution
margin$ 80,000$ 20040%Less: fixed expenses80,000Net
income$ - 0
&A
Page &P
Sheet2
&A
Page &P
Sheet3
&A
Page &P
Sheet4
&A
Page &P
Sheet5
&A
Page &P
Sheet6
&A
Page &P
Sheet7
&A
Page &P
Sheet8
&A
Page &P
Sheet9
&A
Page &P
Sheet10
&A
Page &P
Sheet11
&A
Page &P
Sheet12
&A
Page &P
Sheet13
&A
Page &P
Sheet14
&A
Page &P
Sheet15
&A
Page &P
Sheet16
&A
Page &P
Learning Objective 7-3 – Prepare a cost-volume-profit (CVP)
graph and explain how it is used.
7-*
Learning Objective 7-3. Prepare a cost-volume-profit (CVP)
graph and explain how it is used.
Graphing Cost-Volume-Profit Relationships
Viewing CVP relationships in a graph gives managers a
perspective that can be obtained in no other way.
Consider the following information for Curl, Inc.:
7-*
While the break-even point conveys useful information to
management, it does not show how profit changes as activity
changes.
Managers will often use a cost-volume-profit (CVP) graph to
show the relationship between profit and volume of activity.
Consider Curl, Inc. At sales of 300 unit, Curl Inc. incurs a net
loss of $20,000.
The break-even point occurs at 400 units and a $20,000 profit
occurs when sales are at 500 units. (LO 7-3)
Sheet1300 units400 units500 unitsSales$ 150,000$ 200,000$
250,000Less: variable
expenses90,000120,000150,000Contribution margin$ 60,000$
80,000$ 100,000Less: fixed expenses80,00080,00080,000Net
income (loss)$ (20,000)$ - 0$ 20,000
&A
Page &P
Cost-Volume-Profit Graph
Fixed expenses
7-*
In step 1, the horizontal and vertical axes are drawn. The
vertical axis of the graph is dollars and the horizontal axis is
units of sales.
In step 2, the fixed-expense line is drawn. It is parallel to the
horizontal axis, since fixed expenses do not change with
activity.
In step 3, compute the total expenses at any volume. Plot that
point. For Curl, Inc., look at 400 units. Multiply the unit
variable expenses of $300 per unit times 400 units for total
variable expenses of $120,000. Add the variable expense to the
fixed expenses of $80,000. So at the 400 unit level, total
expenses are $200,000. (LO 7-3)
Sheet1FCTCTR- 080,00080,000-
010080,000110,00050,00020080,000140,000100,00030080,0001
70,000150,00040080,000200,000200,00050080,000230,000250,
00060080,000260,000300,00070080,000290,000350,00080080,0
00320,000400,000
Sheet2450,000Dollars400,000350,000300,000250,000200,00015
0,000100,00050,000100200300400500600700800Units
Sheet3
Cost-Volume-Profit Graph
Fixed expenses
Total expenses
7-*
In step 4, the total expense line is drawn.
Since the total expenses at zero units sold is only the fixed
costs, the total expense line crosses the vertical axis at the
amount of fixed costs.
This line then passes through the point plotted in step 3. (LO 7-
3)
Sheet1FCTCTR- 080,00080,000-
010080,000110,00050,00020080,000140,000100,00030080,0001
70,000150,00040080,000200,000200,00050080,000230,000250,
00060080,000260,000300,00070080,000290,000350,00080080,0
00320,000400,000
Sheet2450,000Dollars400,000350,000300,000250,000200,00015
0,000100,00050,000100200300400500600700800Units
Sheet3
Cost-Volume-Profit Graph
Fixed expenses
Total expenses
7-*
In step 5, compute the total sales revenue at any volume.
Plot that point.
For Curl, Inc., look at 500 units.
Multiply the unit sales price of $500 per unit times 500 units for
total sales revenue of $250,000. (LO 7-3)
Sheet1FCTCTR- 080,00080,000-
010080,000110,00050,00020080,000140,000100,00030080,0001
70,000150,00040080,000200,000200,00050080,000230,000250,
00060080,000260,000300,00070080,000290,000350,00080080,0
00320,000400,000
Sheet2450,000Dollars400,000350,000300,000250,000200,00015
0,000100,00050,000100200300400500600700800Units
Sheet3
Cost-Volume-Profit Graph
Fixed expenses
Total expenses
Total sales
7-*
In Step 6, draw the total revenue line.
This line passes through the point plotted in step 5 and the
origin. (LO 7-3)
Sheet1FCTCTR- 080,00080,000-
010080,000110,00050,00020080,000140,000100,00030080,0001
70,000150,00040080,000200,000200,00050080,000230,000250,
00060080,000260,000300,00070080,000290,000350,00080080,0
00320,000400,000
Sheet2450,000Dollars400,000350,000300,000250,000200,00015
0,000100,00050,000100200300400500600700800Units
Sheet3
Cost-Volume-Profit Graph
Fixed expenses
Total expenses
Total sales
Break-even
point
Profit area
Loss area
7-*
In step 7, the break-even point, the profit area, and the loss area
are all labeled.
The break-even point is the point at which total expenses and
total sales are equal, which is where the two lines cross.
The profit area is the area where the total sales line is above the
total expenses line.
This is where revenues exceed expenses.
The loss area is the area where the total expenses line is above
the total sales line.
This is where expenses exceeds revenues. (LO 7-3)
Sheet1FCTCTR- 080,00080,000-
010080,000110,00050,00020080,000140,000100,00030080,0001
70,000150,00040080,000200,000200,00050080,000230,000250,
00060080,000260,000300,00070080,000290,000350,00080080,0
00320,000400,000
Sheet2450,000Dollars400,000350,000300,000250,000200,00015
0,000100,00050,000100200300400500600700800Units
Sheet3
Profit-Volume Graph
Some managers like the profit-volume
graph because it focuses on profits and volume.
Loss area
Profit area
Break-even
point
7-*
Yet another approach to graphing cost-volume-profit
relationships is called a profit-volume graph.
It highlights the amount of profit or loss.
The graph intercepts the vertical axis at the amount equal to
fixed expenses at the zero activity level.
The graph crosses the horizontal axis at the break-even point.
The vertical distance between the horizontal axis and the profit
line, at a particular level of sales volume, is the profit or loss at
that volume. (LO 7-3)
Sheet1FCTCTR- 080,00080,000-
010080,000110,00050,00020080,000140,000100,00030080,0001
70,000150,00040080,000200,000200,00050080,000230,000250,
00060080,000260,000300,00070080,000290,000350,00080080,0
00320,000400,000
Sheet2FCTCTR- 080,00080,000-
010080,000110,00050,000100,00020080,000140,000100,000Pro
fit30080,000170,000150,00080,00040080,000200,000200,00050
080,000230,000250,00060,00060080,000260,000300,00070080,
000290,000350,00040,00080080,000320,000400,00020,0000`(2
0,000)100200300400500600700Units(40,000)(60,000)450,0004
00,000350,000300,000250,000200,000150,000100,00050,00010
0200300400500600700800Units
Sheet3
Learning Objective 7-4 – Apply CVP analysis to determine the
effect on profit of changes in fixed expenses, variable expenses,
sales prices, and sales volume.
7-*
Learning Objective 7-4. Apply CVP analysis to determine the
effect on profit of changes in fixed expenses, variable expenses,
sales prices, and sales volume.
Target Net Profit
We can determine the number of surfboards that Curl must sell
to earn a profit of $100,000 using the contribution margin
approach.
7-*
Fixed expenses + Target profit
Unit contribution margin
=
Units sold to earn
the target profit
$80,000 + $100,000
$200
= 900 surf boards
When a company has a net profit they are trying to achieve, or a
target net profit, the contribution margin approach can be used
to determine the number of units that must be sold.
This is very similar to finding the break-even point.
The numerator is fixed expenses plus the target profit. The
denominator is the contribution margin per unit.
The result is the units that need to be sold to earn the targeted
net profit. (LO 7-4)
Equation Approach
Sales revenue – Variable expenses – Fixed expenses = Profit
X = 900 surf boards
7-*
($500 × X)
($300 × X)
–
–
$80,000 = $100,000
($200X)
= $180,000
Helen (H) - Slide 21 NN
Last sentence: Added the word 'the' after the word 'becomes.'
The equation approach also can be used to find the units of
sales required to earn a target net profit. Recall that in the
profit equation, profit is equal to revenues minus variable and
fixed expenses. Recall that profit was set to zero to determine
the break-even point. When management has determined a
target net profit greater than zero, that number becomes the
profit variable in the equation. (LO 7-4)
Applying CVP Analysis
Safety MarginThe difference between budgeted sales revenue
and break-even sales revenue.The amount by which sales can
drop before losses occur.
7-*
The safety margin of an enterprise is the difference between the
budgeted sales revenue and the break-even sales revenue.
This is the amount by which sales can drop before losses occur.
(LO 7-4)
Safety Margin
Curl, Inc. has a break-even point of
$200,000 in sales. If actual sales are $250,000, the safety
margin is $50,000, or 100 surf boards.
7-*
Helen (H) - Slide 23
Top text: Expanded the text box and moved the text so that the
values in the text was readible.
For example, Curl, Inc. has a break-even point when sales are
$200,000.
If actual sales are $250,000, the margin of safety is $50,000,
which is 100 surfboards. (LO 7-4)
Sheet1TotalPer UnitPercentSales (500 bikes)$ 250,000$
500100%Less: variable expenses150,00030060%Contribution
margin$ 100,000$ 20040%Less: fixed expenses80,000Net
income$ 20,000Break-even sales 400 unitsActual sales
500 unitsSales$ 200,000$ 250,000Less: variable
expenses120,000150,000Contribution
margin80,000100,000Less: fixed expenses80,00080,000Net
income$ - 0$ 20,000
&A
Page &P
Changes in Fixed Costs
Curl is currently selling 500 surfboards per year.
The owner believes that an increase of $10,000 in the annual
advertising budget, would increase sales to 540 units.
Should the company increase the advertising budget?
7-*
Helen (H) - Slide 24 NN
Second sentence: Changed the word 'month' after the word 'per'
to read 'year.'
What would happen to a company’s break-even point if fixed
expenses change?
Suppose the owner wanted to increase advertising by $10,000
per year in hopes that sales will increase to 540 units. (LO 7-4)
Changes in Fixed Costs
$80,000 + $10,000 advertising = $90,000
540 units × $500 per unit = $270,000
7-*
If the additional advertising is effective and sales increases to
540 boards, sales revenue would be $270,000, variable expenses
would be $162,000 and the contribution margin would be
$108,000.
Fixed expenses would now be $90,000 and therefore, net
income would be $18,000.
Net income at the current level is $20,000. (LO 7-4)
Sheet1Current Sales (500 Boards)Proposed Sales
(540 Boards)Sales$ 250,000$ 270,000Less: variable
expenses150,000162,000Contribution margin$ 100,000$
108,000Less: fixed expenses80,00090,000Net income$
20,000$ 18,000
&A
Page &P
Changes in Fixed Costs
Sales will increase by
$20,000, but net income
decreased by $2,000.
7-*
So even though sales would increase from $250,000 to
$270,000, net income would decrease by $2,000. (LO 7-4)
Sheet1Current Sales (500 Boards)Proposed Sales
(540 Boards)Sales$ 250,000$ 270,000Less: variable
expenses150,000162,000Contribution margin$ 100,000$
108,000Less: fixed expenses80,00090,000Net income$
20,000$ 18,000
&A
Page &P
Changes in Unit
Contribution Margin
Because of increases in cost of raw materials, Curl’s variable
cost per unit has increased from $300 to $310 per surfboard.
With no change in selling price per unit, what will be the new
break-even point?
X = 422 units (rounded)
7-*
($500 × X)
($310 × X)
–
–
$80,000 = $0
When the variable cost per unit changes, this effects the
contribution margin per unit.
In turn, the break-even point would also be changed.
Look at Curl, Inc.
Suppose the variable cost per unit increases to $310 but there is
no change in selling price.
Using the equation approach, we find that the new break-even
point is 422 units, instead of 400 units. (LO 7-4)
Changes in Unit
Contribution Margin
Suppose Curl, Inc. increases the price of each surfboard to
$550. With no change in variable cost per unit, what will be the
new break-even point?
X = 320 units
7-*
($550 × X)
($300 × X)
–
–
$80,000 = $0
Changing the unit sales price will also alter the unit
contribution margin.
Suppose the price is raised from $500 to $550.
This change will raise the unit contribution margin from $200 to
$250.
The new break-even point will be 320 units ($80,000 / $250).
A $50 increase in the sales price will lower the break-even point
from 400 to 320 surf boards.
But is this change desirable?
A lower break-even point may seem like a good thing if sales
are slow.
However, Curl may be more likely to at least break even with a
lower sales price.
Maybe sales volume would drop dramatically if the price is
raised to $550.
Management must try to predict the reaction of the consumers.
CVP analysis provides valuable information, but it is only one
of several elements that influence management’s decisions.
(LO 7-4)
Predicting Profit Given Expected Volume
7-*
Fixed expenses
Unit contribution margin
Target net profit
Find: {req’d sales volume}
Given:
Fixed expenses
Unit contribution margin
Expected sales volume
Find: {expected profit}
Given:
So far, we have focused on finding the required sales volume to
break even or achieve a particular target net profit.
We can also use CVP analysis to determine the expected profit
if fixed expenses, unit contribution margin, and expected sales
volume are known. (LO 7-4)
Predicting Profit Given
Expected Volume
In the coming year, Curl’s owner expects to sell 525 surfboards.
The unit contribution margin is expected to be $190, and fixed
costs are expected to increase to $90,000.
X = $9,750 profit
X = $99,750 – $90,000
Total contribution - Fixed cost = Profit
7-*
($190 × 525)
–
$90,000 = X
For example, Curl expects to sell 525 surfboards in the coming
year.
Variable costs are expected to increase, which would reduce the
unit contribution margin to $190.
Fixed costs are also expected to increase to $90,000.
The expected profit can be determined by first determining the
total contribution.
This is the unit contribution times the number of units sold.
By deducting the fixed costs, we can see that the expected profit
would be $9,750. (LO 7-4)
Learning Objective 7-5 – Compute the break-even point and
prepare a profit-volume graph for a multiproduct enterprise.
7-*
Learning Objective 7-5. Compute the break-even point and
prepare a profit-volume graph for a multiproduct enterprise.
CVP Analysis with Multiple Products
For a company with more than one product, sales mix is the
relative combination in which a company’s products are sold.
Different products have different selling prices, cost structures,
and contribution margins.
Let’s assume Curl sells surfboards and sailboards and see how
we deal with break-even analysis.
7-*
Helen (H) - Slide 32
Bottom text: Changed the words 'sail boards' to read
'sailboards.'
If a company sells more than one product, the relative
combination in which a company’s products are sold is referred
to as the sales mix.
With different selling prices, contribution margins, and fixed
costs, it now becomes more difficult to determine the break-
even point.
Let’s assume that Curl, Inc. also sells sailboards. (LO 7-5)
CVP Analysis with Multiple Products
Curl provides us with the following: information:
7-*
The unit selling price, variable cost, and contribution margin
are known for each of the two products that Curl sells.
Surf boards make up 62.5% of Curl’s total sales and the
sailboards make up the other 37.5%. (LO 7-5)
Sheet1DescriptionSelling PriceUnit Variable CostUnit
Contribution MarginNumber of BoardsSurfboards$ 500$
300$ 200500Sailboards1,000450550300Total sold800
Sheet2
Sheet3
Sheet4
Sheet5
Sheet6
Sheet1DescriptionNumber of Boards% of
TotalSurfboards50062.5%(500 ÷ 800)Sailboards30037.5%(300
÷ 800)Total sold800100.0%
Sheet2
Sheet3
Sheet4
Sheet5
Sheet6
CVP Analysis with Multiple Products
Weighted-average unit contribution margin
$200 × 62.5%
$550 × 37.5%
7-*
The sales mix is used to compute a weighted-average unit
contribution margin.
This is the average of all products’ unit contribution margins,
weighted by the relative sales proportion of each product.
For Curl, surfboards have a unit contribution margin of $200,
which is multiplied by the 62.5% sales proportion.
The weighted contribution margin for the surfboards is $125.
The same formula is used to calculate the weighted contribution
margin for sailboards, which is $206.25.
The total weighted average contribution margin for Curl’s
products is $331.25. (LO 7-5)
Sheet1DescriptionContribution Margin% of TotalWeighted
ContributionSurfboards$ 20062.5%$
125.00Sailboards55037.5%206.25Weighted-average
contribution margin$ 331.25
Sheet2
Sheet3
Sheet4
Sheet5
Sheet6
CVP Analysis with Multiple Products
Break-even point
Break-even
point
=
Fixed expenses
Weighted-average unit contribution margin
Break-even
point
=
$170,000
$331.25
Break-even
point
=
514 combined unit sales
7-*
The break-even point can be calculated using the contribution
margin approach.
The total fixed costs are divided by the weighted average unit
contribution margin.
For Curl, the calculation is $170,000 divided by $331.25, which
is 514 total units to be sold. (LO 7-5)
CVP Analysis with Multiple Products
Break-even point
Break-even
point
=
514 combined unit sales
7-*
The total units are then multiplied by the relative sales
proportion to determine the individual product sales.
The number of surfboards to be sold at the break-even point,
514 units is multiplied by 62.5%, which equals 321 units.
514 is multiplied by 37.5% to determine that 193 sailboards
must be sold to break-even.
The break-even point of 514 units per year is valid only for the
sales mix assumed in computing the weighted-average unit
contribution margin. (LO 7-5)
Sheet1DescriptionBreakeven Sales% of TotalIndividual
SalesSurfboards51462.5%321Sailboards51437.5%193Total
units514
Sheet2
Sheet3
Sheet4
Sheet5
Sheet6
Learning Objective 7-6 – List and discuss the key assumptions
of CVP analysis.
7-*
Learning Objective 7-6. List and discuss the key assumptions of
CVP analysis.
Assumptions Underlying
CVP Analysis
Selling price is constant throughout the entire relevant range.
Costs are linear over the relevant range.
In multi-product companies, the sales mix is constant.
In manufacturing firms, inventories do not change (units
produced = units sold).
7-*
Helen (H) - Slide 38 NN
Item 2.A. Moved the text that was wrapped to the previous line.
For any cost-volume-profit analysis to be valid, the following
important assumptions must be reasonably satisfied within the
relevant range.
1. The behavior of total revenue is linear (straight-line). This
implies that the price of the product or service will not change
as sales volume varies within the relevant range.
2. The behavior of total expenses is linear (straight-line) over
the relevant range. This implies the following more specific
assumptions.
a. Expenses can be categorized as fixed, variable, or
semivariable. Total fixed expenses remain constant as activity
changes, and the unit variable expense remains unchanged as
activity varies.
b. The efficiency and productivity of the production process and
workers remain constant.
3. In multiproduct organizations, the sales mix remains constant
over the relevant range.
4. In manufacturing firms, the inventory levels at the beginning
and end of the period are the same. This implies that the number
of units produced during the period equals the number of units
sold.
(LO 7-6)
Learning Objective 7-7 – Prepare and interpret a contribution
income statement.
7-*
Learning Objective 7-7. Prepare and interpret a contribution
income statement.
CVP Relationships and the
Income Statement
7-*
On a traditional income statement, cost of goods sold includes
both variable and fixed manufacturing costs, as measured by the
firm’s product-costing system.
The gross margin is computed by subtracting cost of goods sold
from sales.
Selling and administrative expenses are then subtracted; each
expense includes both variable and fixed costs.
The traditional income statement does not disclose the
breakdown of each expense into its variable and fixed
components. (LO 7-7)
Sheet1FCTCTR- 080,00080,000-
010080,000110,00050,00020080,000140,000100,00030080,0001
70,000150,00040080,000200,000200,00050080,000230,000250,
00060080,000260,000300,00070080,000290,000350,00080080,0
00320,000400,000
Sheet2FCTCTR- 080,00080,000-
010080,000110,00050,000100,00020080,000140,000100,000Pro
fit30080,000170,000150,00080,00040080,000200,000200,00050
080,000230,000250,00060,00060080,000260,000300,00070080,
000290,000350,00040,00080080,000320,000400,00020,0000`(2
0,000)100200300400500600700Units(40,000)(60,000)450,0004
00,000350,000300,000250,000200,000150,000100,00050,00010
0200300400500600700800Units
Sheet3
Sheet4A. Traditional FormatACCUTIME COMPANYIncome
StatementFor the Year Ended December 31,
20x1Sales$500,000Less:380,000Gross margin$120,000Less:
Operating expenses:Selling expenses$35,000Administrative
expenses35,00070,000Net income$50,000B. Contribution
FormatACCUTIME COMPANYIncome StatementFor the Year
Ended December 31, 20x1Sales$500,000Less: Variable
expenses:Variable manufacturing$280,000Variable
selling15,000Variable administrative5,000300,000Contribution
margin$200,000Less: Fixed expenses:Fixed
manufacturing$100,000Fixed selling20,000Fixed
administrative30,000150,000Net income$50,000
CVP Relationships and the
Income Statement
7-*
Many operating managers find the traditional income-statement
format difficult to use, because it does not separate variable and
fixed expenses.
Instead they prefer the contribution income statement.
The contribution format highlights the distinction between
variable and fixed expenses.
On the contribution income statement, all variable expenses are
subtracted from sales to obtain the contribution margin.
All fixed costs are then subtracted from the contribution margin
to obtain net income.
Operating managers frequently prefer the contribution income
statement, because its separation of fixed and variable expenses
highlights cost-volume-profit relationships.
It is readily apparent from the contribution-format statement
how income will be affected when sales volume changes by a
given percentage. (LO7-7)
Sheet1FCTCTR- 080,00080,000-
010080,000110,00050,00020080,000140,000100,00030080,0001
70,000150,00040080,000200,000200,00050080,000230,000250,
00060080,000260,000300,00070080,000290,000350,00080080,0
00320,000400,000
Sheet2FCTCTR- 080,00080,000-
010080,000110,00050,000100,00020080,000140,000100,000Pro
fit30080,000170,000150,00080,00040080,000200,000200,00050
080,000230,000250,00060,00060080,000260,000300,00070080,
000290,000350,00040,00080080,000320,000400,00020,0000`(2
0,000)100200300400500600700Units(40,000)(60,000)450,0004
00,000350,000300,000250,000200,000150,000100,00050,00010
0200300400500600700800Units
Sheet3
Sheet4A. Traditional FormatACCUTIME COMPANYIncome
StatementFor the Year Ended December 31,
20x1Sales$500,000Less:380,000Gross margin$120,000Less:
Operating expenses:Selling expenses$35,000Administrative
expenses35,00070,000Net income$50,000B. Contribution
FormatACCUTIME COMPANYIncome StatementFor the Year
Ended December 31, 20x1Sales$500,000Less: Variable
expenses:Variable manufacturing$280,000Variable
selling15,000Variable administrative5,000300,000Contribution
margin$200,000Less: Fixed expenses:Fixed
manufacturing$100,000Fixed selling20,000Fixed
administrative30,000150,000Net income$50,000
Learning Objective 7-8 – Explain the role of cost structure and
operating leverage in CVP relationships.
7-*
Learning Objective 7-8. Explain the role of cost structure and
operating leverage in CVP relationships.
Cost Structure and Operating Leverage
The cost structure of an organization is the relative proportion
of its fixed and variable costs.
Operating leverage is:
the extent to which an organization uses fixed costs in its cost
structure.
greatest in companies that have a high proportion of fixed costs
in relation to variable costs.
7-*
The cost structure of an organization is the relative proportion
of its fixed and variable costs.
Cost structures differ widely among industries and among firms
within an industry.
A company using a computer-integrated manufacturing system
has a large investment in plant and equipment, which results in
a cost structure dominated by fixed costs.
In contrast, a home builder contractor’s cost structure has a
much higher proportion of variable costs.
The highly automated manufacturing firm is capital-intensive,
whereas the home building contractor is labor-intensive.
An organization’s cost structure has a significant effect on the
sensitivity of its profit to changes in volume.
The extent to which an organization uses fixed costs in its cost
structure is called operating leverage.
The operating leverage is greatest in firms with a large
proportion of fixed costs, low proportion of variable costs, and
the resulting high contribution margin ratio. (LO 7-8)
Measuring Operating Leverage
Contribution margin
Net income
Operating leverage
factor
=
7-*
$100,000
$20,000
= 5
The managerial accountant can measure a firm’s operating
leverage, at a particular sales volume, using the operating
leverage factor.
The formula is contribution margin divided by net income.
At sales of 500 surfboards, Curl’s contribution margin is
$100,000 and net income is $20,000; therefore, its operating
leverage factor is 5. (LO 7-8)
Sheet1TotalPer UnitPercentSales (500 bikes)$ 250,000$
500100%Less: variable expenses150,00030060%Contribution
margin$ 100,000$ 20040%Less: fixed expenses80,000Net
income$ 20,000Actual sales 500 BoardActual sales 500
unitsSales$ 250,000$ 250,000Less: variable
expenses150,000150,000Contribution
margin100,000100,000Less: fixed expenses80,00080,000Net
income$ 20,000$ 20,000
&A
Page &P
Measuring Operating Leverage
A measure of how a percentage change in sales will affect
profits. If Curl increases its sales by 10%, what will be the
percentage increase in net income?
7-*
The operating leverage factor is a measure, at a particular level
of sales, of the percentage impact on net income of a given
percentage change in sales revenue.
Multiplying the percentage change in sales revenue by the
operating leverage factor yields the percentage change in net
income.
At Curl, Inc., a 10% increase in sales would be multiplied by
the operating leverage of 5.
Therefore, if Curl experiences a 10% increase in sales, it can
expect a 50% increase in net income. (LO 7-8)
Sheet1Percent increase in sales10%Operating leverage
factor×5Percent increase in profits50%
&A
Page &P
Measuring Operating Leverage
A firm with proportionately high fixed costs has relatively high
operating leverage. On the other hand, a firm with high
operating leverage has a relatively high break-even point.
7-*
A firm’s cost structure plays an important role in determining
its cost-volume-profit relationships.
A company with proportionately high fixed cost has relatively
high operating leverage.
The result of high operating leverage is that the firm can
generate a large percentage increase in net income from a
relatively small percentage increase in sales revenue.
On the other hand, a firm with high operating leverage has a
relatively high break-even point.
This entails some risk to the firm. (LO 7-8)
Learning Objective 7-9 – Understand the implications of
activity-based costing for CVP analysis.
7-*
Learning Objective 7-9. Understand the implications of activity-
based costing for CVP analysis.
CVP Analysis, Activity-Based Costing, and Advanced
Manufacturing Systems
An activity-based costing system provides a much more
complete picture of cost-volume-profit relationships and, thus,
it provides better information to managers.
7-*
Break-even
point
=
Fixed costs
Unit contribution margin
Traditional cost-volume-profit analysis focuses on the number
of units sold as the only cost and revenue driver.
Sales revenue is assumed to be linear in units sold.
Moreover, costs are categorized as fixed or variable, with
respect to the number of units sold, within the relevant range.
This approach is consistent with traditional product-costing
systems, in which cost assignment is based on a single, volume-
related cost driver.
In CVP analysis, as in product costing, the traditional approach
can be misleading or provide less than adequate information for
various management purposes.
An activity based costing system provides a much more
complete picture of cost-volume-profit relationships and, thus,
it provides better information to managers. (LO 7-9)
Learning Objective 7-10 – Be aware of the effects of advanced
manufacturing technology on CVP relationships.
7-*
Learning Objective 7-10. Be aware of the effects of advanced
manufacturing technology on CVP relationships.
A Move Toward JIT and
Flexible Manufacturing
Overhead costs like setup, inspection, and material handling are
fixed with respect to sales volume, but they are not fixed with
respect to other cost drivers.
This is the fundamental distinction between a traditional CVP
analysis and an activity-based costing CVP analysis.
7-*
The point of this section is that activity-based costing provides
a richer description of a company’s cost behavior.
Just as ABC can improve an organization’s product-costing
system, it also can facilitate a deeper understanding of cost
behavior and CVP relationships. (LO 7-10)
Learning Objective 7-11 – Understand the effect of income
taxes on CVP analysis (appendix).
7-*
Learning Objective 11. Understand the effect of income taxes
on CVP analysis (appendix).
Effect of Income Taxes
Income taxes affect a company’s CVP relationships. To earn a
particular after-tax net income, a greater before-tax income will
be required.
7-*
Target after-tax net income
1 - t
=
Before-tax net income
The requirement that companies pay income taxes affects their
cost-volume-profit relationships.
To earn a particular after-tax net income, a greater before-tax
income will be required.
To determine what the before-tax net income is, the after-tax
net income is divided by 1 minus the tax rate.
The formulas presented in this chapter can now be used with the
before-tax net income to provide for the effect of taxes. (LO 7-
11)
End of Chapter 7
7-*
Sales250,000$
Less: variable expenses150,000
Contribution margin100,000
Less: fixed expenses100,000
Net income-$
Total
Per Unit
Percent
Sales (500 surf boards)
250,000
$
500
$
100%
Less: variable expenses
150,000
300
60%
Contribution margin
100,000
$
200
$
40%
Less: fixed expenses
80,000
Net income
20,000
$
Total
Per Unit
Percent
Sales (
400
surf boards)
200,000
$
500
$
100%
Less: variable expenses
120,000
300
60%
Contribution margin
80,000
$
200
$
40%
Less: fixed expenses
80,000
Net income
-
$
300 units400 units500 units
Sales150,000$ 200,000$ 250,000$
Less: variable expenses90,000 120,000 150,000
Contribution margin60,000$ 80,000$ 100,000$
Less: fixed expenses80,000 80,000 80,000
Net income (loss)(20,000)$ -$ 20,000$
Dollars
600700800
Units
200300400500
450,000
100
200,000
150,000
100,000
50,000
400,000
350,000
300,000
250,000
`
100200300400500600700
Units
Profit
0
100,000
(20,000)
(40,000)
(60,000)
80,000
60,000
40,000
20,000
Break-even
sales
400 units
Actual sales
500 units
Sales
200,000
$
250,000
$
Less: variable expenses
120,000
150,000
Contribution margin
80,000
100,000
Less: fixed expenses
80,000
80,000
Net income
-
$
20,000
$
Current
Sales
(500 Boards)
Proposed
Sales
(540 Boards)
Sales250,000$ 270,000$
Less: variable expenses150,000 162,000
Contribution margin100,000$ 108,000$
Less: fixed expenses80,000 90,000
Net income20,000$ 18,000$
Current
Sales
(500 Boards)
Proposed
Sales
(540 Boards)
Sales250,000$ 270,000$
Less: variable expenses150,000 162,000
Contribution margin100,000$ 108,000$
Less: fixed expenses80,000 90,000
Net income20,000$ 18,000$
Description
Selling
Price
Unit
Variable
Cost
Unit
Contribution
Margin
Number
of
Boards
Surfboards500$ 300$ 200$ 500
Sailboards1,000 450 550 300
Total sold800
Description
Number
of Boards
% of
Total
Surfboards500 62.5%(500 ÷ 800)
Sailboards300 37.5%(300 ÷ 800)
Total sold800 100.0%
Description
Contribution
Margin % of Total
Weighted
Contribution
Surfboards200$ 62.5%125.00$
Sailboards550 37.5%206.25
Weighted-average contribution margin331.25$
Description
Breakeven
Sales
% of
Total
Individual
Sales
Surfboards51462.5%321
Sailboards51437.5%193
Total units514
A. Traditional Format
Sales $500,000
Less: 380,000
Gross margin$120,000
Less: Operating expenses:
Selling expenses $35,000
Administrative expenses 35,00070,000
Net income $50,000
ACCUTIME COMPANY
Income Statement
For the Year Ended December 31, 20x1
B. Contribution Format
Sales $500,000
Less: Variable expenses:
Variable manufacturing $280,000
Variable selling 15,000
Variable administrative 5,000300,000
Contribution margin $200,000
Less: Fixed expenses:
Fixed manufacturing $100,000
Fixed selling 20,000
Fixed administrative30,000150,000
Net income $50,000
Income Statement
For the Year Ended December 31, 20x1
ACCUTIME COMPANY
Actual sales
500 Board
Sales
250,000
$
Less: variable expenses
150,000
Contribution margin
100,000
Less: fixed expenses
80,000
Net income
20,000
$
Percent increase in sales10%
Operating leverage factor× 5
Percent increase in profits50%
Weekly Worksheet:
MLKJ & Malcolm X
1. What are the three kinds of love MLKJ discusses? How does
he define them?
2. What are the reasons for pursuing nonviolent resistance?
What does MLKJ suggest would be the consequences of violent
resistance?
3. In his reflections, Malcolm X regrets having told the young
girl from South Carolina that there is nothing she can do. What
does Malcolm X suggest that white people in the 1960s could do
to help civil rights? What are his reasons for this? Spend some
good time on this question and open up the PDF to find his
answer.
4. Towards the end of the excerpt (pg 4-5), Malcolm X
discusses he wished he could return for more education, maybe
to study foreign languages. Why is this so important for
Malcolm X at the end of his life? Is there a connection between
education and civil rights? Or is it between education and self-
empowerment? Explore.

Cost-Volume-Profit AnalysisChapter 7Copyright © 2014 T.docx

  • 1.
    Cost-Volume-Profit Analysis Chapter 7 Copyright© 2014 The McGraw-Hill Companies, Inc. All rights reserved. McGraw-Hill/Irwin Helen (H) - Slide 1 NN For format consistency, added the chapter and title as narration notes for this slide. Helen (H) - CHAPTER 1 CORRECTIONS REQUIRED Note that not all slides have slide numbers. Chapter 7: Cost-Volume-Profit Analysis Learning Objective 7-1 – Compute a break-even point using the contribution-margin approach and the equation approach. 7-* Learning Objective 7-1. Compute a break-even point using the contribution-margin approach and the equation approach.
  • 2.
    The Break-Even Point Thebreak-even point is the point in the volume of activity where the organization’s revenues and expenses are equal. 7-* The break-even point is the volume of activity where the organization’s revenues and expenses are equal. At this amount of sales, the organization has no profit or loss; it breaks even. This chapter will introduce an income statement highlighting the distinction between variable and fixed expenses. Notice that this income statement highlights the distinction between variable and fixed expenses. The statement also shows the total contribution margin, which is defined as total sales revenue minus total variable expenses. Total contribution margin is the amount of revenue that is available to contribute to covering fixed expenses after all variable expenses have been covered. (LO 7-1) Sheet1Sales$ 250,000Less: variable expenses150,000Contribution margin100,000Less: fixed expenses100,000Net income$ - 0 &A Page &P Equation Approach Sales revenue – Variable expenses – Fixed expenses = Profit X = 400 surf boards
  • 3.
    7-* Unit sales price Sales volume in units × Unit variable expense Sales volume in units × ($500× X) ($300 × X) – – $80,000 = $0 ($200X) – $80,000 = $0 The equation approach can be used to find the break-even point. This approach is based on the profit equation. Income (or profit) is equal to sales revenue minus expenses. Expenses can be separated in variable and fixed expenses. At the break-even point, net income is $0. (LO 7-1)
  • 4.
    Learning Objective 7-2– Compute the contribution-margin ratio and use it to find the break-even point in sales dollars. 7-* Learning Objective 7-2. Compute the contribution-margin ratio and use it to find the break-even point in sales dollars. Contribution-Margin Approach For each additional surf board sold, Curl generates $200 in contribution margin. Consider the following information developed by the accountant at Curl, Inc.: 7-* Helen (H) - Slide 6 NN First sentence: Changed the learning objective '(LO2)' to read '(LO 7-2).' Curl, Inc. manufactures surf boards. Each surf board sells for $500 and has variable costs of $300. (LO 7-2) Therefore, the contribution margin per unit is $200. When enough surf boards are sold so that the total contribution margin is $80,000, Curl Inc. will break even for the period. (LO 7-2)
  • 5.
    Sheet1TotalPer UnitPercentSales (500surf boards)$ 250,000$ 500100%Less: variable expenses150,00030060%Contribution margin$ 100,000$ 20040%Less: fixed expenses80,000Net income$ 20,000 &A Page &P Sheet2 &A Page &P Sheet3 &A Page &P Sheet4 &A Page &P Sheet5 &A Page &P Sheet6 &A Page &P Sheet7 &A Page &P Sheet8 &A Page &P Sheet9 &A Page &P Sheet10 &A Page &P Sheet11 &A Page &P
  • 6.
    Sheet12 &A Page &P Sheet13 &A Page &P Sheet14 &A Page&P Sheet15 &A Page &P Sheet16 &A Page &P Contribution-Margin Approach Fixed expenses Unit contribution margin = Break-even point (in units) 7-* $80,000 $200 = 400 surf boards To compute the break-even volume of surf boards, divide the total fixed expenses by the unit contribution margin. For Curl, Inc., $80,000 is divided by $200, which equates to 400 surf boards. That means that the company must sell 400 surfboards to break-even. (LO 7-2)
  • 7.
    Sheet1TotalPer UnitPercentSales (500surf boards)$ 250,000$ 500100%Less: variable expenses150,00030060%Contribution margin$ 100,000$ 20040%Less: fixed expenses80,000Net income$ 20,000 &A Page &P Sheet2 &A Page &P Sheet3 &A Page &P Sheet4 &A Page &P Sheet5 &A Page &P Sheet6 &A Page &P Sheet7 &A Page &P Sheet8 &A Page &P Sheet9 &A Page &P Sheet10 &A Page &P Sheet11 &A
  • 8.
    Page &P Sheet12 &A Page &P Sheet13 &A Page&P Sheet14 &A Page &P Sheet15 &A Page &P Sheet16 &A Page &P Contribution-Margin Approach Here is the proof! 7-* 400 × $500 = $200,000 400 × $300 = $120,000 The break-even point of 400 units can be proven by first calculating total sales: multiply $500 x 400 units for $200,000 in total sales. The variable expenses are $300 per unit x 400 units, which is $120,000. Total sales less total variable expenses is total contribution margin of $80,000.
  • 9.
    When fixed expensesof $80,000 are deducted from the total contribution margin, leaving $0 in net income. (LO 7-2) Sheet1TotalPer UnitPercentSales (400 surf boards)$ 200,000$ 500100%Less: variable expenses120,00030060%Contribution margin$ 80,000$ 20040%Less: fixed expenses80,000Net income$ - 0 &A Page &P Sheet2 &A Page &P Sheet3 &A Page &P Sheet4 &A Page &P Sheet5 &A Page &P Sheet6 &A Page &P Sheet7 &A Page &P Sheet8 &A Page &P Sheet9 &A Page &P Sheet10 &A Page &P
  • 10.
    Sheet11 &A Page &P Sheet12 &A Page &P Sheet13 &A Page&P Sheet14 &A Page &P Sheet15 &A Page &P Sheet16 &A Page &P Contribution Margin Ratio Calculate the break-even point in sales dollars rather than units by using the contribution margin ratio. Contribution margin Sales = CM Ratio 7-* Fixed expense CM Ratio Break-even point (in sales dollars) =
  • 11.
    Sometimes management prefersthat the break-even point be expressed in sales dollars rather than units. This can be accomplished by using the contribution margin ratio. The formula for the contribution margin ratio is contribution margin divided by sales. Then divide fixed expenses by the contribution margin ratio to determine the total sales dollars at the break-even point. (LO 7- 2) Contribution Margin Ratio 7-* $80,000 40% $200,000 in sales = For Curl, Inc., the fixed costs of $80,000 are divided by the contribution margin ratio of 40% to determine the break-even sales of $200,000. (LO 7-2) Sheet1TotalPer UnitPercentSales (400 surf boards)$ 200,000$ 500100%Less: variable expenses120,00030060%Contribution margin$ 80,000$ 20040%Less: fixed expenses80,000Net income$ - 0 &A Page &P Sheet2 &A Page &P Sheet3
  • 12.
    &A Page &P Sheet4 &A Page &P Sheet5 &A Page&P Sheet6 &A Page &P Sheet7 &A Page &P Sheet8 &A Page &P Sheet9 &A Page &P Sheet10 &A Page &P Sheet11 &A Page &P Sheet12 &A Page &P Sheet13 &A Page &P Sheet14 &A Page &P Sheet15
  • 13.
    &A Page &P Sheet16 &A Page &P LearningObjective 7-3 – Prepare a cost-volume-profit (CVP) graph and explain how it is used. 7-* Learning Objective 7-3. Prepare a cost-volume-profit (CVP) graph and explain how it is used. Graphing Cost-Volume-Profit Relationships Viewing CVP relationships in a graph gives managers a perspective that can be obtained in no other way. Consider the following information for Curl, Inc.: 7-* While the break-even point conveys useful information to management, it does not show how profit changes as activity changes. Managers will often use a cost-volume-profit (CVP) graph to show the relationship between profit and volume of activity. Consider Curl, Inc. At sales of 300 unit, Curl Inc. incurs a net loss of $20,000. The break-even point occurs at 400 units and a $20,000 profit occurs when sales are at 500 units. (LO 7-3) Sheet1300 units400 units500 unitsSales$ 150,000$ 200,000$
  • 14.
    250,000Less: variable expenses90,000120,000150,000Contribution margin$60,000$ 80,000$ 100,000Less: fixed expenses80,00080,00080,000Net income (loss)$ (20,000)$ - 0$ 20,000 &A Page &P Cost-Volume-Profit Graph Fixed expenses 7-* In step 1, the horizontal and vertical axes are drawn. The vertical axis of the graph is dollars and the horizontal axis is units of sales. In step 2, the fixed-expense line is drawn. It is parallel to the horizontal axis, since fixed expenses do not change with activity. In step 3, compute the total expenses at any volume. Plot that point. For Curl, Inc., look at 400 units. Multiply the unit variable expenses of $300 per unit times 400 units for total variable expenses of $120,000. Add the variable expense to the fixed expenses of $80,000. So at the 400 unit level, total expenses are $200,000. (LO 7-3) Sheet1FCTCTR- 080,00080,000- 010080,000110,00050,00020080,000140,000100,00030080,0001 70,000150,00040080,000200,000200,00050080,000230,000250, 00060080,000260,000300,00070080,000290,000350,00080080,0 00320,000400,000 Sheet2450,000Dollars400,000350,000300,000250,000200,00015 0,000100,00050,000100200300400500600700800Units
  • 15.
    Sheet3 Cost-Volume-Profit Graph Fixed expenses Totalexpenses 7-* In step 4, the total expense line is drawn. Since the total expenses at zero units sold is only the fixed costs, the total expense line crosses the vertical axis at the amount of fixed costs. This line then passes through the point plotted in step 3. (LO 7- 3) Sheet1FCTCTR- 080,00080,000- 010080,000110,00050,00020080,000140,000100,00030080,0001 70,000150,00040080,000200,000200,00050080,000230,000250, 00060080,000260,000300,00070080,000290,000350,00080080,0 00320,000400,000 Sheet2450,000Dollars400,000350,000300,000250,000200,00015 0,000100,00050,000100200300400500600700800Units Sheet3 Cost-Volume-Profit Graph Fixed expenses Total expenses 7-*
  • 16.
    In step 5,compute the total sales revenue at any volume. Plot that point. For Curl, Inc., look at 500 units. Multiply the unit sales price of $500 per unit times 500 units for total sales revenue of $250,000. (LO 7-3) Sheet1FCTCTR- 080,00080,000- 010080,000110,00050,00020080,000140,000100,00030080,0001 70,000150,00040080,000200,000200,00050080,000230,000250, 00060080,000260,000300,00070080,000290,000350,00080080,0 00320,000400,000 Sheet2450,000Dollars400,000350,000300,000250,000200,00015 0,000100,00050,000100200300400500600700800Units Sheet3 Cost-Volume-Profit Graph Fixed expenses Total expenses Total sales 7-* In Step 6, draw the total revenue line. This line passes through the point plotted in step 5 and the origin. (LO 7-3) Sheet1FCTCTR- 080,00080,000- 010080,000110,00050,00020080,000140,000100,00030080,0001 70,000150,00040080,000200,000200,00050080,000230,000250, 00060080,000260,000300,00070080,000290,000350,00080080,0 00320,000400,000 Sheet2450,000Dollars400,000350,000300,000250,000200,00015 0,000100,00050,000100200300400500600700800Units
  • 17.
    Sheet3 Cost-Volume-Profit Graph Fixed expenses Totalexpenses Total sales Break-even point Profit area Loss area 7-* In step 7, the break-even point, the profit area, and the loss area are all labeled. The break-even point is the point at which total expenses and total sales are equal, which is where the two lines cross. The profit area is the area where the total sales line is above the total expenses line. This is where revenues exceed expenses. The loss area is the area where the total expenses line is above the total sales line. This is where expenses exceeds revenues. (LO 7-3) Sheet1FCTCTR- 080,00080,000- 010080,000110,00050,00020080,000140,000100,00030080,0001 70,000150,00040080,000200,000200,00050080,000230,000250, 00060080,000260,000300,00070080,000290,000350,00080080,0 00320,000400,000 Sheet2450,000Dollars400,000350,000300,000250,000200,00015 0,000100,00050,000100200300400500600700800Units Sheet3
  • 18.
    Profit-Volume Graph Some managerslike the profit-volume graph because it focuses on profits and volume. Loss area Profit area Break-even point 7-* Yet another approach to graphing cost-volume-profit relationships is called a profit-volume graph. It highlights the amount of profit or loss. The graph intercepts the vertical axis at the amount equal to fixed expenses at the zero activity level. The graph crosses the horizontal axis at the break-even point. The vertical distance between the horizontal axis and the profit line, at a particular level of sales volume, is the profit or loss at that volume. (LO 7-3) Sheet1FCTCTR- 080,00080,000- 010080,000110,00050,00020080,000140,000100,00030080,0001 70,000150,00040080,000200,000200,00050080,000230,000250, 00060080,000260,000300,00070080,000290,000350,00080080,0 00320,000400,000 Sheet2FCTCTR- 080,00080,000- 010080,000110,00050,000100,00020080,000140,000100,000Pro fit30080,000170,000150,00080,00040080,000200,000200,00050 080,000230,000250,00060,00060080,000260,000300,00070080, 000290,000350,00040,00080080,000320,000400,00020,0000`(2 0,000)100200300400500600700Units(40,000)(60,000)450,0004 00,000350,000300,000250,000200,000150,000100,00050,00010 0200300400500600700800Units
  • 19.
    Sheet3 Learning Objective 7-4– Apply CVP analysis to determine the effect on profit of changes in fixed expenses, variable expenses, sales prices, and sales volume. 7-* Learning Objective 7-4. Apply CVP analysis to determine the effect on profit of changes in fixed expenses, variable expenses, sales prices, and sales volume. Target Net Profit We can determine the number of surfboards that Curl must sell to earn a profit of $100,000 using the contribution margin approach. 7-* Fixed expenses + Target profit Unit contribution margin = Units sold to earn the target profit $80,000 + $100,000 $200 = 900 surf boards When a company has a net profit they are trying to achieve, or a target net profit, the contribution margin approach can be used
  • 20.
    to determine thenumber of units that must be sold. This is very similar to finding the break-even point. The numerator is fixed expenses plus the target profit. The denominator is the contribution margin per unit. The result is the units that need to be sold to earn the targeted net profit. (LO 7-4) Equation Approach Sales revenue – Variable expenses – Fixed expenses = Profit X = 900 surf boards 7-* ($500 × X) ($300 × X) – – $80,000 = $100,000 ($200X) = $180,000 Helen (H) - Slide 21 NN Last sentence: Added the word 'the' after the word 'becomes.' The equation approach also can be used to find the units of sales required to earn a target net profit. Recall that in the profit equation, profit is equal to revenues minus variable and fixed expenses. Recall that profit was set to zero to determine the break-even point. When management has determined a target net profit greater than zero, that number becomes the profit variable in the equation. (LO 7-4)
  • 21.
    Applying CVP Analysis SafetyMarginThe difference between budgeted sales revenue and break-even sales revenue.The amount by which sales can drop before losses occur. 7-* The safety margin of an enterprise is the difference between the budgeted sales revenue and the break-even sales revenue. This is the amount by which sales can drop before losses occur. (LO 7-4) Safety Margin Curl, Inc. has a break-even point of $200,000 in sales. If actual sales are $250,000, the safety margin is $50,000, or 100 surf boards. 7-* Helen (H) - Slide 23 Top text: Expanded the text box and moved the text so that the values in the text was readible. For example, Curl, Inc. has a break-even point when sales are $200,000. If actual sales are $250,000, the margin of safety is $50,000, which is 100 surfboards. (LO 7-4) Sheet1TotalPer UnitPercentSales (500 bikes)$ 250,000$
  • 22.
    500100%Less: variable expenses150,00030060%Contribution margin$100,000$ 20040%Less: fixed expenses80,000Net income$ 20,000Break-even sales 400 unitsActual sales 500 unitsSales$ 200,000$ 250,000Less: variable expenses120,000150,000Contribution margin80,000100,000Less: fixed expenses80,00080,000Net income$ - 0$ 20,000 &A Page &P Changes in Fixed Costs Curl is currently selling 500 surfboards per year. The owner believes that an increase of $10,000 in the annual advertising budget, would increase sales to 540 units. Should the company increase the advertising budget? 7-* Helen (H) - Slide 24 NN Second sentence: Changed the word 'month' after the word 'per' to read 'year.' What would happen to a company’s break-even point if fixed expenses change? Suppose the owner wanted to increase advertising by $10,000 per year in hopes that sales will increase to 540 units. (LO 7-4) Changes in Fixed Costs
  • 23.
    $80,000 + $10,000advertising = $90,000 540 units × $500 per unit = $270,000 7-* If the additional advertising is effective and sales increases to 540 boards, sales revenue would be $270,000, variable expenses would be $162,000 and the contribution margin would be $108,000. Fixed expenses would now be $90,000 and therefore, net income would be $18,000. Net income at the current level is $20,000. (LO 7-4) Sheet1Current Sales (500 Boards)Proposed Sales (540 Boards)Sales$ 250,000$ 270,000Less: variable expenses150,000162,000Contribution margin$ 100,000$ 108,000Less: fixed expenses80,00090,000Net income$ 20,000$ 18,000 &A Page &P Changes in Fixed Costs Sales will increase by $20,000, but net income decreased by $2,000. 7-* So even though sales would increase from $250,000 to $270,000, net income would decrease by $2,000. (LO 7-4) Sheet1Current Sales (500 Boards)Proposed Sales (540 Boards)Sales$ 250,000$ 270,000Less: variable expenses150,000162,000Contribution margin$ 100,000$
  • 24.
    108,000Less: fixed expenses80,00090,000Netincome$ 20,000$ 18,000 &A Page &P Changes in Unit Contribution Margin Because of increases in cost of raw materials, Curl’s variable cost per unit has increased from $300 to $310 per surfboard. With no change in selling price per unit, what will be the new break-even point? X = 422 units (rounded) 7-* ($500 × X) ($310 × X) – – $80,000 = $0 When the variable cost per unit changes, this effects the contribution margin per unit. In turn, the break-even point would also be changed. Look at Curl, Inc. Suppose the variable cost per unit increases to $310 but there is no change in selling price. Using the equation approach, we find that the new break-even point is 422 units, instead of 400 units. (LO 7-4) Changes in Unit
  • 25.
    Contribution Margin Suppose Curl,Inc. increases the price of each surfboard to $550. With no change in variable cost per unit, what will be the new break-even point? X = 320 units 7-* ($550 × X) ($300 × X) – – $80,000 = $0 Changing the unit sales price will also alter the unit contribution margin. Suppose the price is raised from $500 to $550. This change will raise the unit contribution margin from $200 to $250. The new break-even point will be 320 units ($80,000 / $250). A $50 increase in the sales price will lower the break-even point from 400 to 320 surf boards. But is this change desirable? A lower break-even point may seem like a good thing if sales are slow. However, Curl may be more likely to at least break even with a lower sales price. Maybe sales volume would drop dramatically if the price is raised to $550. Management must try to predict the reaction of the consumers. CVP analysis provides valuable information, but it is only one of several elements that influence management’s decisions. (LO 7-4) Predicting Profit Given Expected Volume
  • 26.
    7-* Fixed expenses Unit contributionmargin Target net profit Find: {req’d sales volume} Given: Fixed expenses Unit contribution margin Expected sales volume Find: {expected profit} Given: So far, we have focused on finding the required sales volume to break even or achieve a particular target net profit. We can also use CVP analysis to determine the expected profit if fixed expenses, unit contribution margin, and expected sales volume are known. (LO 7-4) Predicting Profit Given Expected Volume In the coming year, Curl’s owner expects to sell 525 surfboards. The unit contribution margin is expected to be $190, and fixed costs are expected to increase to $90,000. X = $9,750 profit X = $99,750 – $90,000 Total contribution - Fixed cost = Profit 7-* ($190 × 525) – $90,000 = X
  • 27.
    For example, Curlexpects to sell 525 surfboards in the coming year. Variable costs are expected to increase, which would reduce the unit contribution margin to $190. Fixed costs are also expected to increase to $90,000. The expected profit can be determined by first determining the total contribution. This is the unit contribution times the number of units sold. By deducting the fixed costs, we can see that the expected profit would be $9,750. (LO 7-4) Learning Objective 7-5 – Compute the break-even point and prepare a profit-volume graph for a multiproduct enterprise. 7-* Learning Objective 7-5. Compute the break-even point and prepare a profit-volume graph for a multiproduct enterprise. CVP Analysis with Multiple Products For a company with more than one product, sales mix is the relative combination in which a company’s products are sold. Different products have different selling prices, cost structures, and contribution margins. Let’s assume Curl sells surfboards and sailboards and see how we deal with break-even analysis. 7-*
  • 28.
    Helen (H) -Slide 32 Bottom text: Changed the words 'sail boards' to read 'sailboards.' If a company sells more than one product, the relative combination in which a company’s products are sold is referred to as the sales mix. With different selling prices, contribution margins, and fixed costs, it now becomes more difficult to determine the break- even point. Let’s assume that Curl, Inc. also sells sailboards. (LO 7-5) CVP Analysis with Multiple Products Curl provides us with the following: information: 7-* The unit selling price, variable cost, and contribution margin are known for each of the two products that Curl sells. Surf boards make up 62.5% of Curl’s total sales and the sailboards make up the other 37.5%. (LO 7-5) Sheet1DescriptionSelling PriceUnit Variable CostUnit Contribution MarginNumber of BoardsSurfboards$ 500$ 300$ 200500Sailboards1,000450550300Total sold800 Sheet2 Sheet3 Sheet4 Sheet5 Sheet6
  • 29.
    Sheet1DescriptionNumber of Boards%of TotalSurfboards50062.5%(500 ÷ 800)Sailboards30037.5%(300 ÷ 800)Total sold800100.0% Sheet2 Sheet3 Sheet4 Sheet5 Sheet6 CVP Analysis with Multiple Products Weighted-average unit contribution margin $200 × 62.5% $550 × 37.5% 7-* The sales mix is used to compute a weighted-average unit contribution margin. This is the average of all products’ unit contribution margins, weighted by the relative sales proportion of each product. For Curl, surfboards have a unit contribution margin of $200, which is multiplied by the 62.5% sales proportion. The weighted contribution margin for the surfboards is $125. The same formula is used to calculate the weighted contribution margin for sailboards, which is $206.25. The total weighted average contribution margin for Curl’s products is $331.25. (LO 7-5) Sheet1DescriptionContribution Margin% of TotalWeighted ContributionSurfboards$ 20062.5%$ 125.00Sailboards55037.5%206.25Weighted-average contribution margin$ 331.25 Sheet2
  • 30.
    Sheet3 Sheet4 Sheet5 Sheet6 CVP Analysis withMultiple Products Break-even point Break-even point = Fixed expenses Weighted-average unit contribution margin Break-even point = $170,000 $331.25 Break-even point = 514 combined unit sales 7-* The break-even point can be calculated using the contribution margin approach. The total fixed costs are divided by the weighted average unit contribution margin. For Curl, the calculation is $170,000 divided by $331.25, which is 514 total units to be sold. (LO 7-5) CVP Analysis with Multiple Products
  • 31.
    Break-even point Break-even point = 514 combinedunit sales 7-* The total units are then multiplied by the relative sales proportion to determine the individual product sales. The number of surfboards to be sold at the break-even point, 514 units is multiplied by 62.5%, which equals 321 units. 514 is multiplied by 37.5% to determine that 193 sailboards must be sold to break-even. The break-even point of 514 units per year is valid only for the sales mix assumed in computing the weighted-average unit contribution margin. (LO 7-5) Sheet1DescriptionBreakeven Sales% of TotalIndividual SalesSurfboards51462.5%321Sailboards51437.5%193Total units514 Sheet2 Sheet3 Sheet4 Sheet5 Sheet6 Learning Objective 7-6 – List and discuss the key assumptions of CVP analysis. 7-* Learning Objective 7-6. List and discuss the key assumptions of CVP analysis.
  • 32.
    Assumptions Underlying CVP Analysis Sellingprice is constant throughout the entire relevant range. Costs are linear over the relevant range. In multi-product companies, the sales mix is constant. In manufacturing firms, inventories do not change (units produced = units sold). 7-* Helen (H) - Slide 38 NN Item 2.A. Moved the text that was wrapped to the previous line. For any cost-volume-profit analysis to be valid, the following important assumptions must be reasonably satisfied within the relevant range. 1. The behavior of total revenue is linear (straight-line). This implies that the price of the product or service will not change as sales volume varies within the relevant range. 2. The behavior of total expenses is linear (straight-line) over the relevant range. This implies the following more specific assumptions. a. Expenses can be categorized as fixed, variable, or semivariable. Total fixed expenses remain constant as activity changes, and the unit variable expense remains unchanged as activity varies. b. The efficiency and productivity of the production process and workers remain constant. 3. In multiproduct organizations, the sales mix remains constant
  • 33.
    over the relevantrange. 4. In manufacturing firms, the inventory levels at the beginning and end of the period are the same. This implies that the number of units produced during the period equals the number of units sold. (LO 7-6) Learning Objective 7-7 – Prepare and interpret a contribution income statement. 7-* Learning Objective 7-7. Prepare and interpret a contribution income statement. CVP Relationships and the Income Statement 7-* On a traditional income statement, cost of goods sold includes both variable and fixed manufacturing costs, as measured by the firm’s product-costing system. The gross margin is computed by subtracting cost of goods sold from sales. Selling and administrative expenses are then subtracted; each expense includes both variable and fixed costs. The traditional income statement does not disclose the breakdown of each expense into its variable and fixed components. (LO 7-7)
  • 34.
    Sheet1FCTCTR- 080,00080,000- 010080,000110,00050,00020080,000140,000100,00030080,0001 70,000150,00040080,000200,000200,00050080,000230,000250, 00060080,000260,000300,00070080,000290,000350,00080080,0 00320,000400,000 Sheet2FCTCTR- 080,00080,000- 010080,000110,00050,000100,00020080,000140,000100,000Pro fit30080,000170,000150,00080,00040080,000200,000200,00050 080,000230,000250,00060,00060080,000260,000300,00070080, 000290,000350,00040,00080080,000320,000400,00020,0000`(2 0,000)100200300400500600700Units(40,000)(60,000)450,0004 00,000350,000300,000250,000200,000150,000100,00050,00010 0200300400500600700800Units Sheet3 Sheet4A.Traditional FormatACCUTIME COMPANYIncome StatementFor the Year Ended December 31, 20x1Sales$500,000Less:380,000Gross margin$120,000Less: Operating expenses:Selling expenses$35,000Administrative expenses35,00070,000Net income$50,000B. Contribution FormatACCUTIME COMPANYIncome StatementFor the Year Ended December 31, 20x1Sales$500,000Less: Variable expenses:Variable manufacturing$280,000Variable selling15,000Variable administrative5,000300,000Contribution margin$200,000Less: Fixed expenses:Fixed manufacturing$100,000Fixed selling20,000Fixed administrative30,000150,000Net income$50,000 CVP Relationships and the Income Statement
  • 35.
    7-* Many operating managersfind the traditional income-statement format difficult to use, because it does not separate variable and fixed expenses. Instead they prefer the contribution income statement. The contribution format highlights the distinction between variable and fixed expenses. On the contribution income statement, all variable expenses are subtracted from sales to obtain the contribution margin. All fixed costs are then subtracted from the contribution margin to obtain net income. Operating managers frequently prefer the contribution income statement, because its separation of fixed and variable expenses highlights cost-volume-profit relationships. It is readily apparent from the contribution-format statement how income will be affected when sales volume changes by a given percentage. (LO7-7) Sheet1FCTCTR- 080,00080,000- 010080,000110,00050,00020080,000140,000100,00030080,0001 70,000150,00040080,000200,000200,00050080,000230,000250, 00060080,000260,000300,00070080,000290,000350,00080080,0 00320,000400,000 Sheet2FCTCTR- 080,00080,000- 010080,000110,00050,000100,00020080,000140,000100,000Pro fit30080,000170,000150,00080,00040080,000200,000200,00050 080,000230,000250,00060,00060080,000260,000300,00070080, 000290,000350,00040,00080080,000320,000400,00020,0000`(2 0,000)100200300400500600700Units(40,000)(60,000)450,0004 00,000350,000300,000250,000200,000150,000100,00050,00010 0200300400500600700800Units Sheet3 Sheet4A. Traditional FormatACCUTIME COMPANYIncome StatementFor the Year Ended December 31,
  • 36.
    20x1Sales$500,000Less:380,000Gross margin$120,000Less: Operating expenses:Sellingexpenses$35,000Administrative expenses35,00070,000Net income$50,000B. Contribution FormatACCUTIME COMPANYIncome StatementFor the Year Ended December 31, 20x1Sales$500,000Less: Variable expenses:Variable manufacturing$280,000Variable selling15,000Variable administrative5,000300,000Contribution margin$200,000Less: Fixed expenses:Fixed manufacturing$100,000Fixed selling20,000Fixed administrative30,000150,000Net income$50,000 Learning Objective 7-8 – Explain the role of cost structure and operating leverage in CVP relationships. 7-* Learning Objective 7-8. Explain the role of cost structure and operating leverage in CVP relationships. Cost Structure and Operating Leverage The cost structure of an organization is the relative proportion of its fixed and variable costs. Operating leverage is: the extent to which an organization uses fixed costs in its cost structure. greatest in companies that have a high proportion of fixed costs in relation to variable costs. 7-*
  • 37.
    The cost structureof an organization is the relative proportion of its fixed and variable costs. Cost structures differ widely among industries and among firms within an industry. A company using a computer-integrated manufacturing system has a large investment in plant and equipment, which results in a cost structure dominated by fixed costs. In contrast, a home builder contractor’s cost structure has a much higher proportion of variable costs. The highly automated manufacturing firm is capital-intensive, whereas the home building contractor is labor-intensive. An organization’s cost structure has a significant effect on the sensitivity of its profit to changes in volume. The extent to which an organization uses fixed costs in its cost structure is called operating leverage. The operating leverage is greatest in firms with a large proportion of fixed costs, low proportion of variable costs, and the resulting high contribution margin ratio. (LO 7-8) Measuring Operating Leverage Contribution margin Net income Operating leverage factor = 7-* $100,000 $20,000 = 5
  • 38.
    The managerial accountantcan measure a firm’s operating leverage, at a particular sales volume, using the operating leverage factor. The formula is contribution margin divided by net income. At sales of 500 surfboards, Curl’s contribution margin is $100,000 and net income is $20,000; therefore, its operating leverage factor is 5. (LO 7-8) Sheet1TotalPer UnitPercentSales (500 bikes)$ 250,000$ 500100%Less: variable expenses150,00030060%Contribution margin$ 100,000$ 20040%Less: fixed expenses80,000Net income$ 20,000Actual sales 500 BoardActual sales 500 unitsSales$ 250,000$ 250,000Less: variable expenses150,000150,000Contribution margin100,000100,000Less: fixed expenses80,00080,000Net income$ 20,000$ 20,000 &A Page &P Measuring Operating Leverage A measure of how a percentage change in sales will affect profits. If Curl increases its sales by 10%, what will be the percentage increase in net income? 7-* The operating leverage factor is a measure, at a particular level of sales, of the percentage impact on net income of a given percentage change in sales revenue. Multiplying the percentage change in sales revenue by the operating leverage factor yields the percentage change in net income. At Curl, Inc., a 10% increase in sales would be multiplied by the operating leverage of 5.
  • 39.
    Therefore, if Curlexperiences a 10% increase in sales, it can expect a 50% increase in net income. (LO 7-8) Sheet1Percent increase in sales10%Operating leverage factor×5Percent increase in profits50% &A Page &P Measuring Operating Leverage A firm with proportionately high fixed costs has relatively high operating leverage. On the other hand, a firm with high operating leverage has a relatively high break-even point. 7-* A firm’s cost structure plays an important role in determining its cost-volume-profit relationships. A company with proportionately high fixed cost has relatively high operating leverage. The result of high operating leverage is that the firm can generate a large percentage increase in net income from a relatively small percentage increase in sales revenue. On the other hand, a firm with high operating leverage has a relatively high break-even point. This entails some risk to the firm. (LO 7-8) Learning Objective 7-9 – Understand the implications of activity-based costing for CVP analysis. 7-* Learning Objective 7-9. Understand the implications of activity-
  • 40.
    based costing forCVP analysis. CVP Analysis, Activity-Based Costing, and Advanced Manufacturing Systems An activity-based costing system provides a much more complete picture of cost-volume-profit relationships and, thus, it provides better information to managers. 7-* Break-even point = Fixed costs Unit contribution margin Traditional cost-volume-profit analysis focuses on the number of units sold as the only cost and revenue driver. Sales revenue is assumed to be linear in units sold. Moreover, costs are categorized as fixed or variable, with respect to the number of units sold, within the relevant range. This approach is consistent with traditional product-costing systems, in which cost assignment is based on a single, volume- related cost driver. In CVP analysis, as in product costing, the traditional approach can be misleading or provide less than adequate information for various management purposes. An activity based costing system provides a much more complete picture of cost-volume-profit relationships and, thus, it provides better information to managers. (LO 7-9) Learning Objective 7-10 – Be aware of the effects of advanced
  • 41.
    manufacturing technology onCVP relationships. 7-* Learning Objective 7-10. Be aware of the effects of advanced manufacturing technology on CVP relationships. A Move Toward JIT and Flexible Manufacturing Overhead costs like setup, inspection, and material handling are fixed with respect to sales volume, but they are not fixed with respect to other cost drivers. This is the fundamental distinction between a traditional CVP analysis and an activity-based costing CVP analysis. 7-* The point of this section is that activity-based costing provides a richer description of a company’s cost behavior. Just as ABC can improve an organization’s product-costing system, it also can facilitate a deeper understanding of cost behavior and CVP relationships. (LO 7-10) Learning Objective 7-11 – Understand the effect of income taxes on CVP analysis (appendix). 7-* Learning Objective 11. Understand the effect of income taxes
  • 42.
    on CVP analysis(appendix). Effect of Income Taxes Income taxes affect a company’s CVP relationships. To earn a particular after-tax net income, a greater before-tax income will be required. 7-* Target after-tax net income 1 - t = Before-tax net income The requirement that companies pay income taxes affects their cost-volume-profit relationships. To earn a particular after-tax net income, a greater before-tax income will be required. To determine what the before-tax net income is, the after-tax net income is divided by 1 minus the tax rate. The formulas presented in this chapter can now be used with the before-tax net income to provide for the effect of taxes. (LO 7- 11) End of Chapter 7 7-* Sales250,000$ Less: variable expenses150,000 Contribution margin100,000
  • 43.
    Less: fixed expenses100,000 Netincome-$ Total Per Unit Percent Sales (500 surf boards) 250,000 $ 500 $ 100% Less: variable expenses 150,000 300 60% Contribution margin 100,000 $ 200 $ 40% Less: fixed expenses 80,000 Net income 20,000 $
  • 44.
    Total Per Unit Percent Sales ( 400 surfboards) 200,000 $ 500 $ 100% Less: variable expenses 120,000 300 60% Contribution margin 80,000 $ 200 $ 40% Less: fixed expenses 80,000 Net income -
  • 45.
    $ 300 units400 units500units Sales150,000$ 200,000$ 250,000$ Less: variable expenses90,000 120,000 150,000 Contribution margin60,000$ 80,000$ 100,000$ Less: fixed expenses80,000 80,000 80,000 Net income (loss)(20,000)$ -$ 20,000$ Dollars 600700800 Units 200300400500 450,000 100 200,000 150,000 100,000 50,000 400,000 350,000 300,000 250,000 ` 100200300400500600700 Units Profit 0 100,000 (20,000) (40,000) (60,000) 80,000 60,000 40,000
  • 46.
    20,000 Break-even sales 400 units Actual sales 500units Sales 200,000 $ 250,000 $ Less: variable expenses 120,000 150,000 Contribution margin 80,000 100,000 Less: fixed expenses 80,000 80,000 Net income -
  • 47.
    $ 20,000 $ Current Sales (500 Boards) Proposed Sales (540 Boards) Sales250,000$270,000$ Less: variable expenses150,000 162,000 Contribution margin100,000$ 108,000$ Less: fixed expenses80,000 90,000 Net income20,000$ 18,000$ Current Sales (500 Boards) Proposed Sales (540 Boards) Sales250,000$ 270,000$ Less: variable expenses150,000 162,000 Contribution margin100,000$ 108,000$ Less: fixed expenses80,000 90,000 Net income20,000$ 18,000$ Description Selling Price Unit Variable Cost Unit Contribution Margin
  • 48.
    Number of Boards Surfboards500$ 300$ 200$500 Sailboards1,000 450 550 300 Total sold800 Description Number of Boards % of Total Surfboards500 62.5%(500 ÷ 800) Sailboards300 37.5%(300 ÷ 800) Total sold800 100.0% Description Contribution Margin % of Total Weighted Contribution Surfboards200$ 62.5%125.00$ Sailboards550 37.5%206.25 Weighted-average contribution margin331.25$ Description Breakeven Sales % of Total Individual Sales Surfboards51462.5%321 Sailboards51437.5%193 Total units514 A. Traditional Format Sales $500,000 Less: 380,000
  • 49.
    Gross margin$120,000 Less: Operatingexpenses: Selling expenses $35,000 Administrative expenses 35,00070,000 Net income $50,000 ACCUTIME COMPANY Income Statement For the Year Ended December 31, 20x1 B. Contribution Format Sales $500,000 Less: Variable expenses: Variable manufacturing $280,000 Variable selling 15,000 Variable administrative 5,000300,000 Contribution margin $200,000 Less: Fixed expenses: Fixed manufacturing $100,000 Fixed selling 20,000 Fixed administrative30,000150,000 Net income $50,000 Income Statement For the Year Ended December 31, 20x1 ACCUTIME COMPANY Actual sales 500 Board Sales 250,000 $ Less: variable expenses 150,000 Contribution margin 100,000
  • 50.
    Less: fixed expenses 80,000 Netincome 20,000 $ Percent increase in sales10% Operating leverage factor× 5 Percent increase in profits50% Weekly Worksheet: MLKJ & Malcolm X 1. What are the three kinds of love MLKJ discusses? How does he define them? 2. What are the reasons for pursuing nonviolent resistance? What does MLKJ suggest would be the consequences of violent resistance? 3. In his reflections, Malcolm X regrets having told the young girl from South Carolina that there is nothing she can do. What does Malcolm X suggest that white people in the 1960s could do to help civil rights? What are his reasons for this? Spend some
  • 51.
    good time onthis question and open up the PDF to find his answer. 4. Towards the end of the excerpt (pg 4-5), Malcolm X discusses he wished he could return for more education, maybe to study foreign languages. Why is this so important for Malcolm X at the end of his life? Is there a connection between education and civil rights? Or is it between education and self- empowerment? Explore.