The Break-Even Point
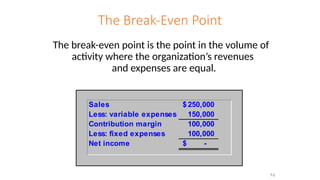
Thebreak-even point is the point in the volume of
activity where the organization’s revenues
and expenses are equal.
Sales 250,000
$
Less: variable expenses 150,000
Contribution margin 100,000
Less: fixed expenses 100,000
Net income -
$
7-2
3.
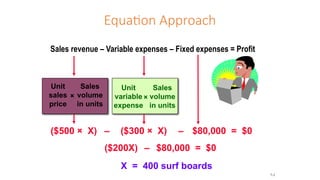
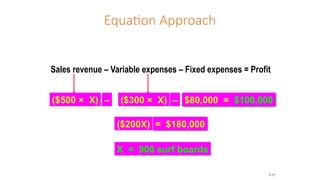
Equation Approach
Sales revenue– Variable expenses – Fixed expenses = Profit
Unit
sales
price
Sales
volume
in units
×
Unit
variable
expense
Sales
volume
in units
×
($500 × X) ($300 × X)
– – $80,000 = $0
($200X) – $80,000 = $0
X = 400 surf boards
7-3
4.
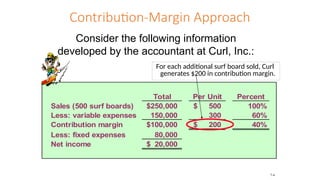
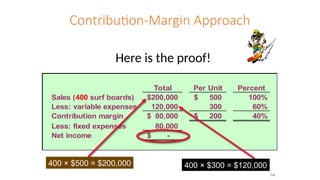
Contribution-Margin Approach
For eachadditional surf board sold, Curl
generates $200 in contribution margin.
Total Per Unit Percent
Sales (500 surf boards) 250,000
$ 500
$ 100%
Less: variable expenses 150,000 300 60%
Contribution margin 100,000
$ 200
$ 40%
Less: fixed expenses 80,000
Net income 20,000
$
Consider the following information
developed by the accountant at Curl, Inc.:
7-4
5.
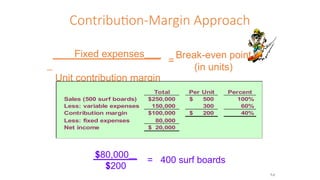
Contribution-Margin Approach
Fixed expenses
Unitcontribution margin
=
Break-even point
(in units)
Total Per Unit Percent
Sales (500 surf boards) 250,000
$ 500
$ 100%
Less: variable expenses 150,000 300 60%
Contribution margin 100,000
$ 200
$ 40%
Less: fixed expenses 80,000
Net income 20,000
$
$80,000
$200
= 400 surf boards
7-5
6.
Contribution-Margin Approach
Here isthe proof!
Total Per Unit Percent
Sales (400 surf boards) 200,000
$ 500
$ 100%
Less: variable expenses 120,000 300 60%
Contribution margin 80,000
$ 200
$ 40%
Less: fixed expenses 80,000
Net income -
$
400 × $500 = $200,000 400 × $300 = $120,000
7-6
7.
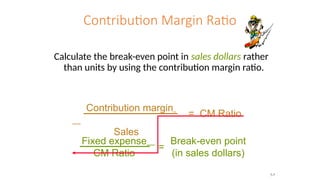
Contribution Margin Ratio
Calculatethe break-even point in sales dollars rather
than units by using the contribution margin ratio.
Contribution margin
Sales
= CM Ratio
Fixed expense
CM Ratio
Break-even point
(in sales dollars)
=
7-7
8.
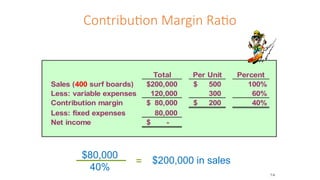
Total Per UnitPercent
Sales (400 surf boards) 200,000
$ 500
$ 100%
Less: variable expenses 120,000 300 60%
Contribution margin 80,000
$ 200
$ 40%
Less: fixed expenses 80,000
Net income -
$
Contribution Margin Ratio
$80,000
40%
$200,000 in sales
=
7-8
9.
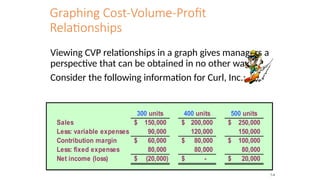
Graphing Cost-Volume-Profit
Relationships
Viewing CVPrelationships in a graph gives managers a
perspective that can be obtained in no other way.
Consider the following information for Curl, Inc.:
300 units 400 units 500 units
Sales 150,000
$ 200,000
$ 250,000
$
Less: variable expenses 90,000 120,000 150,000
Contribution margin 60,000
$ 80,000
$ 100,000
$
Less: fixed expenses 80,000 80,000 80,000
Net income (loss) (20,000)
$ -
$ 20,000
$
7-9
Cost-Volume-Profit Graph
Dollars
600 700800
Units
200 300 400 500
450,000
100
200,000
150,000
100,000
50,000
400,000
350,000
300,000
250,000
Fixed expenses
Total expenses
Total sales
7-13
14.
Cost-Volume-Profit Graph
Dollars
600 700800
Units
200 300 400 500
450,000
100
200,000
150,000
100,000
50,000
400,000
350,000
300,000
250,000
Fixed expenses
Total expenses
Total sales
Break-even
point Profit area
Loss area
7-14
15.
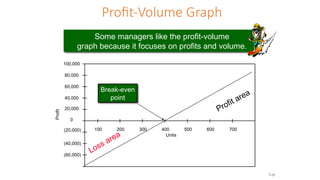
Profit-Volume Graph
Some managerslike the profit-volume
graph because it focuses on profits and volume.
`
100 200 300 400 500 600 700
Units
Profit
0
100,000
(20,000)
(40,000)
(60,000)
80,000
60,000
40,000
20,000
Loss area
Profit area
Break-even
point
7-15
16.
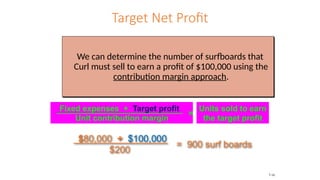
Target Net Profit
Wecan determine the number of surfboards that
Curl must sell to earn a profit of $100,000 using the
contribution margin approach.
Fixed expenses + Target profit
Unit contribution margin
=
Units sold to earn
the target profit
$80,000 + $100,000
$200
= 900 surf boards
7-16
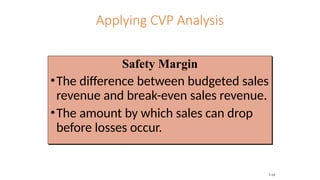
Applying CVP Analysis
SafetyMargin
•The difference between budgeted sales
revenue and break-even sales revenue.
•The amount by which sales can drop
before losses occur.
7-18
19.
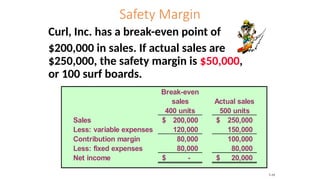
Safety Margin
Curl, Inc.has a break-even point of
$200,000 in sales. If actual sales are
$250,000, the safety margin is $50,000,
or 100 surf boards.
Break-even
sales
400 units
Actual sales
500 units
Sales 200,000
$ 250,000
$
Less: variable expenses 120,000 150,000
Contribution margin 80,000 100,000
Less: fixed expenses 80,000 80,000
Net income -
$ 20,000
$
7-19
20.
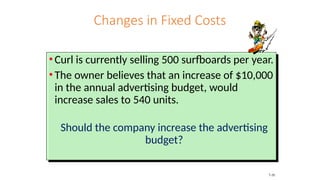
Changes in FixedCosts
• Curl is currently selling 500 surfboards per year.
• The owner believes that an increase of $10,000
in the annual advertising budget, would
increase sales to 540 units.
Should the company increase the advertising
budget?
7-20
21.
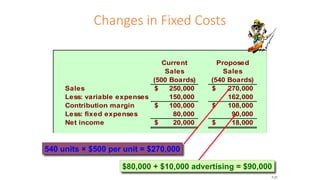
Current
Sales
(500 Boards)
Proposed
Sales
(540 Boards)
Sales250,000
$ 270,000
$
Less: variable expenses 150,000 162,000
Contribution margin 100,000
$ 108,000
$
Less: fixed expenses 80,000 90,000
Net income 20,000
$ 18,000
$
Changes in Fixed Costs
$80,000 + $10,000 advertising = $90,000
540 units × $500 per unit = $270,000
7-21
22.
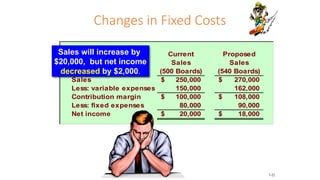
Current
Sales
(500 Boards)
Proposed
Sales
(540 Boards)
Sales250,000
$ 270,000
$
Less: variable expenses 150,000 162,000
Contribution margin 100,000
$ 108,000
$
Less: fixed expenses 80,000 90,000
Net income 20,000
$ 18,000
$
Changes in Fixed Costs
Sales will increase by
$20,000, but net income
decreased by $2,000.
7-22
23.
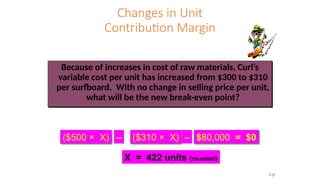
Changes in Unit
ContributionMargin
Because of increases in cost of raw materials, Curl’s
variable cost per unit has increased from $300 to $310
per surfboard. With no change in selling price per unit,
what will be the new break-even point?
($500 × X) ($310 × X)
– – $80,000 = $0
X = 422 units (rounded)
7-23
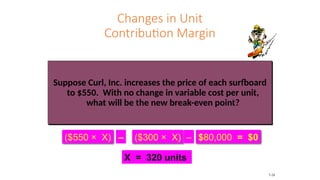
24.
Changes in Unit
ContributionMargin
Suppose Curl, Inc. increases the price of each surfboard
to $550. With no change in variable cost per unit,
what will be the new break-even point?
($550 × X) ($300 × X)
– – $80,000 = $0
X = 320 units
7-24
25.
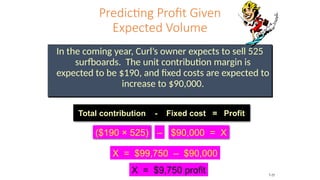
Predicting Profit Given
ExpectedVolume
In the coming year, Curl’s owner expects to sell 525
surfboards. The unit contribution margin is
expected to be $190, and fixed costs are expected to
increase to $90,000.
($190 × 525) – $90,000 = X
X = $9,750 profit
X = $99,750 – $90,000
Total contribution - Fixed cost = Profit
7-25
26.
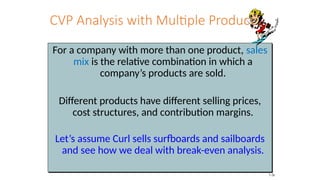
CVP Analysis withMultiple Products
For a company with more than one product, sales
mix is the relative combination in which a
company’s products are sold.
Different products have different selling prices,
cost structures, and contribution margins.
Let’s assume Curl sells surfboards and sailboards
and see how we deal with break-even analysis.
7-26
27.
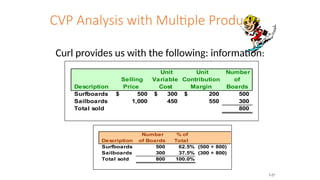
CVP Analysis withMultiple Products
Curl provides us with the following: information:
Description
Selling
Price
Unit
Variable
Cost
Unit
Contribution
Margin
Number
of
Boards
Surfboards 500
$ 300
$ 200
$ 500
Sailboards 1,000 450 550 300
Total sold 800
Description
Number
of Boards
% of
Total
Surfboards 500 62.5% (500 ÷ 800)
Sailboards 300 37.5% (300 ÷ 800)
Total sold 800 100.0%
7-27
CVP Analysis withMultiple Products
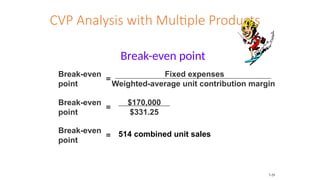
Break-even point
Break-even
point
=
Fixed expenses
Weighted-average unit contribution margin
Break-even
point
=
$170,000
$331.25
Break-even
point
= 514 combined unit sales
7-29
30.
CVP Analysis withMultiple Products
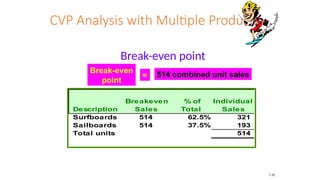
Break-even point
Break-even
point
= 514 combined unit sales
Description
Breakeven
Sales
% of
Total
Individual
Sales
Surfboards 514 62.5% 321
Sailboards 514 37.5% 193
Total units 514
7-30
31.
Assumptions Underlying
CVP Analysis
1.Selling price is constant throughout the
entire relevant range.
2. Costs are linear over the relevant
range.
3. In multi-product companies, the sales
mix is constant.
4. In manufacturing firms, inventories do
not change (units produced = units
sold).
7-31
Editor's Notes
#2 The break-even point is the volume of activity where the organization’s revenues and expenses are equal.
At this amount of sales, the organization has no profit or loss; it breaks even.
This chapter will introduce an income statement highlighting the distinction between variable and fixed expenses. Notice that this income statement highlights the distinction between variable and fixed expenses.
The statement also shows the total contribution margin, which is defined as total sales revenue minus total variable expenses.
Total contribution margin is the amount of revenue that is available to contribute to covering fixed expenses after all variable expenses have been covered. (LO 7-1)
#3 The equation approach can be used to find the break-even point.
This approach is based on the profit equation.
Income (or profit) is equal to sales revenue minus expenses.
Expenses can be separated in variable and fixed expenses.
At the break-even point, net income is $0. (LO 7-1)
#4 Curl, Inc. manufactures surf boards. Each surf board sells for $500 and has variable costs of $300. (LO 7-2)
Therefore, the contribution margin per unit is $200. When enough surf boards are sold so that the total contribution margin is $80,000, Curl Inc. will break even for the period. (LO 7-2)
#5 To compute the break-even volume of surf boards, divide the total fixed expenses by the unit contribution margin.
For Curl, Inc., $80,000 is divided by $200, which equates to 400 surf boards. That means that the company must sell 400 surfboards to break-even. (LO 7-2)
#6 The break-even point of 400 units can be proven by first calculating total sales: multiply $500 x 400 units for $200,000 in total sales.
The variable expenses are $300 per unit x 400 units, which is $120,000.
Total sales less total variable expenses is total contribution margin of $80,000.
When fixed expenses of $80,000 are deducted from the total contribution margin, leaving $0 in net income. (LO 7-2)
#7 Sometimes management prefers that the break-even point be expressed in sales dollars rather than units.
This can be accomplished by using the contribution margin ratio.
The formula for the contribution margin ratio is contribution margin divided by sales.
Then divide fixed expenses by the contribution margin ratio to determine the total sales dollars at the break-even point. (LO 7-2)
#8 For Curl, Inc., the fixed costs of $80,000 are divided by the contribution margin ratio of 40% to determine the break-even sales of $200,000. (LO 7-2)
#9 While the break-even point conveys useful information to management, it does not show how profit changes as activity changes.
Managers will often use a cost-volume-profit (CVP) graph to show the relationship between profit and volume of activity.
Consider Curl, Inc. At sales of 300 unit, Curl Inc. incurs a net loss of $20,000.
The break-even point occurs at 400 units and a $20,000 profit occurs when sales are at 500 units. (LO 7-3)
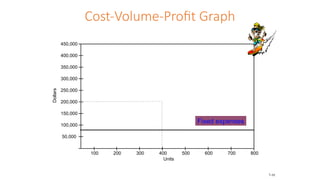
#10 In step 1, the horizontal and vertical axes are drawn. The vertical axis of the graph is dollars and the horizontal axis is units of sales.
In step 2, the fixed-expense line is drawn. It is parallel to the horizontal axis, since fixed expenses do not change with activity.
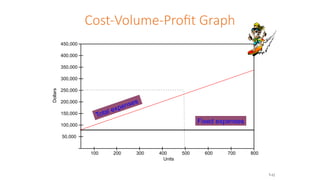
In step 3, compute the total expenses at any volume. Plot that point. For Curl, Inc., look at 400 units. Multiply the unit variable expenses of $300 per unit times 400 units for total variable expenses of $120,000. Add the variable expense to the fixed expenses of $80,000. So at the 400 unit level, total expenses are $200,000. (LO 7-3)
#11 In step 4, the total expense line is drawn.
Since the total expenses at zero units sold is only the fixed costs, the total expense line crosses the vertical axis at the amount of fixed costs.
This line then passes through the point plotted in step 3. (LO 7-3)
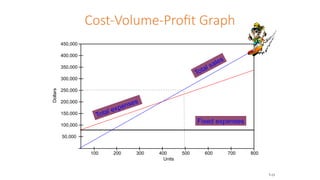
#12 In step 5, compute the total sales revenue at any volume.
Plot that point.
For Curl, Inc., look at 500 units.
Multiply the unit sales price of $500 per unit times 500 units for total sales revenue of $250,000. (LO 7-3)
#13 In Step 6, draw the total revenue line.
This line passes through the point plotted in step 5 and the origin. (LO 7-3)
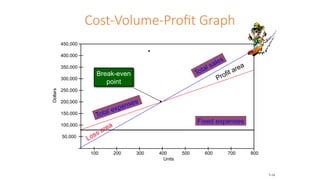
#14 In step 7, the break-even point, the profit area, and the loss area are all labeled.
The break-even point is the point at which total expenses and total sales are equal, which is where the two lines cross.
The profit area is the area where the total sales line is above the total expenses line.
This is where revenues exceed expenses.
The loss area is the area where the total expenses line is above the total sales line.
This is where expenses exceeds revenues. (LO 7-3)
#15 Yet another approach to graphing cost-volume-profit relationships is called a profit-volume graph.
It highlights the amount of profit or loss.
The graph intercepts the vertical axis at the amount equal to fixed expenses at the zero activity level.
The graph crosses the horizontal axis at the break-even point.
The vertical distance between the horizontal axis and the profit line, at a particular level of sales volume, is the profit or loss at that volume. (LO 7-3)
#16 When a company has a net profit they are trying to achieve, or a target net profit, the contribution margin approach can be used to determine the number of units that must be sold.
This is very similar to finding the break-even point.
The numerator is fixed expenses plus the target profit. The denominator is the contribution margin per unit.
The result is the units that need to be sold to earn the targeted net profit. (LO 7-4)
#17 The equation approach also can be used to find the units of sales required to earn a target net profit. Recall that in the profit equation, profit is equal to revenues minus variable and fixed expenses. Recall that profit was set to zero to determine the break-even point. When management has determined a target net profit greater than zero, that number becomes the profit variable in the equation. (LO 7-4)
#18 The safety margin of an enterprise is the difference between the budgeted sales revenue and the break-even sales revenue.
This is the amount by which sales can drop before losses occur. (LO 7-4)
#19 For example, Curl, Inc. has a break-even point when sales are $200,000.
If actual sales are $250,000, the margin of safety is $50,000, which is 100 surfboards. (LO 7-4)
#20 What would happen to a company’s break-even point if fixed expenses change?
Suppose the owner wanted to increase advertising by $10,000 per year in hopes that sales will increase to 540 units. (LO 7-4)
#21 If the additional advertising is effective and sales increases to 540 boards, sales revenue would be $270,000, variable expenses would be $162,000 and the contribution margin would be $108,000.
Fixed expenses would now be $90,000 and therefore, net income would be $18,000.
Net income at the current level is $20,000. (LO 7-4)
#22 So even though sales would increase from $250,000 to $270,000, net income would decrease by $2,000. (LO 7-4)
#23 When the variable cost per unit changes, this effects the contribution margin per unit.
In turn, the break-even point would also be changed.
Look at Curl, Inc.
Suppose the variable cost per unit increases to $310 but there is no change in selling price.
Using the equation approach, we find that the new break-even point is 422 units, instead of 400 units. (LO 7-4)
#24 Changing the unit sales price will also alter the unit contribution margin.
Suppose the price is raised from $500 to $550.
This change will raise the unit contribution margin from $200 to $250.
The new break-even point will be 320 units ($80,000 / $250).
A $50 increase in the sales price will lower the break-even point from 400 to 320 surf boards.
But is this change desirable?
A lower break-even point may seem like a good thing if sales are slow.
However, Curl may be more likely to at least break even with a lower sales price.
Maybe sales volume would drop dramatically if the price is raised to $550.
Management must try to predict the reaction of the consumers.
CVP analysis provides valuable information, but it is only one of several elements that influence management’s decisions. (LO 7-4)
#25 For example, Curl expects to sell 525 surfboards in the coming year.
Variable costs are expected to increase, which would reduce the unit contribution margin to $190.
Fixed costs are also expected to increase to $90,000.
The expected profit can be determined by first determining the total contribution.
This is the unit contribution times the number of units sold.
By deducting the fixed costs, we can see that the expected profit would be $9,750. (LO 7-4)
#26 If a company sells more than one product, the relative combination in which a company’s products are sold is referred to as the sales mix.
With different selling prices, contribution margins, and fixed costs, it now becomes more difficult to determine the break-even point.
Let’s assume that Curl, Inc. also sells sailboards. (LO 7-5)
#27 The unit selling price, variable cost, and contribution margin are known for each of the two products that Curl sells.
Surf boards make up 62.5% of Curl’s total sales and the sailboards make up the other 37.5%. (LO 7-5)
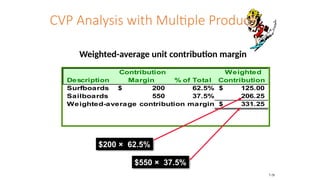
#28 The sales mix is used to compute a weighted-average unit contribution margin.
This is the average of all products’ unit contribution margins, weighted by the relative sales proportion of each product.
For Curl, surfboards have a unit contribution margin of $200, which is multiplied by the 62.5% sales proportion.
The weighted contribution margin for the surfboards is $125.
The same formula is used to calculate the weighted contribution margin for sailboards, which is $206.25.
The total weighted average contribution margin for Curl’s products is $331.25. (LO 7-5)
#29 The break-even point can be calculated using the contribution margin approach.
The total fixed costs are divided by the weighted average unit contribution margin.
For Curl, the calculation is $170,000 divided by $331.25, which is 514 total units to be sold. (LO 7-5)
#30 The total units are then multiplied by the relative sales proportion to determine the individual product sales.
The number of surfboards to be sold at the break-even point, 514 units is multiplied by 62.5%, which equals 321 units.
514 is multiplied by 37.5% to determine that 193 sailboards must be sold to break-even.
The break-even point of 514 units per year is valid only for the sales mix assumed in computing the weighted-average unit contribution margin. (LO 7-5)
#31 For any cost-volume-profit analysis to be valid, the following important assumptions must be reasonably satisfied within the relevant range.
1. The behavior of total revenue is linear (straight-line). This implies that the price of the product or service will not change as sales volume varies within the relevant range.
2. The behavior of total expenses is linear (straight-line) over the relevant range. This implies the following more specific assumptions.
a. Expenses can be categorized as fixed, variable, or semivariable. Total fixed expenses remain constant as activity changes, and the unit variable expense remains unchanged as activity varies.
b. The efficiency and productivity of the production process and workers remain constant.
3. In multiproduct organizations, the sales mix remains constant over the relevant range.
4. In manufacturing firms, the inventory levels at the beginning and end of the period are the same. This implies that the number of units produced during the period equals the number of units sold.
(LO 7-6)