This document discusses correlation, regression, and cluster analysis as statistical methods for forecasting. Correlation quantifies the relationship between two variables from -1 to 1. Regression constructs an equation describing the relationship between variables to forecast scenarios. Cluster analysis groups objects with similar characteristics into clusters to categorize large amounts of data. The document recommends using cluster analysis to analyze consumer survey responses that have interdependent factors. It provides examples of how companies have used cluster analysis for market segmentation, product categorization, and anomaly detection.


![Flexibility
Patience
Amiability
Professional Identity
Total Score
[Enter your score here]
Part B: Click here and pull up the Multicultural Awareness,
Knowledge, and Skills Survey (MAKSS).Complete the MAKSS
survey and write a brief one paragraph summary (75 to 150
words) of what you learned about yourself from taking the
survey.
MAKSS Survey Reflection:](https://image.slidesharecdn.com/correlationandregressionforecastingisacriticaljobformana-230108063814-b4a2e260/75/Correlation-and-RegressionForecasting-is-a-critical-job-for-mana-docx-6-2048.jpg)
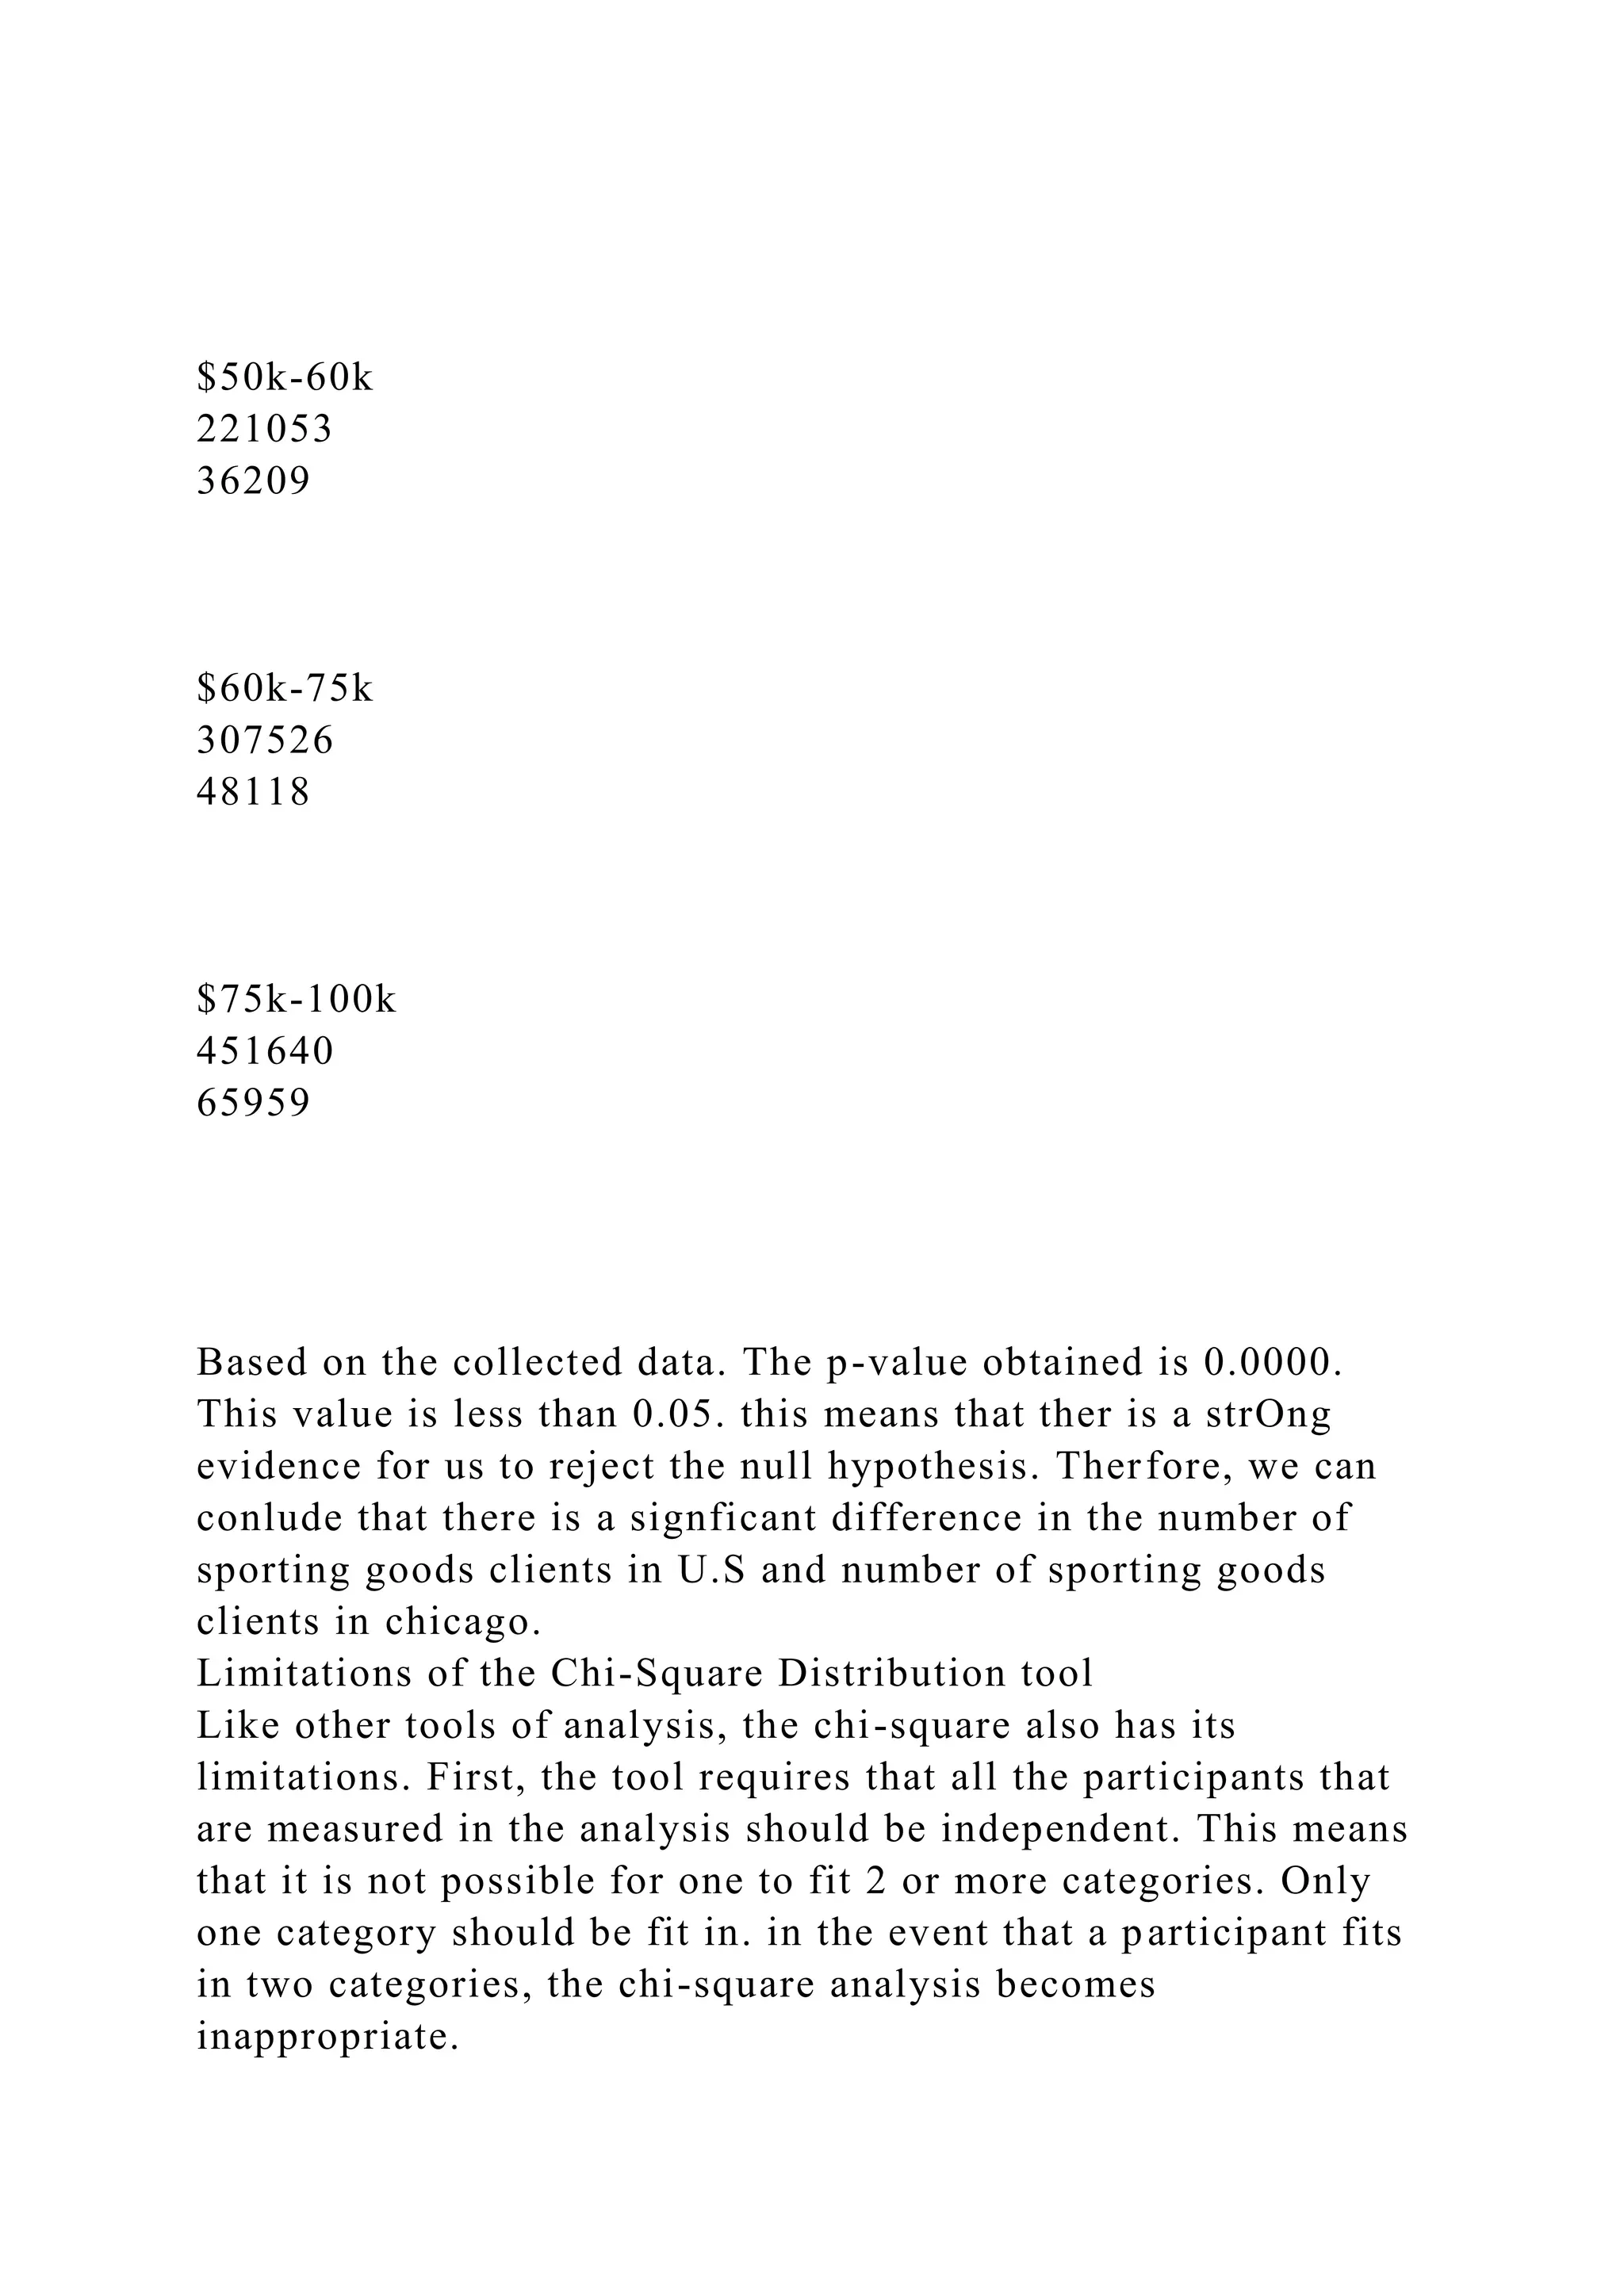
![Another limitation us that the data used must be frequency data.
For example, in our case if we are just measuring if the outdoor
sporting goods are on demand, the chi square become
appropriate (Naghettini, 2016). This is because we shall be
calculating the expected clients to purchase the outdoor sporting
goods. Since our research was based on income categories and
there were more than 5 expected clients, the chi square becomes
more appropriate. The chi square also requires a high sample
size which is not less than 50. In our cases, the sample size was
more than 50 making it appropriate.
Conclusion
Big D decide to expand and grow its business in Chicago.
Various factors will impact the outcomes of this decision, this
include the population, per capita income and employment rate
in Chicago. To justify the decision farther, the chi-square
distribution tool was utilized. The initial steps of qualitative
nonparametric tests were also demonstrated. From these
analysis, the board of directors need to expand its outdoor
sporting goods. Chicago has a high per capital income and a
high employment rate.
References
Bozeman Science. (2011, November 13). Chi-squared test
[Video file]. Retrieved from
https://www.youtube.com/watch?v=WXPBoFDqNVk
Mertler, C. A., & Reinhart, R. V. (2016). Advanced and
multivariate statistical methods: Practical application and
interpretation. Routledge.
Naghettini, M. (2017). Statistical hypothesis testing. In
Fundamentals of Statistical Hydrology (pp. 251-309). Springer,
Cham.
Big D Market Expansion Research Findings
Presented by:](https://image.slidesharecdn.com/correlationandregressionforecastingisacriticaljobformana-230108063814-b4a2e260/75/Correlation-and-RegressionForecasting-is-a-critical-job-for-mana-docx-21-2048.jpg)


![It is alright for Big D to implement its expansion strategy. The
main reason for this is that all factors appear to be suggesting
that the targeted market offers a favorable situation for the
company. Our evaluation for instance has come to establish that
the rate of employment has been increasing and is expected to
continue increasing in the future. What this means is that the
company will continue to experience a steady increase in the
sale of its products. Expanding into new markets will me the
company experience high sales. This is one of the goals that the
company wants to achieve.
The company will realize high profits as a result of high sales
experienced. What normally happens is that high sales translate
to high revenues. The cost of production is then factored in. The
company will be financially stable as a result of its expansion.
What this means is that the company will be in a better position
of expanding should it wish to expand to other markets. The
main reason for this is that money plays a key role when it
comes expansion. A company that has enough or the required
capital is more likely to expand than that which has low capital.
9
References
American Marketing Association. (n.d.). Summary reports.
Retrieved from http:/www.marketingpower.com/content753.php
Igines. (2012, December 9). How to make a line graph in Excel
(Scientific data) [Video file]. Retrieved from
https://www.youtube.com/watch?v=Xn7Sd5Uu42A](https://image.slidesharecdn.com/correlationandregressionforecastingisacriticaljobformana-230108063814-b4a2e260/75/Correlation-and-RegressionForecasting-is-a-critical-job-for-mana-docx-35-2048.jpg)
![Microsoft. (2018). Create a chart from start to finish. Retrieved
from https://support.office.com/en-us/article/Create-a-chart-
from-start-to-finish-0baf399e-dd61-4e18-8a73-b3fd5d5680c2
Pak, A. (2013, August 12). Tableau Public - Overview and
Applications [Video file]. Retrieved from
http://youtu.be/PnkMiHocqRw
Tableau. (2018). Tableau public. Retrieved from
http://www.tableausoftware.com/public/](https://image.slidesharecdn.com/correlationandregressionforecastingisacriticaljobformana-230108063814-b4a2e260/75/Correlation-and-RegressionForecasting-is-a-critical-job-for-mana-docx-36-2048.jpg)


![Printed by [email protected] Printing is for personal, p.docx](https://cdn.slidesharecdn.com/ss_thumbnails/printedbyemailprotectedprintingisforpersonalp-221011040236-0b5ef27d-thumbnail.jpg?width=640&height=640&fit=bounds)


