Download to read offline
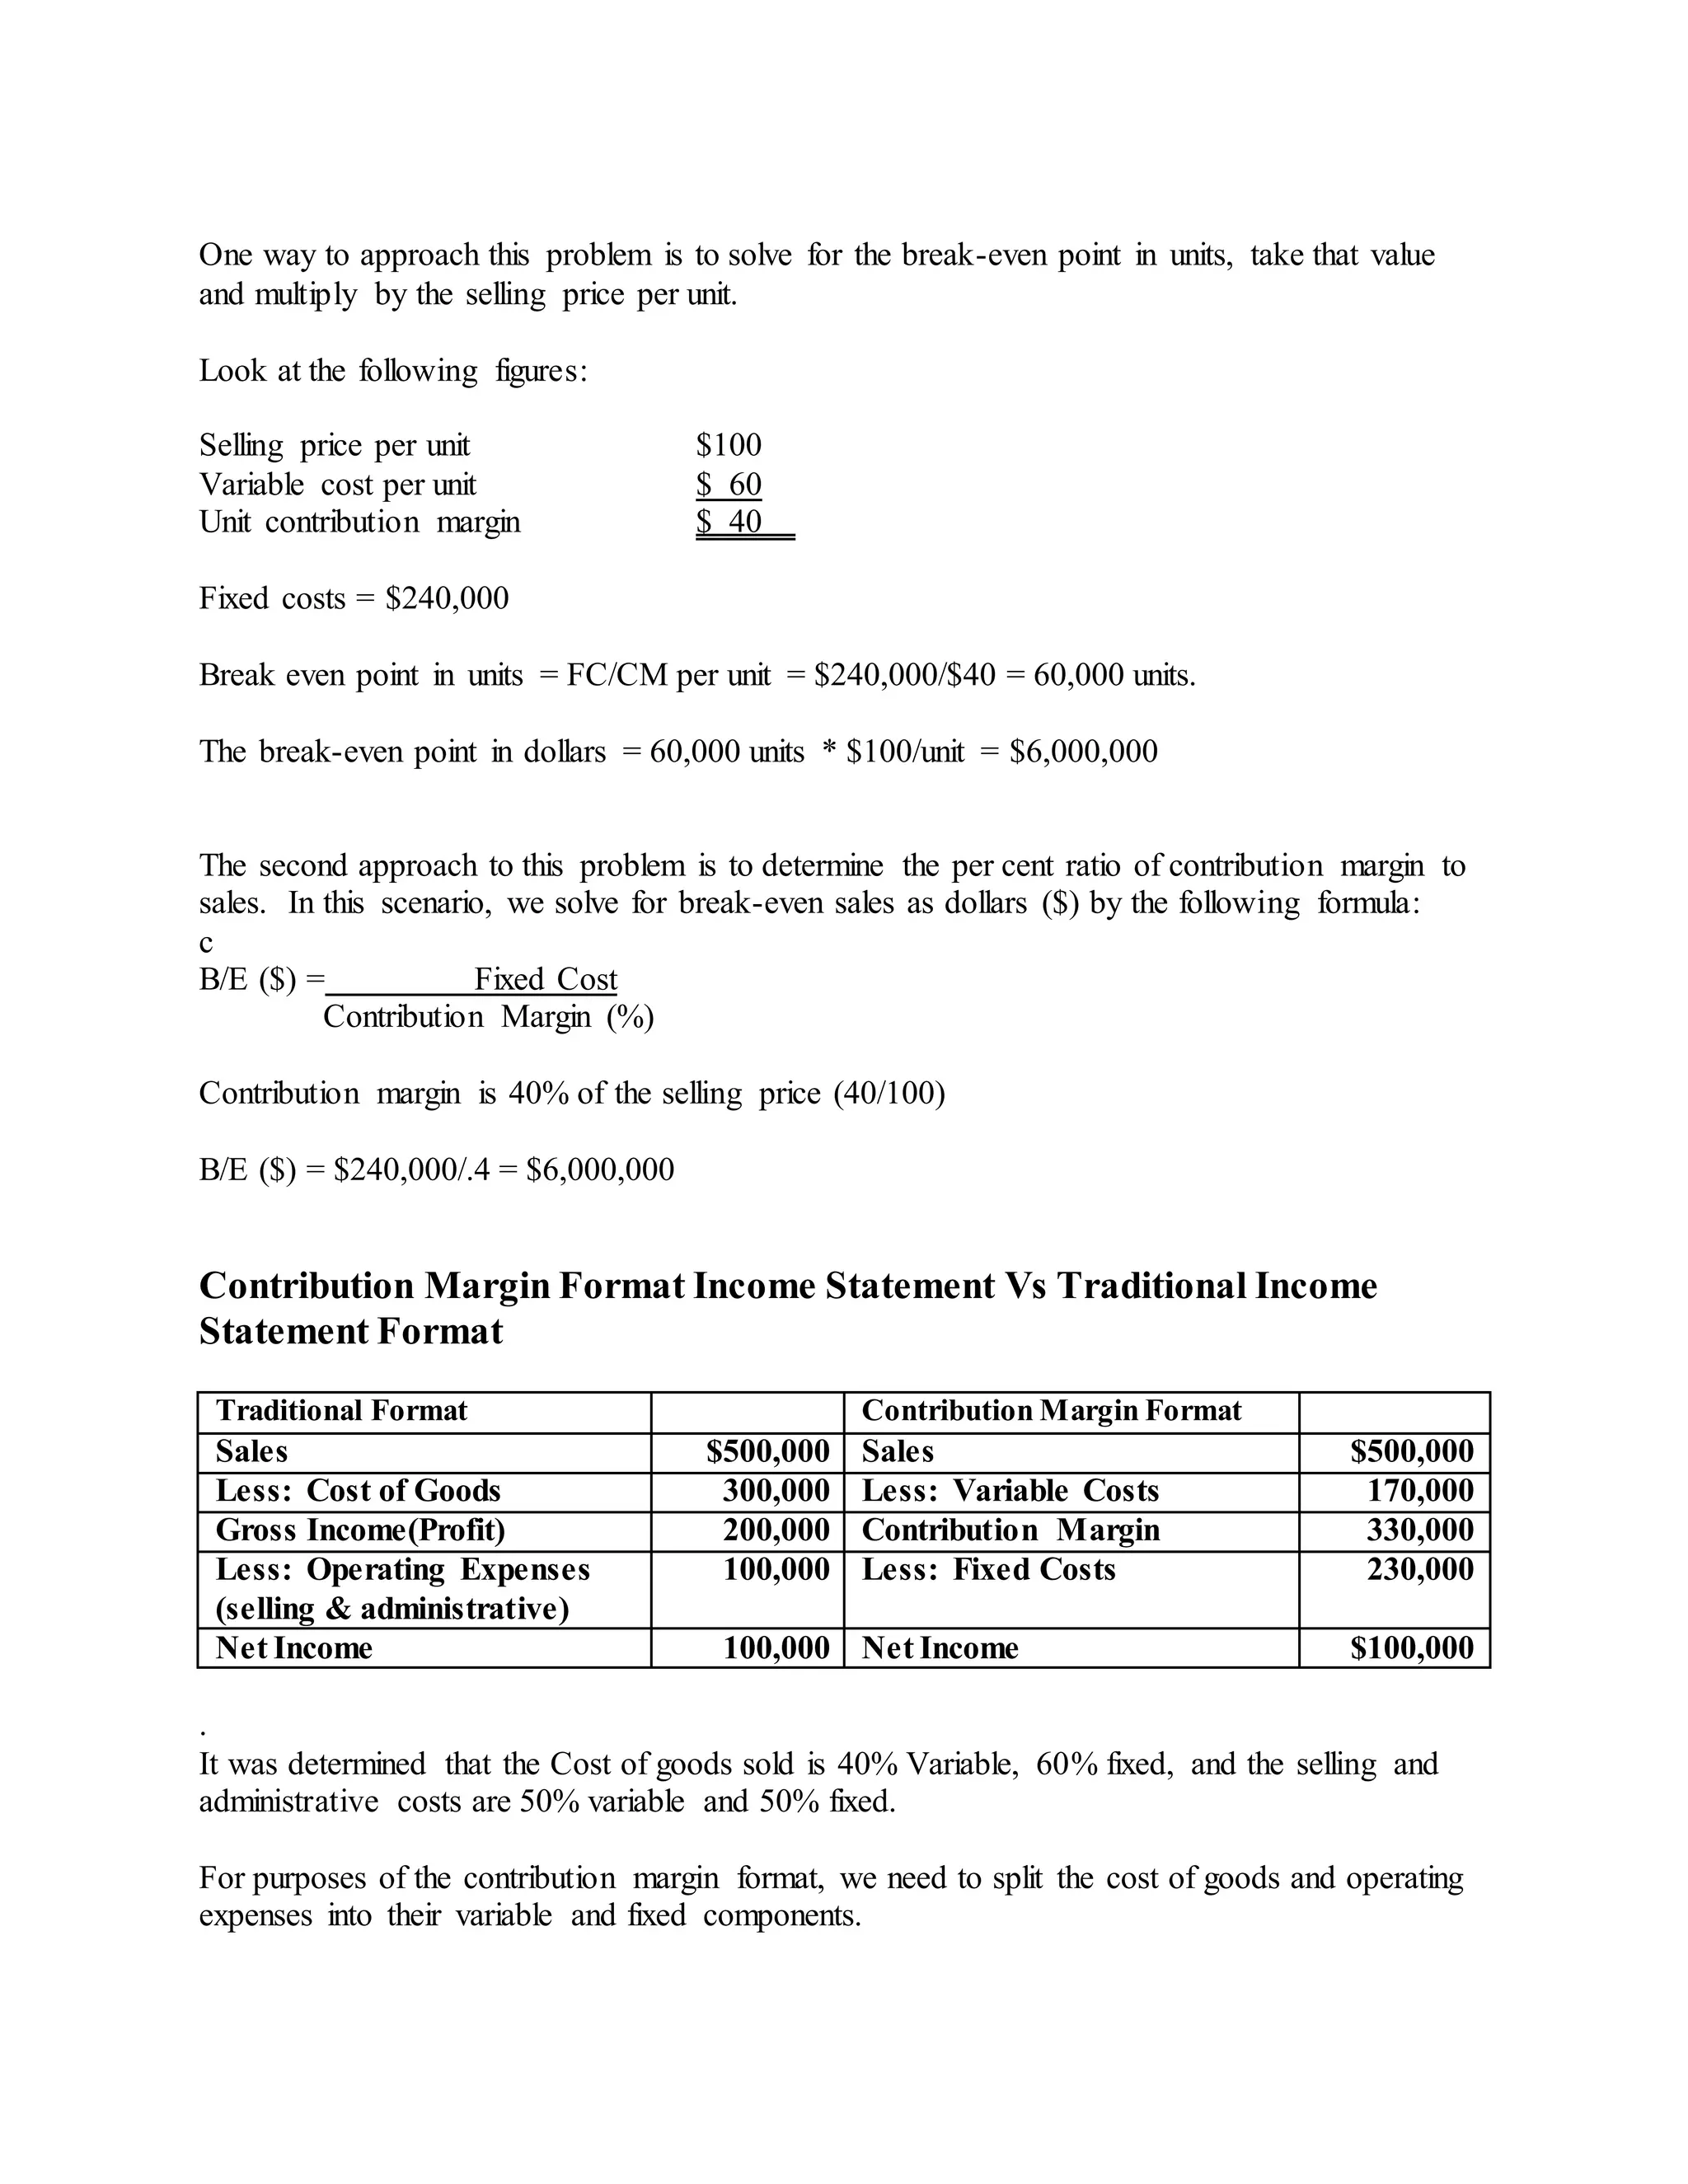
![Consider the following: The Bishop Company is evaluating a proposal to budget an additional
$100,000 for advertising. Fixed costs before the additional advertising are estimated at
$600,000, and the unit contribution margin is $20.
Before any additional expense is incurred, the break-even point is $600,000/$20 = 30,000 units
[ that’s fixed cost/unit contribution margin]
If the additional advertising cost is incurred, the fixed cost will now become $700,000 ; all other
relationships and figures will remain the same, and the break-even point will now become
$700,000/20 = 35,000 units.
Effectof Change in Unit Variable Costs
Unit variable costs are not affected by changes in volume of activity, but they may be affected by
other factors such as changes in the price of direct materials and/or changes in the wages of
factory workers providing direct labour. Increases in unit variable costs will raise the break-even
point whereas decreases in unit variable costs will lower the break-even point.
Consider the following: Park company is evaluating a proposal to pay an additional 2%
commission on sales to salespeople as an incentive to increase sales. Fixed costs are estimated at
$840,000, and the unit selling price, variable cost and unit contribution margin before the
additional 2% commission are as follows.
Unit selling price $250
Unit variable cost 145
Unit Contribution margin $105
The break even point in units is currently FC/unit CM or $840,000/$105 = 8000 units.
The addition of a 2% commission will add 2% of $250 = $5 per unit variable cost.
With this revision, SP= $250, variable cost (VC) = $145 + $5 = $150, and the contribution
margin drops to $100 per unit.
This increase in VC will cause the break-even point in units to increase.
FC/unit CM = $840,000/$100 = 8400 units are required to break even.
Effectof Changes in the Unit Selling Price
Increases in the unit selling price will lower the break-even point, while decreases in the unit
selling price will raise the break-even point.](https://image.slidesharecdn.com/breakeven-190819122807/75/Break-Even-Analysis-2-2048.jpg)


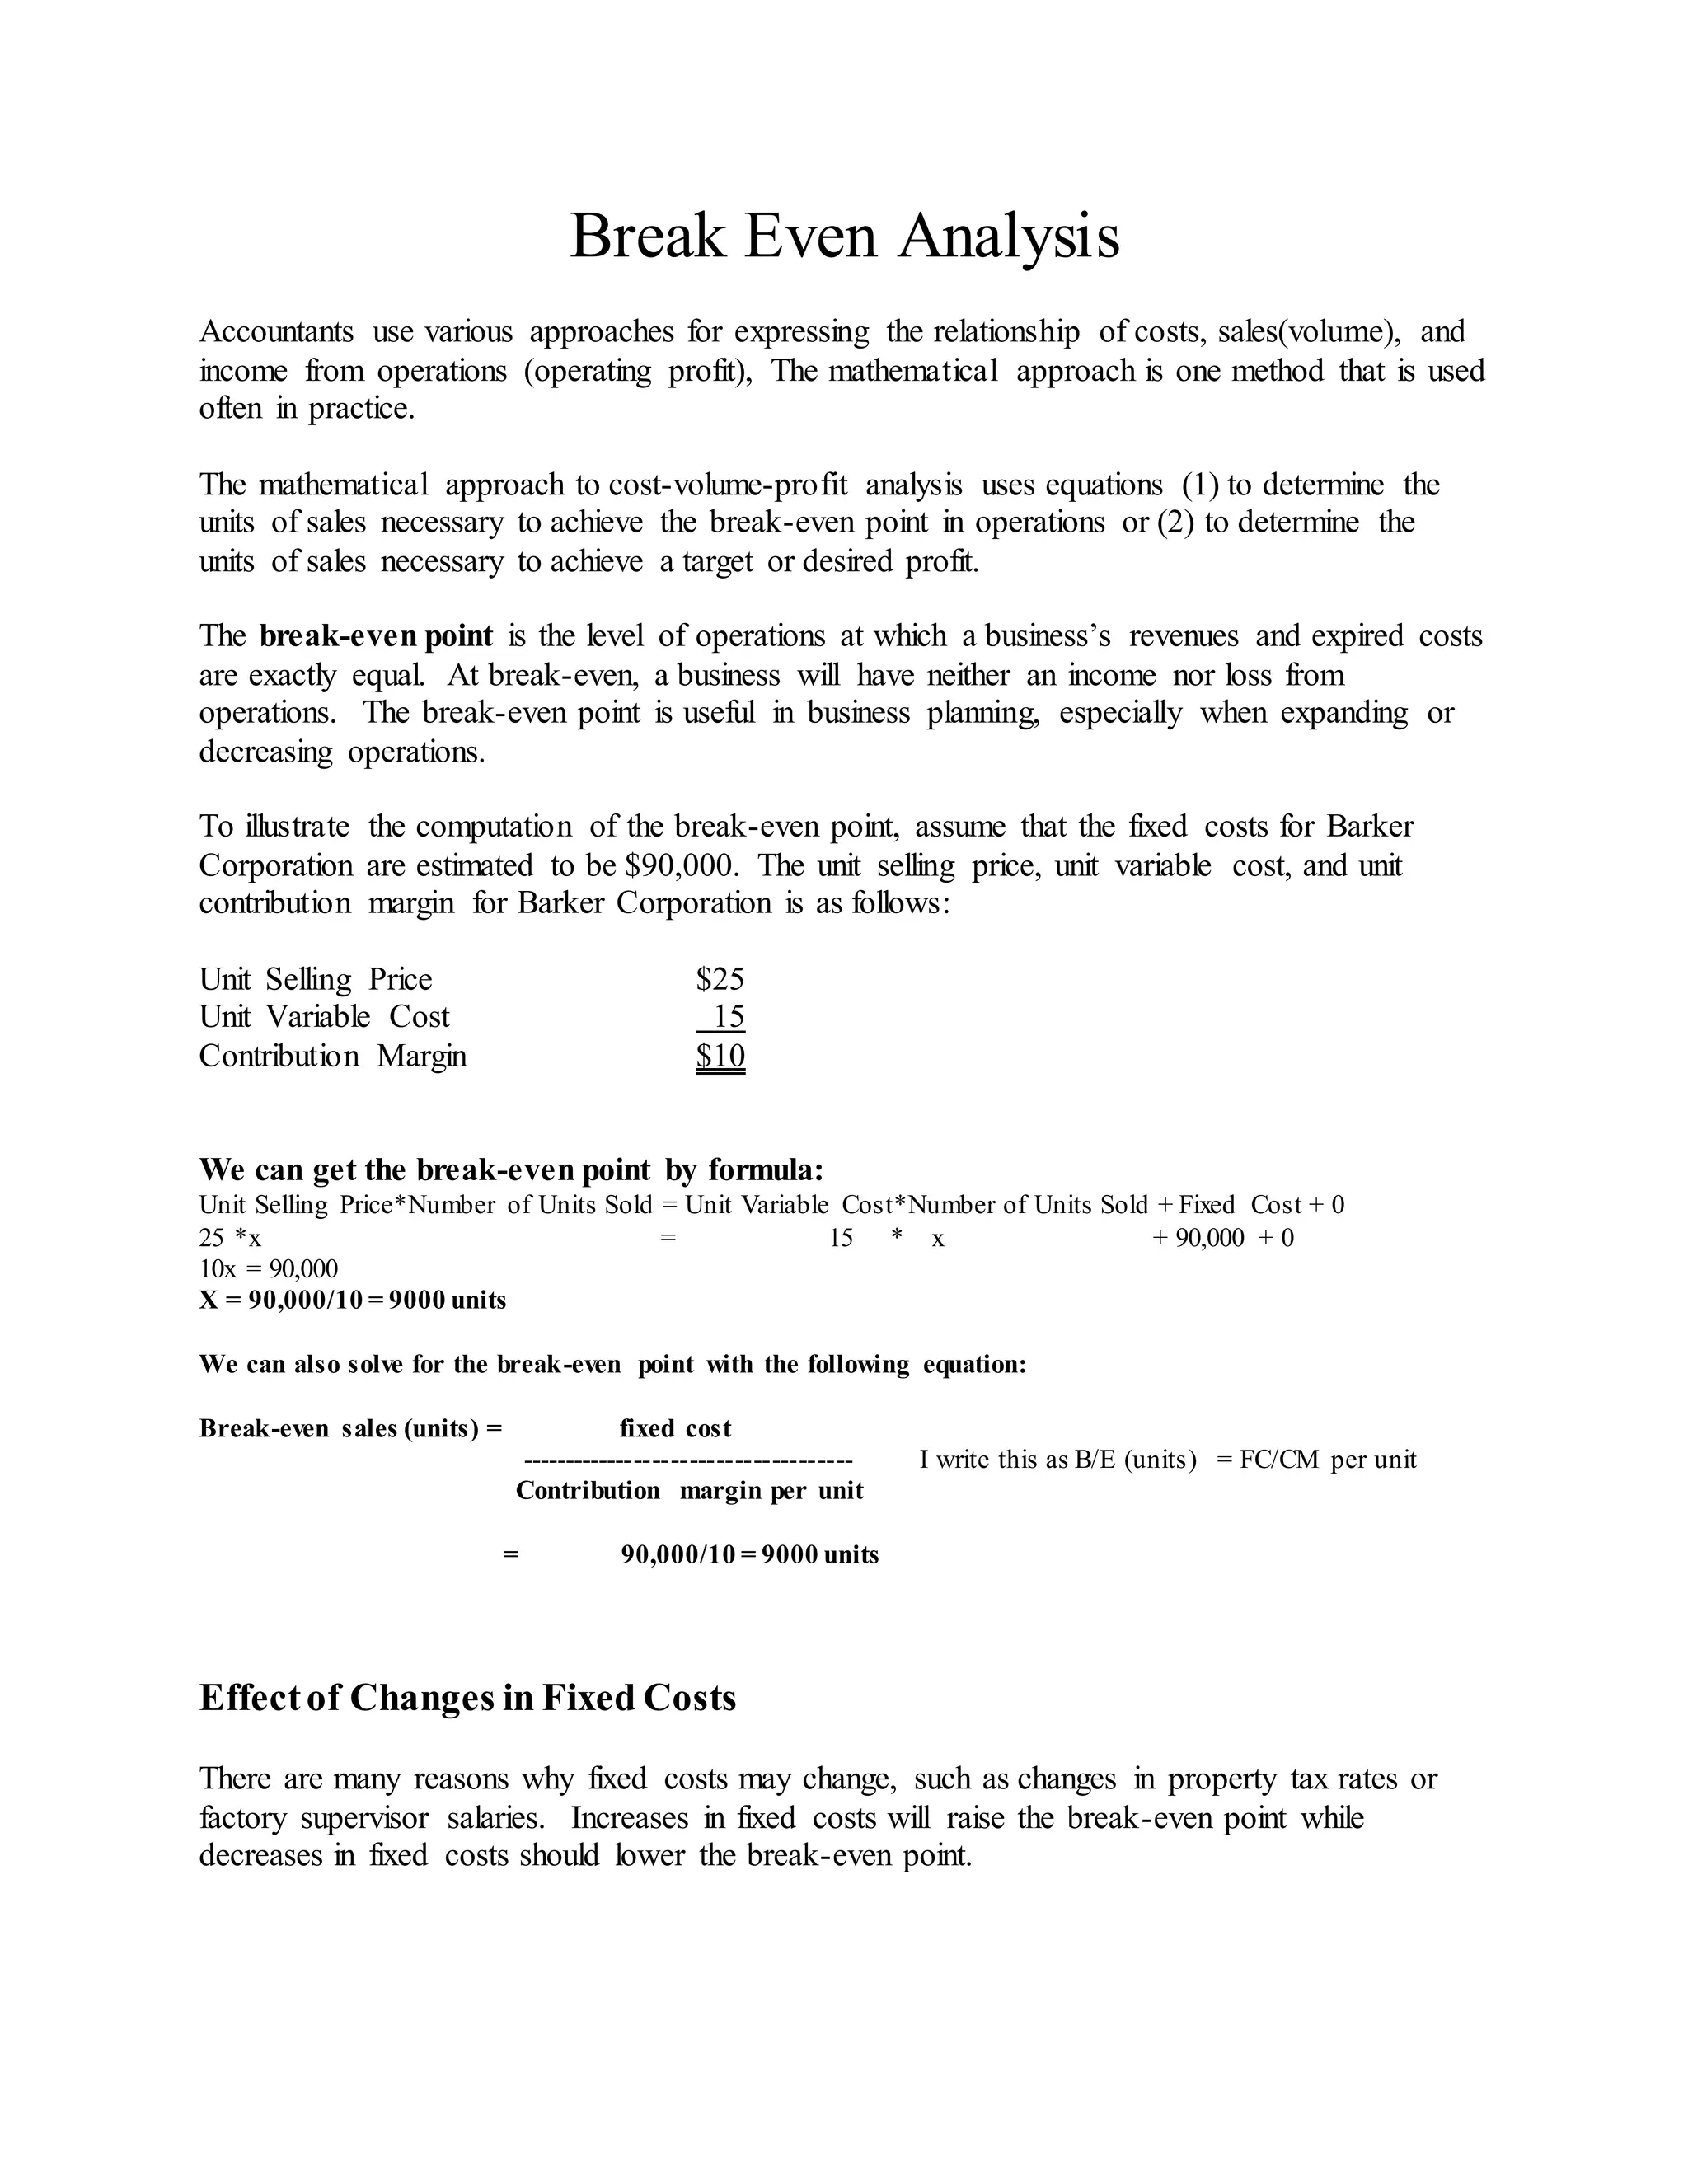
This document discusses break-even analysis, which accountants use to determine the sales volume needed for a business to break even or make a target profit. It defines break-even point as the sales level where revenue equals total costs. The document presents examples of how changes in factors like fixed costs, variable costs, or selling price impact the break-even point in units or dollars. It also explains how a target profit can be used to estimate the required sales volume.


