The document provides an introduction to cost of capital, which includes the cost of debt, cost of equity, and weighted average cost of capital (WACC). It discusses how to calculate the cost of debt, cost of equity using the capital asset pricing model, and WACC. It also explains different models to value equity such as the dividend discount model and two-stage growth model.
Importance of wacc and npv on investment decisionsCharm Rammandala
The purpose of this article is to understand the importance of Weighted Average Cost of Capital and Net Present Value have on the investment decisions. It is vital to ensure all the investment decisions are done after looking at the viability of the investment opportunity and whether it is increasing the shareholder value by exceeding the opportunity cost. This study will primarily look in to the role played by WACC and NPV on the investment decisions.
All related information about Cost of capital and investment theory for instance, weighted average cost of capital (WACC), cost of debt, cost of equity, investment theories and so on.
capital structure
,
goals and significance of capital structure
,
target capital structure
,
does capital structure matter
,
modigliani and miller theory
capital structure
,
goals and significance of capital structure
,
target capital structure
,
does capital structure matter
,
modigliani and miller theory
This is very informative and useful slide for people. They have collected very huge information about history of soccer. More detail visit it. www.aztecasoccer.com
Mercer Capital | Valuation Insight | Capital Structure in 30 MinutesMercer Capital
Capital structure decisions have long-term consequences for shareholders. Directors evaluate capital structure with an eye toward identifying the financing mix that minimizes the weighted average cost of capital. This decision is complicated by the iterative nature of capital costs: the financing mix influences the cost of the different financing sources. While the nominal cost of debt is always less than the nominal cost of equity, the relevant consideration for directors is the marginal cost of debt and equity, which measures the impact of a given financing decision on the overall cost of capital. The purpose of this whitepaper is to equip directors and shareholders to contribute to capital structure decisions that promote the financial health and sustainability of the company.
Chapter 4 focuses on describing how to estimate and calculate Weighted Average Cost of Capital, answering the following questions:
How is the WACC calculated?
What is the Cost of Debt, Cost of Equity and Beta?
What is the Market Risk Premium and Country Risk Premium?
What is the periodicity of WACC calculation?
Affordable Stationery Printing Services in Jaipur | Navpack n PrintNavpack & Print
Looking for professional printing services in Jaipur? Navpack n Print offers high-quality and affordable stationery printing for all your business needs. Stand out with custom stationery designs and fast turnaround times. Contact us today for a quote!
Improving profitability for small businessBen Wann
In this comprehensive presentation, we will explore strategies and practical tips for enhancing profitability in small businesses. Tailored to meet the unique challenges faced by small enterprises, this session covers various aspects that directly impact the bottom line. Attendees will learn how to optimize operational efficiency, manage expenses, and increase revenue through innovative marketing and customer engagement techniques.
What are the main advantages of using HR recruiter services.pdfHumanResourceDimensi1
HR recruiter services offer top talents to companies according to their specific needs. They handle all recruitment tasks from job posting to onboarding and help companies concentrate on their business growth. With their expertise and years of experience, they streamline the hiring process and save time and resources for the company.
Falcon stands out as a top-tier P2P Invoice Discounting platform in India, bridging esteemed blue-chip companies and eager investors. Our goal is to transform the investment landscape in India by establishing a comprehensive destination for borrowers and investors with diverse profiles and needs, all while minimizing risk. What sets Falcon apart is the elimination of intermediaries such as commercial banks and depository institutions, allowing investors to enjoy higher yields.
"𝑩𝑬𝑮𝑼𝑵 𝑾𝑰𝑻𝑯 𝑻𝑱 𝑰𝑺 𝑯𝑨𝑳𝑭 𝑫𝑶𝑵𝑬"
𝐓𝐉 𝐂𝐨𝐦𝐬 (𝐓𝐉 𝐂𝐨𝐦𝐦𝐮𝐧𝐢𝐜𝐚𝐭𝐢𝐨𝐧𝐬) is a professional event agency that includes experts in the event-organizing market in Vietnam, Korea, and ASEAN countries. We provide unlimited types of events from Music concerts, Fan meetings, and Culture festivals to Corporate events, Internal company events, Golf tournaments, MICE events, and Exhibitions.
𝐓𝐉 𝐂𝐨𝐦𝐬 provides unlimited package services including such as Event organizing, Event planning, Event production, Manpower, PR marketing, Design 2D/3D, VIP protocols, Interpreter agency, etc.
Sports events - Golf competitions/billiards competitions/company sports events: dynamic and challenging
⭐ 𝐅𝐞𝐚𝐭𝐮𝐫𝐞𝐝 𝐩𝐫𝐨𝐣𝐞𝐜𝐭𝐬:
➢ 2024 BAEKHYUN [Lonsdaleite] IN HO CHI MINH
➢ SUPER JUNIOR-L.S.S. THE SHOW : Th3ee Guys in HO CHI MINH
➢FreenBecky 1st Fan Meeting in Vietnam
➢CHILDREN ART EXHIBITION 2024: BEYOND BARRIERS
➢ WOW K-Music Festival 2023
➢ Winner [CROSS] Tour in HCM
➢ Super Show 9 in HCM with Super Junior
➢ HCMC - Gyeongsangbuk-do Culture and Tourism Festival
➢ Korean Vietnam Partnership - Fair with LG
➢ Korean President visits Samsung Electronics R&D Center
➢ Vietnam Food Expo with Lotte Wellfood
"𝐄𝐯𝐞𝐫𝐲 𝐞𝐯𝐞𝐧𝐭 𝐢𝐬 𝐚 𝐬𝐭𝐨𝐫𝐲, 𝐚 𝐬𝐩𝐞𝐜𝐢𝐚𝐥 𝐣𝐨𝐮𝐫𝐧𝐞𝐲. 𝐖𝐞 𝐚𝐥𝐰𝐚𝐲𝐬 𝐛𝐞𝐥𝐢𝐞𝐯𝐞 𝐭𝐡𝐚𝐭 𝐬𝐡𝐨𝐫𝐭𝐥𝐲 𝐲𝐨𝐮 𝐰𝐢𝐥𝐥 𝐛𝐞 𝐚 𝐩𝐚𝐫𝐭 𝐨𝐟 𝐨𝐮𝐫 𝐬𝐭𝐨𝐫𝐢𝐞𝐬."
VAT Registration Outlined In UAE: Benefits and Requirementsuae taxgpt
Vat Registration is a legal obligation for businesses meeting the threshold requirement, helping companies avoid fines and ramifications. Contact now!
https://viralsocialtrends.com/vat-registration-outlined-in-uae/
3.0 Project 2_ Developing My Brand Identity Kit.pptxtanyjahb
A personal brand exploration presentation summarizes an individual's unique qualities and goals, covering strengths, values, passions, and target audience. It helps individuals understand what makes them stand out, their desired image, and how they aim to achieve it.
The world of search engine optimization (SEO) is buzzing with discussions after Google confirmed that around 2,500 leaked internal documents related to its Search feature are indeed authentic. The revelation has sparked significant concerns within the SEO community. The leaked documents were initially reported by SEO experts Rand Fishkin and Mike King, igniting widespread analysis and discourse. For More Info:- https://news.arihantwebtech.com/search-disrupted-googles-leaked-documents-rock-the-seo-world/
Discover the innovative and creative projects that highlight my journey throu...dylandmeas
Discover the innovative and creative projects that highlight my journey through Full Sail University. Below, you’ll find a collection of my work showcasing my skills and expertise in digital marketing, event planning, and media production.
Putting the SPARK into Virtual Training.pptxCynthia Clay
This 60-minute webinar, sponsored by Adobe, was delivered for the Training Mag Network. It explored the five elements of SPARK: Storytelling, Purpose, Action, Relationships, and Kudos. Knowing how to tell a well-structured story is key to building long-term memory. Stating a clear purpose that doesn't take away from the discovery learning process is critical. Ensuring that people move from theory to practical application is imperative. Creating strong social learning is the key to commitment and engagement. Validating and affirming participants' comments is the way to create a positive learning environment.
Attending a job Interview for B1 and B2 Englsih learnersErika906060
It is a sample of an interview for a business english class for pre-intermediate and intermediate english students with emphasis on the speking ability.
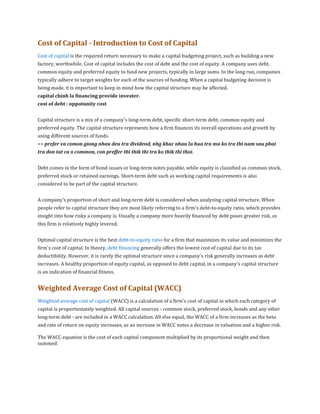
1. Cost of Capital - Introduction to Cost of Capital
Cost of capital is the required return necessary to make a capital budgeting project, such as building a new
factory, worthwhile. Cost of capital includes the cost of debt and the cost of equity. A company uses debt,
common equity and preferred equity to fund new projects, typically in large sums. In the long run, companies
typically adhere to target weights for each of the sources of funding. When a capital budgeting decision is
being made, it is important to keep in mind how the capital structure may be affected.
capital chinh la financing provide invester.
cost of debt : oppotunity cost
Capital structure is a mix of a company's long-term debt, specific short-term debt, common equity and
preferred equity. The capital structure represents how a firm finances its overall operations and growth by
using different sources of funds.
=> prefer va comon giong nhau deu tra dividend, nhg khac nhau la hua tra ma ko tra thi nam sau phai
tra don tat ca o common, con preffer thi thik thi tra ko thik thi thoi.
Debt comes in the form of bond issues or long-term notes payable, while equity is classified as common stock,
preferred stock or retained earnings. Short-term debt such as working capital requirements is also
considered to be part of the capital structure.
A company's proportion of short and long-term debt is considered when analyzing capital structure. When
people refer to capital structure they are most likely referring to a firm's debt-to-equity ratio, which provides
insight into how risky a company is. Usually a company more heavily financed by debt poses greater risk, as
this firm is relatively highly levered.
Optimal capital structure is the best debt-to-equity ratio for a firm that maximizes its value and minimizes the
firm's cost of capital. In theory, debt financing generally offers the lowest cost of capital due to its tax
deductibility. However, it is rarely the optimal structure since a company's risk generally increases as debt
increases. A healthy proportion of equity capital, as opposed to debt capital, in a company's capital structure
is an indication of financial fitness.
Weighted Average Cost of Capital (WACC)
Weighted average cost of capital (WACC) is a calculation of a firm's cost of capital in which each category of
capital is proportionately weighted. All capital sources - common stock, preferred stock, bonds and any other
long-term debt - are included in a WACC calculation. All else equal, the WACC of a firm increases as the beta
and rate of return on equity increases, as an increase in WACC notes a decrease in valuation and a higher risk.
The WACC equation is the cost of each capital component multiplied by its proportional weight and then
summed:
2. Where:
Re = cost of equity
Rd = cost of debt
E = market value of the firm's equity
D = market value of the firm's debt
V=E+D
E/V = percentage of financing that is equity
D/V = percentage of financing that is debt
Tc = corporate tax rate
Broadly speaking, a company's assets are financed by either debt or equity. WACC is the average of the costs
of these sources of financing, each of which is weighted by its respective use in the given situation. By taking a
weighted average, we can see how much interest the company has to pay for every dollar it finances.
A firm's WACC is the overall required return on the firm as a whole and, as such, it is often used internally by
company directors to determine the economic feasibility of expansionary opportunities and mergers. It is the
appropriate discount rate to use for cash flows with risk that is similar to that of the overall firm
Cost of Equity (Re)
The cost of equity is the return that stockholders require for their investment in a company. The traditional
formula for cost of equity (COE) is the dividend capitalization model:
Re = D1(mong doi)/Po + g ( of div-tinh theo 4 phuog phap)
thông thường g tính theo cách g = ROI x RR
A firm's cost of equity represents the compensation that the market demands in exchange for owning the
asset and bearing the risk of ownership
Here's a very simple example: let's say you require a rate of return of 10% on an investment in TSJ Sports.
The stock is currently trading at $10 and will pay a dividend of $0.30. Through a combination of dividends
and share appreciation you require a $1.00 return on your $10.00 investment. Therefore the stock will have
to appreciate by $0.70, which, combined with the $0.30 from dividends, gives you your 10% cost of equity.
3. Calculating the Cost of Equity
The cost of equity can be a bit tricky to calculate as share capital carries no "explicit" cost. Unlike debt, which
the company must pay in the form of predetermined interest, equity does not have a concrete price that the
company must pay, but that doesn't mean no cost of equity exists.
Common shareholders expect to obtain a certain return on their equity investment in a company. The equity
holders' required rate of return is a cost from the company's perspective because if the company does not
deliver this expected return, shareholders will simply sell their shares, causing the price to drop. The cost of
equity is basically what it costs the company to maintain a share price that is theoretically satisfactory to
investors.
On this basis, the most commonly accepted method for calculating cost of equity comes from the Nobel Prizewinning capital asset pricing model (CAPM): The cost of equity is expressed formulaically below:
Re = rf + (rm – rf) * β
Where:
Re = the required rate of return on equity
rf = the risk free rate
rm – rf = the market risk premium
β = beta coefficient = unsystematic risk
But what does this mean?
Rf – Risk-free rate - This is the amount obtained from investing in securities considered free from
credit risk, such as government bonds from developed countries. The interest rate of U.S. Treasury
Bills is frequently used as a proxy for the risk-free rate.
ß – Beta - This measures how much a company's share price reacts against the market as a whole. A
beta of one, for instance, indicates that the company moves in line with the market. If the beta is in
excess of one, the share is exaggerating the market's movements; less than one means the share is
more stable. Occasionally, a company may have a negative beta (e.g. a gold-mining company), which
means the share price moves in the opposite direction to the broader market. (Learn more inBeta:
Know The Risk.)
For public companies, you can find database services that publish betas. Few services do a better job
of estimating betas than BARRA. While you might not be able to afford to subscribe to the beta
estimation service, this site describes the process by which they come up with "fundamental" betas.
Bloomberg and Ibbotson are other valuable sources of industry betas.
(Rm – Rf) = Equity Market Risk Premium (EMRP) - The equity market risk premium (EMRP)
represents the returns investors expect to compensate them for taking extra risk by investing in the
stock market over and above the risk-free rate. In other words, it is the difference between the riskfree rate and the market rate. It is a highly contentious figure. Many commentators argue that it has
gone up due to the notion at holding shares has become more risky.
Rf: trái phiế u cp lấ y 20 năm.
4. Rm: 8%-9% ( hiệ n nay of việ t nam), Rm thông thường nằ m 10-12%
The EMRP frequently cited is based on the historical average annual excess return obtained from
investing in the stock market above the risk-free rate. The average may either be calculated using an
arithmetic mean or a geometric mean. The geometric mean provides an annually compounded rate of
excess return and will in most cases be lower than the arithmetic mean. Both methods are popular,
but the arithmetic average has gained widespread acceptance.
Once the cost of equity is calculated, adjustments can be made to take account of risk factors specific to the
company, which may increase or decrease a company's risk profile. Such factors include the size of the
company, pending lawsuits, concentration of customer base and dependence on key employees. Adjustments
are entirely a matter of investor judgment, and they vary from company to company.
Weighted Average Cost of Equity
Weighted average cost of equity (WACE) is a way to calculate the cost of a company's equity that gives
different weight to different aspects of the equities. Instead of lumping retained earnings, common stock and
preferred stock together, WACE provides a more accurate idea of a company's total cost of equity.
Here is an example of how to calculate WACE:
First, calculate the cost of new common stock, the cost of preferred stock and the cost of retained. Let's
assume we have already done this and the cost of common stock, preferred stock and retained earnings are
24%, 10% and 20% respectively.
Now, calculate the portion of total equity that is occupied by each form of equity. Again, let's assume this is
50%, 25% and 25%, for common stock, preferred stock and retained earnings, respectively.
Finally, multiply the cost of each form of equity by its respective portion of total equity, and sum of the values
to get WACE. Our example results in a WACE of 19.5%.
WACE = (.24*.50) + (.10*.25) + (.20*.25) = 0.195 or 19.5%
Determining an accurate cost of equity for a firm is integral in order to be able to calculate the firm's cost of
capital. In turn, an accurate measure of the cost of capital is essential when a firm is trying to decide if a future
project will be profitable or not
Cost of Debt and Preferred Stock
5. Recall from Section 5 that companies sometimes finance their operations through debt in the form of bonds
because bonds provide more flexible borrowing terms than banks. How much do companies pay for this
debt?
Compared to cost of equity, cost of debt is fairly straightforward to calculate. The rate applied to determine
the cost of debt (Rd) should be the current market rate the company is paying on its debt. If the company is
not paying market rates, an appropriate market rate payable by the company should be estimated.
Calculating the Cost of Debt
Because companies benefit from the tax deductions available on interest paid, the net cost of the debt is
actually the interest paid less the tax savings resulting from the tax-deductible interest payment.
The after-tax cost of debt can be calculated as follows:
After-tax cost of debt = Rd (1-tc)
Example: Cost of Debt
Newco plans to issue debt at a 7% interest rate. Newco's total (both federal and state) tax rate is 40%. What is
Newco's cost of debt?
tính 7%: g.sử có khoả n nợ 500tr, vd 10 năm, dừa vào bond r ước lượng,dựa vào đặ c tính of c.ty và thị trg`
discount rate càng lớn thì dòng tiề n sẽ nhỏ lạ i, giá trị c.ty sẽ nhỏ lạ i
value of c.ty = E + D
Answer:
Rd (1-tc) = 7% (1-0.40) = 4.2%
example: st debt = 200000
interest rate = 9%
tax rate = 30%
=> cost of debt = 9%x( 1-30%) = 6.3%
Calculating the Cost of Preferred Stock
As we discussed in section 6 of this walkthrough, preferred stocks straddle the line between stocks and
bonds. Technically, they are equity securities, but they share many characteristics with debt instruments.
Preferred are issued with a fixed par value and pay dividends based on a percentage of that par at a fixed rate.
Cost of preferred stock (Rps) can be calculated as follows:
Rps = Dps/Pnet
where:
Dps = preferred dividends
6. Pnet = net issuing price
Example: Cost of Preferred Stock
Assume Newco's preferred stock pays a dividend of $2 per share and sells for $100 per share. If the cost to
Newco to issue new shares is 4%, what is Newco's cost of preferred stock?
Answer:
Rps = Dps/Pnet = $2/$100(1-0.04) = 2.1%
(Source: A Complete Guide to Corporate Finance, Chapter Five: Introduction to Cost of Capital,
Investopia.com)
*NOTE
share price = D1/( 1+re)1 + D2/( 1+re)2 +....+ Dn/ ( 1+ re)n
re : chinh là cost of equity- dividend in equity , nó ko thể là cost of debt or wacc,
còn D là FCFF( free cash flow to firm)
- ĐỂ discount dividend, thì phả i xem cty phát triể n ntn, nế u đang phát
triển cao thì div thường thấ p or ko trả bởi vì để tái đầ u tư năm sau, nên
khi tính thì phải giả đị nh
7. Dividend Discount Model
By John Del Vecchio (TMF Fuz)
April 6, 2000
The dividend discount model can be a worthwhile tool for equity valuation. Financial theory states that the
value of a stock is the worth all of the future cash flows expected to be generated by the firm discounted by an
appropriate risk-adjusted rate. We can use dividends as a measure of the cash flows returned to the
shareholder.
There are several dividend discount models (DDMs), and this article will address two of the more basic forms
of the DDM -- the stable model and the two-stage model. As an illustration, both models will be used to value
the stock of Caterpillar (NYSE: CAT).
Inputs Into the DDM
Several inputs are required to estimate the value of an equity using the DDM.
* DPS(1) = Dividends expected to be received in one year.
* Ks = The required rate of return for the investment. The required rate of return can be estimated using the
following formula: Risk-free rate + (Market risk premium) * Beta
The rate on t-bills can be used to determine the risk-free rate. The market risk premium is the expected
return of the market in excess of the risk-free rate. Beta can be thought of as the sensitivity of the stock
compared with the market.
*
g = Growth rate in dividends
Stable Model
Value of stock = DPS(1) / Ks-g
Caveats: The stable model is best suited for firms experiencing long-term stable growth. Generally, stable
firms are assumed to grow at the rate equal to the long-term nominal growth rate of the economy (inflation
plus real growth in GDP). In other words, the model assumes it is impossible to grow at 30% forever,
otherwise, the company would be larger than the economy.
If the growth rate of the firm exceeded the required rate of return, you could not calculate the value of the
stock. This is because if g>Ks, the result would be negative, and stocks do not have a negative value.
Another caveat is that models are often very sensitive to the assumptions made regarding growth rates, time
frame, or the required rate of return.
8. Finally, the dividend discount model generally understates the intrinsic value of the firm. Important
considerations such as the value of patents, brand name, and other intangible assets should be used in
conjunction with the DDM to assess the value of a firm's equity. These intangibles should be added to the
result of a DDM calculation to arrive at a more appropriate valuation.
An Example:
DPS = Caterpillar has a dividend of $1.30
Ks = 6% + (6.8%) * 1.0 = 12.8% (we use a Beta of 1 because it should be the same as the market during the
stable growth period)
g = because the stable model assumes a growth rate equal to the long-term nominal growth of the economy,
we will use a growth rate of 6% (3% inflation + 3% GDP growth).
V = 1.30 * (1.06) / (.1280-.06)
V = $20.26
Caterpillar's recent price of $38.63 per share shows that the dividend discount model suggests that
Caterpillar is overvalued. However, Caterpillar for example, has a strong brand name, and customers will pay
a premium price for its products. This is a good example of how the dividend discount model may understate
the intrinsic value of the equity. Adjustments should be made to estimate the value of brand name or other
value-enhancing traits that a company may possess.
The Two-Stage Model
The two-stage model attempts to cross the chasm from theory to reality. The two-stage model assumes that
the company will experience a period of high-growth followed by a decline to a stable growth period.
Caveats: The first issue to deal with when using the two-stage model is to estimate how long the high growth
period should last. Should it be 5 years, 10 years, or maybe longer?
The next caveat is that the model makes an abrupt transition from high growth to low growth. In other words,
the model assumes that the firm may be growing at 30% for five years only to then grow at 6% (stable
growth) until eternity. Is this realistic? Probably not. Most firms experience a gradual decline in growth rates
as their business matures (hence, using a three-stage dividend discount model may be more appropriate,
yikes!).
Finally, just like the stable growth model, the two-stage dividend discount model is very sensitive to the
inputs used to determine the value of the equity.
An Example:
High-growth phase (assuming five years for illustration purposes):
DPS = $1.30
Ks = 6% + (6.8%) * 0.94 = 12.39%
g = (1 - Payout Ratio) * ROE = .506 * .1781 = 9%
DPS(1) = $1.30 * 1.09 = $1.42
DPS(2) = $1.42 * 1.09 = $1.54
DPS(3) = $1.54 * 1.09 = $1.68
DPS(4) = $1.68 * 1.09 = $1.84
9. DPS(5) = $1.84 * 1.09 = $2.00
Now, we must discount the dividends by the appropriate rate to determine their present value.
$1.42 / (1.1239) = $1.26
$1.54 / (1.1239)2 = $1.22
$1.68 / (1.1239)3 = $1.19
$1.84 / (1.1239)4 = $1.15
$2.00 / (1.1239)5 = $1.12
We add up the present value for the dividends during the high-growth stage and get $5.94.
Next, we value the stable growth period:
DPS = $2.00 (1.06) = $2.12
Ks = 12.8%
g = 6%
$2.12 / (.128-0.06) = $31.18
Next, we must calculate the present value of the dividends.
$31.18 / (1.1239)5 = $17.39
When calculating the present value of the dividends of the stable growth period, we use the same required
rate of return as the high-growth phase and raise it to the fifth power for a five-year example like the one
above.
Adding the two values, we get: $17.39 + $5.94 = $23.33
Again, our result is quite a bit lower than the current market price.
Important Note
Notice that most of the "value" of the equity is derived from the stable growth period (17.39 / 23.33 = 74.5%).
This is an indication that the market views the value of equity from a long-term, not short-term perspective.
What if the Stock Does Not Pay Dividends?
The DDM can still be used to value stocks that do not pay dividends. The analyst must make assumptions
about what the dividend would be if the firm did pay dividends. Starting with free cash flow and estimating
the dividend pay-out ratio based on comparable firms in the marketplace or industry can yield reasonable
results for a non-dividend paying company.
What Is the Usefulness of the DDM?
It depends on how you apply the model. Since the model is highly sensitive to the assumptions made about
growth rates and discount rates, performing a sensitivity analysis would be appropriate. Sensitivity analysis
allows the investor to view how different assumptions change the valuation using the dividend discount
model. Secondly, the dividend discount model is a good starting point to begin thinking about the valuation of
an equity, but it is not the Holy Grail. Intel (Nasdaq: INTC) has a substantial percentage of its value explained
by intangible assets like the brainpower of its employees. Using the DDM may result in ridiculously low
estimates of Intel's value. Finally, the DDM is a good thinking exercise. It forces the investors to begin thinking
about different scenarios in relation to how the market is pricing the stock.
Do Professionals Use the DDM?
10. Yes. For example, Merrill Lynch (NYSE: MER) uses the DDM model as a component of its market-beating
Alpha Surprise Model. JP Morgan (NYSE: JPM)uses the DDM as an important input into the valuation and
stock selection process. However, the DDM is only one of many valuation tools used in equity analysis.
The dividend discount model provides an excellent illustration of the difference between theory and reality.
Plenty of assumptions must be made, the transition phases are often unrealistic, and a firm's intangibles,
often a key driver in the growth rate of the company, are absent from the model. Yet, many analysts still use
the DDM as a gauge for valuation. That's fine, just remember it is a model, after all, so use it carefully.
(Source: Dividend and EPS data from Marketguide.)