SlideShare a Scribd company logo
1 of 8
Download to read offline
Modelling Innovation – CHAPTER 4


     Chapter 4                  The weighted average cost of capital1


    4.1              What is the WACC?


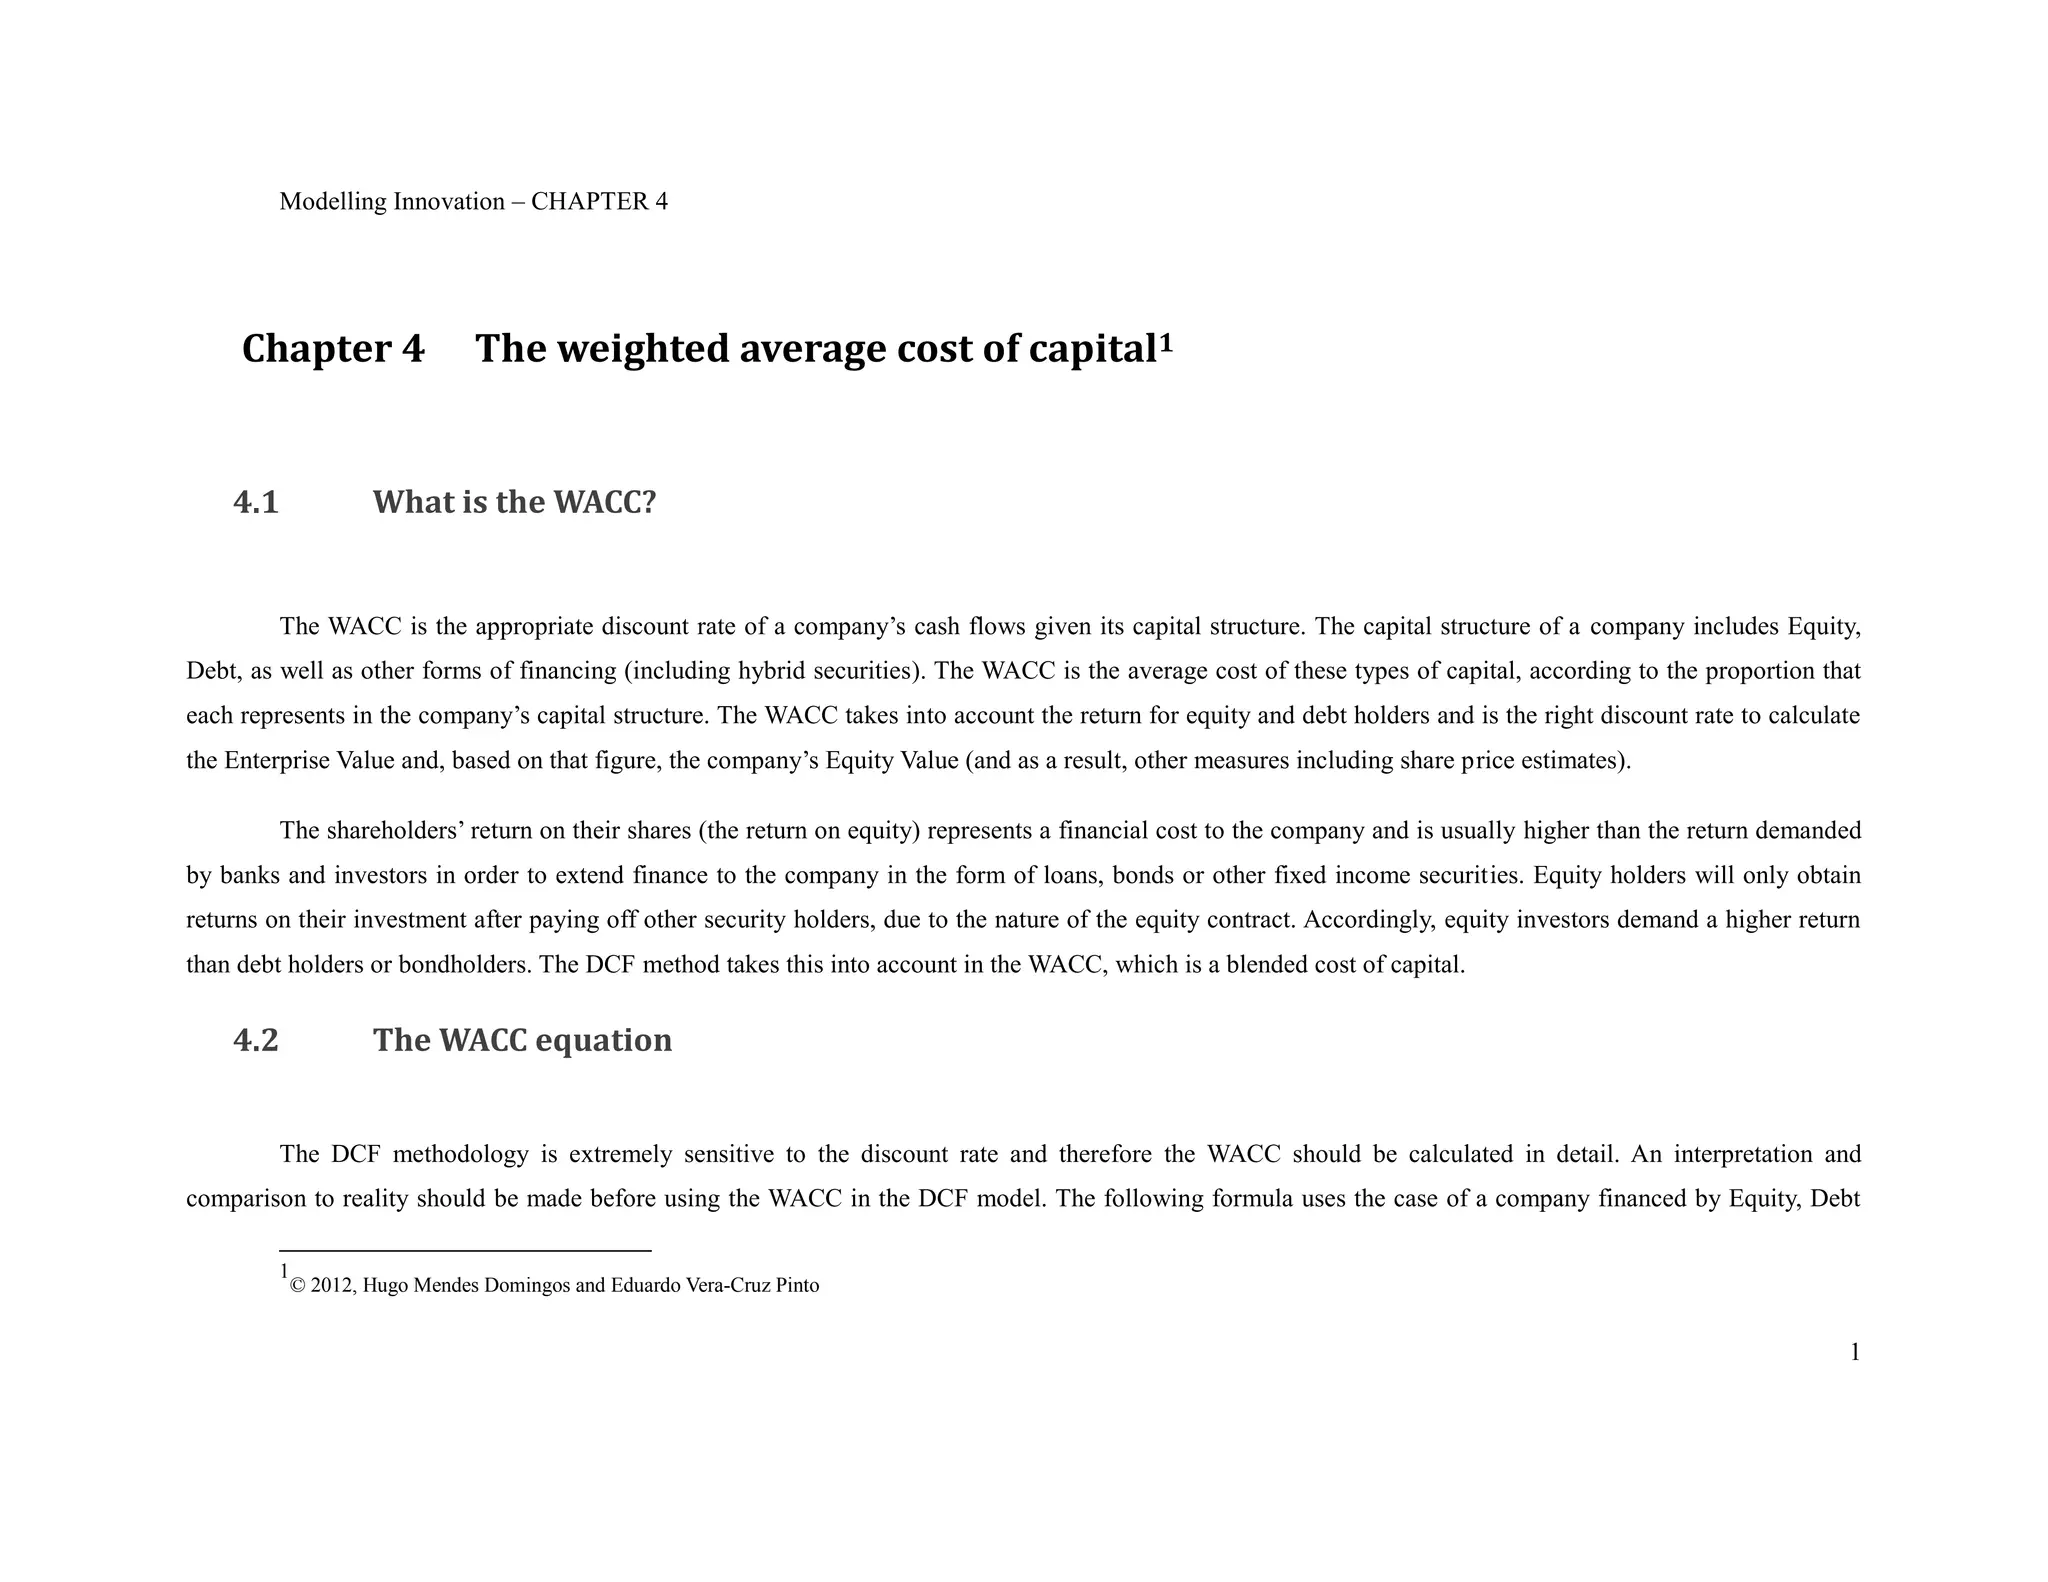
         The WACC is the appropriate discount rate of a company’s cash flows given its capital structure. The capital structure of a company includes Equity,
Debt, as well as other forms of financing (including hybrid securities). The WACC is the average cost of these types of capital, according to the proportion that
each represents in the company’s capital structure. The WACC takes into account the return for equity and debt holders and is the right discount rate to calculate
the Enterprise Value and, based on that figure, the company’s Equity Value (and as a result, other measures including share price estimates).

         The shareholders’ return on their shares (the return on equity) represents a financial cost to the company and is usually higher than the return demanded
by banks and investors in order to extend finance to the company in the form of loans, bonds or other fixed income securities. Equity holders will only obtain
returns on their investment after paying off other security holders, due to the nature of the equity contract. Accordingly, equity investors demand a higher return
than debt holders or bondholders. The DCF method takes this into account in the WACC, which is a blended cost of capital.


    4.2              The WACC equation


         The DCF methodology is extremely sensitive to the discount rate and therefore the WACC should be calculated in detail. An interpretation and
comparison to reality should be made before using the WACC in the DCF model. The following formula uses the case of a company financed by Equity, Debt

         1
             © 2012, Hugo Mendes Domingos and Eduardo Vera-Cruz Pinto


                                                                                                                                                                 1
and Preferred Shares. A variation of the same formula would be used if the analysed company used other forms of capital, such as convertibles or other hybrid
securities.

              Equation 1.           Weighted Average Cost of Capital Formula


         In this formula, the WACC is calculated after tax in the sense that the cost of debt taken into account allows for the tax shield impact of debt financing.
Interest is usually tax deductible, and as a result, a company’s cost of debt should be considered net of the tax savings generated by the fact that the company will
reduce its tax payments to the extent that it uses debt as a form of financing. Preferred Shares are presented in the calculation of the WACC without taxation as it
is a hybrid form of finance (with both debt and equity characteristics) and its coupon may be classified as a dividend and is usually not tax deductible (except in
some countries). For the sake of simplicity, we assume that the interest paid on preferred shares is non tax-deductible.


    4.3           What is the Cost of Debt?


         The cost of debt in valuation models is the annual cost that the company incurs for being financed by debt (assuming that the model itself is annual).
This cost is normally mistaken for the interest rate on bank loans; however there are other debt instruments that dismiss this simplistic view, including bonds,
Modelling Innovation – CHAPTER 4
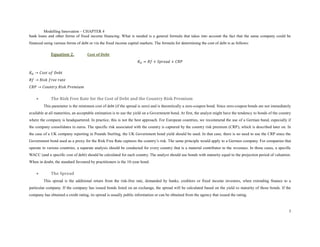
bank loans and other forms of fixed income financing. What is needed is a general formula that takes into account the fact that the same company could be
financed using various forms of debt or via the fixed income capital markets. The formula for determining the cost of debt is as follows:

             Equation 2.            Cost of Debt
                                                                     𝐾 𝐷 = 𝑅𝑓 + 𝑆𝑝𝑟𝑒𝑎𝑑 + 𝐶𝑅𝑃

𝐾 𝐷 → 𝐶𝑜𝑠𝑡 𝑜𝑓 𝐷𝑒𝑏𝑡
𝑅𝑓 → 𝑅𝑖𝑠𝑘 𝑓𝑟𝑒𝑒 𝑟𝑎𝑡𝑒
𝐶𝑅𝑃 → 𝐶𝑜𝑢𝑛𝑡𝑟𝑦 𝑅𝑖𝑠𝑘 𝑃𝑟𝑒𝑚𝑖𝑢𝑚

            The Risk Free Rate for the Cost of Debt and the Country Risk Premium
         This parameter is the minimum cost of debt (if the spread is zero) and is theoretically a zero-coupon bond. Since zero-coupon bonds are not immediately
available at all maturities, an acceptable estimation is to use the yield on a Government bond. At first, the analyst might have the tendency to bonds of the country
where the company is headquartered. In practice, this is not the best approach. For European countries, we recommend the use of a German bund, especially if
the company consolidates in euros. The specific risk associated with the country is captured by the country risk premium (CRP), which is described later on. In
the case of a UK company reporting in Pounds Sterling, the UK Government bond yield should be used. In that case, there is no need to use the CRP since the
Government bond used as a proxy for the Risk Free Rate captures the country’s risk. The same principle would apply to a German company. For companies that
operate in various countries, a separate analysis should be conducted for every country that is a material contributor to the revenues. In those cases, a specific
WACC (and a specific cost of debt) should be calculated for each country. The analyst should use bonds with maturity equal to the projection period of valuation.
When in doubt, the standard favoured by practitioners is the 10-year bond.

            The Spread
         This spread is the additional return from the risk-free rate, demanded by banks, creditors or fixed income investors, when extending finance to a
particular company. If the company has issued bonds listed on an exchange, the spread will be calculated based on the yield to maturity of those bonds. If the
company has obtained a credit rating, its spread is usually public information or can be obtained from the agency that issued the rating.


                                                                                                                                                                   3
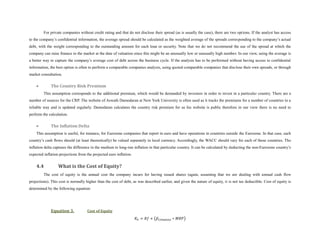
For private companies without credit rating and that do not disclose their spread (as is usually the case), there are two options. If the analyst has access
to the company’s confidential information, the average spread should be calculated as the weighted average of the spreads corresponding to the company’s actual
debt, with the weight corresponding to the outstanding amount for each loan or security. Note that we do not recommend the use of the spread at which the
company can raise finance in the market at the date of valuation since this might be an unusually low or unusually high number. In our view, using the average is
a better way to capture the company’s average cost of debt across the business cycle. If the analysis has to be performed without having access to confidential
information, the best option is often to perform a comparable companies analysis, using quoted comparable companies that disclose their own spreads, or through
market consultation.

            The Country Risk Premium
         This assumption corresponds to the additional premium, which would be demanded by investors in order to invest in a particular country. There are a
number of sources for the CRP. The website of Aswath Damodaran at New York University is often used as it tracks the premiums for a number of countries in a
reliable way and is updated regularly. Damodaran calculates the country risk premium for us his website is public therefore in our view there is no need to
perform the calculation.

            The Inflation Delta
    This assumption is useful, for instance, for Eurozone companies that report in euro and have operations in countries outside the Eurozone. In that case, each
country’s cash flows should (at least theoretically) be valued separately in local currency. Accordingly, the WACC should vary for each of those countries. The
inflation delta captures the difference in the medium to long-run inflation in that particular country. It can be calculated by deducting the non-Eurozone country’s
expected inflation projections from the projected euro inflation.


    4.4           What is the Cost of Equity?
         The cost of equity is the annual cost the company incurs for having issued shares (again, assuming that we are dealing with annual cash flow
projections). This cost is normally higher than the cost of debt, as was described earlier, and given the nature of equity, it is not tax deductible. Cost of equity is
determined by the following equation:


             Equation 3.             Cost of Equity
                                                                    𝐾 𝐸 = 𝑅𝑓 + (𝛽 𝐶𝑜𝑚𝑝𝑎𝑛𝑦 ∗ 𝑀𝑅𝑃)
Modelling Innovation – CHAPTER 4

                                                                𝐾 𝐸 → 𝐶𝑜𝑠𝑡 𝑜𝑓 𝐸𝑞𝑢𝑖𝑡𝑦
                                                                𝑅𝑓 → 𝑅𝑖𝑠𝑘 𝑓𝑟𝑒𝑒 𝑅𝑎𝑡𝑒
                                                                𝛽 𝐶𝑜𝑚𝑝𝑎𝑛𝑦 → 𝐶𝑜𝑚𝑝𝑎𝑛𝑦′𝑠 𝐵𝑒𝑡𝑎


             What is the company’s Beta?
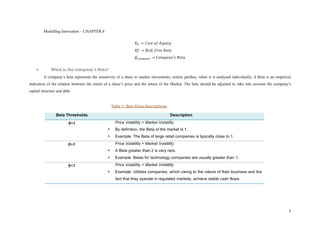
         A company’s beta represents the sensitivity of a share to market movements, ceteris paribus, when it is analysed individually. A Beta is an empirical
indication of the relation between the return of a share’s price and the return of the Market. The beta should be adjusted to take into account the company’s
capital structure and debt.


                                                 Table 1- Beta Value Descriptions


                                                                                                                                                            5
Calculating the Beta


         For most quoted companies, market data providers disclose their own calculation of the company’s Beta. If the company is not listed, the Beta should be
calculated based on a comparable companies analysis. Even for quoted companies, certain adjustments can be made to the company’s Beta which improves the
DCF’s accuracy.

         In the case of a quoted company, the Beta disclosed by market data providers is often called the Levered Beta, as it reflects the company’s capital
structure. This structure may be inadequate, influenced by the economic cycle or different from the company’s target. The adjustment to be made for valuation
purposes is called de-leveraging this Beta and then re-leveraging it. The first step results in an Unlevered Beta, which is a measure of risk for the company’s
assets, debt-free. It is a pure measure of business risk or sector risk. This is why usually companies that exhibit high business risk have low levels of debt and
companies with relative stable business risk have more debt (e.g. utilities). In the second step, the analyst can include an adequate level of debt and re-leverage
the Unlevered Beta, producing a Levered Beta that can be used in determining the WACC.

Example – Astrazeneca’s Beta
         AstraZeneca is a pharmaceutical company based in the UK with a primary listing on the London Stock Exchange. To calculate its Beta, a database of
prices from AstraZeneca’s share (AZN.L) was composed with a horizon of 12 years. Another list of the prices of the FTSE100 (^FTSE) was also recovered from
http://finance.yahoo.com with the same horizon. With the two lists of prices, a cloud of points can be drawn in which both the share and market returns can be
measured and compared, these returns include any dividend payments made by either the components of the FTSE100 and Astrazeneca in the horizon chosen.
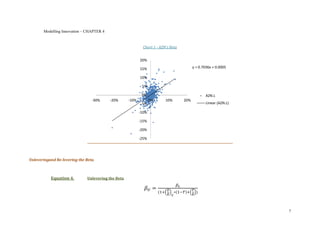
The risk free rate for UK Government Bonds is subtracted to each AstraZeneca and FTSE 100 returns. The result is presented in the chart below, the trend line
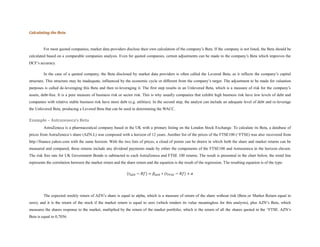
represents the correlation between the market return and the share return and the equation is the result of the regression. The resulting equation is of the type:

                                                              (𝑟 𝐴𝑍𝑁 − 𝑅𝑓) = 𝛽 𝐴𝑍𝑁 ∗ (𝑟 𝐹𝑇𝑆𝐸 − 𝑅𝑓) + 𝛼


         The expected weekly return of AZN’s share is equal to alpha, which is a measure of return of the share without risk (Beta or Market Return equal to
zero), and it is the return of the stock if the market return is equal to zero (which renders its value meaningless for this analysis), plus AZN’s Beta, which
measures the shares response to the market, multiplied by the return of the market portfolio, which is the return of all the shares quoted in the ^FTSE. AZN’s
Beta is equal to 0,7036.
Modelling Innovation – CHAPTER 4


                                                              Chart 1 - AZN's Beta


                                                            20%

                                                            15%                             y = 0.7036x + 0.0005

                                                            10%

                                                             5%

                                                             0%                                    AZN.L
                                 -30%     -20%       -10%          0%      10%        20%
                                                            -5%                                    Linear (AZN.L)

                                                            -10%

                                                            -15%

                                                            -20%

                                                            -25%


Unleveringand Re-levering the Beta.


           Equation 4.         Unlevering the Beta
                                                                                    𝛽𝐿
                                                               𝛽𝑈 =            𝐷           𝑃
                                                                        (1+(    ) ∗(1−𝑇)+( ))
                                                                               𝐸 𝐶        𝐸


                                                                                                                    7
Equation 5.            Re-levering the Beta
                                                                           𝐷               𝑃
                                                         𝛽 𝐿 = 𝛽 𝑈 ∗ (1 + ( ) ∗ (1 − 𝑇) + ( ))
                                                                           𝐸 𝑇             𝐸

𝛽 𝑈 → 𝑈𝑛𝑙𝑒𝑣𝑒𝑟𝑒𝑑 𝐵𝑒𝑡𝑎
𝛽 𝐿 → 𝐿𝑒𝑣𝑒𝑟𝑒𝑑 𝐵𝑒𝑡𝑎
𝑃 → 𝑆𝑡𝑜𝑐𝑘 𝑂𝑝𝑡𝑖𝑜𝑛𝑠 (𝑖𝑓 𝑒𝑥𝑖𝑠𝑡𝑒𝑛𝑡)
𝑇 → 𝑇𝑎𝑥 𝑅𝑎𝑡𝑒
𝐷 → 𝐷𝑒𝑏𝑡 (𝑀𝑎𝑟𝑘𝑒𝑡 𝑉𝑎𝑙𝑢𝑒)
𝐸 → 𝐸𝑞𝑢𝑖𝑡𝑦 (𝑀𝑎𝑟𝑘𝑒𝑡 𝑉𝑎𝑙𝑢𝑒)
 𝐷
( ) → 𝑇𝑎𝑟𝑔𝑒𝑡 𝐿𝑒𝑣𝑒𝑙 𝑜𝑓 𝐷𝑒𝑏𝑡
 𝐸 𝑇
 𝐷
( ) → 𝐶𝑢𝑟𝑟𝑒𝑛𝑡 𝐿𝑒𝑣𝑒𝑙 𝑜𝑓 𝐷𝑒𝑏𝑡
 𝐸 𝐶

          What is the Market Risk Premium?


The teaser is over! If you want to read the rest, you will have to wait until the full print is available at http://www.innovation-
models.com

More Related Content

What's hot

Professor Tong Yu's slides
Professor Tong Yu's slidesProfessor Tong Yu's slides
Professor Tong Yu's slidesMerjerz
 
Debt - Basics of Debt and Fixed Income
Debt - Basics of Debt and Fixed Income Debt - Basics of Debt and Fixed Income
Debt - Basics of Debt and Fixed Income BFSI academy
 
DETERMINANTS OF LEVERAGE DECISION
DETERMINANTS OF LEVERAGE DECISIONDETERMINANTS OF LEVERAGE DECISION
DETERMINANTS OF LEVERAGE DECISIONSundar B N
 

What's hot (7)

Capital structure
Capital structureCapital structure
Capital structure
 
Cost of capital
Cost of capitalCost of capital
Cost of capital
 
Bf chapter 4
Bf chapter 4Bf chapter 4
Bf chapter 4
 
Professor Tong Yu's slides
Professor Tong Yu's slidesProfessor Tong Yu's slides
Professor Tong Yu's slides
 
Debt - Basics of Debt and Fixed Income
Debt - Basics of Debt and Fixed Income Debt - Basics of Debt and Fixed Income
Debt - Basics of Debt and Fixed Income
 
Cost Of Capital
Cost Of CapitalCost Of Capital
Cost Of Capital
 
DETERMINANTS OF LEVERAGE DECISION
DETERMINANTS OF LEVERAGE DECISIONDETERMINANTS OF LEVERAGE DECISION
DETERMINANTS OF LEVERAGE DECISION
 

Similar to Chapter4 modelling innovation - teaser

Financial Management - An overview
Financial Management - An overviewFinancial Management - An overview
Financial Management - An overviewTanmay Rajpurkar
 
Mercer Capital | Valuation Insight | Capital Structure in 30 Minutes
Mercer Capital | Valuation Insight | Capital Structure in 30 MinutesMercer Capital | Valuation Insight | Capital Structure in 30 Minutes
Mercer Capital | Valuation Insight | Capital Structure in 30 MinutesMercer Capital
 
Unit 3 Cost of capital JNTUA Syllabus_Financial Management
Unit 3 Cost of capital JNTUA Syllabus_Financial ManagementUnit 3 Cost of capital JNTUA Syllabus_Financial Management
Unit 3 Cost of capital JNTUA Syllabus_Financial ManagementShaik Mohammad Imran
 
The first chapter introduces us to Corporate finance is essential .docx
The first chapter introduces us to Corporate finance is essential .docxThe first chapter introduces us to Corporate finance is essential .docx
The first chapter introduces us to Corporate finance is essential .docxoreo10
 
Assignment-2_Capital Structure.docx
Assignment-2_Capital Structure.docxAssignment-2_Capital Structure.docx
Assignment-2_Capital Structure.docxKameshwariPurusothma
 
Capital structure defenition
Capital structure defenitionCapital structure defenition
Capital structure defenitionsaravanan
 
Capital structure defenition
Capital structure defenitionCapital structure defenition
Capital structure defenitionsaravanan
 
Sources of capital on the basis of ownership & Cost Of Borrowed Capital & Lev...
Sources of capital on the basis of ownership & Cost Of Borrowed Capital & Lev...Sources of capital on the basis of ownership & Cost Of Borrowed Capital & Lev...
Sources of capital on the basis of ownership & Cost Of Borrowed Capital & Lev...RahulBisen13
 
COC Reading Material (2).pdf
COC Reading Material (2).pdfCOC Reading Material (2).pdf
COC Reading Material (2).pdfshagungupta497119
 
RBSA Advisors Research Report - The Reward of the ₹ : Cost of Capital In India
RBSA Advisors Research Report - The Reward of the ₹ : Cost of Capital In IndiaRBSA Advisors Research Report - The Reward of the ₹ : Cost of Capital In India
RBSA Advisors Research Report - The Reward of the ₹ : Cost of Capital In IndiaRBSA Advisors
 
2d Acli Paper Discount Rates 1 2011
2d Acli Paper Discount Rates 1 20112d Acli Paper Discount Rates 1 2011
2d Acli Paper Discount Rates 1 2011Doug Barnert
 

Similar to Chapter4 modelling innovation - teaser (20)

ch 12 cost of capital.pdf
ch 12 cost of capital.pdfch 12 cost of capital.pdf
ch 12 cost of capital.pdf
 
Financial Management - An overview
Financial Management - An overviewFinancial Management - An overview
Financial Management - An overview
 
Mercer Capital | Valuation Insight | Capital Structure in 30 Minutes
Mercer Capital | Valuation Insight | Capital Structure in 30 MinutesMercer Capital | Valuation Insight | Capital Structure in 30 Minutes
Mercer Capital | Valuation Insight | Capital Structure in 30 Minutes
 
passbook.docx
passbook.docxpassbook.docx
passbook.docx
 
Mrunmyee
MrunmyeeMrunmyee
Mrunmyee
 
Unit 3 Cost of capital JNTUA Syllabus_Financial Management
Unit 3 Cost of capital JNTUA Syllabus_Financial ManagementUnit 3 Cost of capital JNTUA Syllabus_Financial Management
Unit 3 Cost of capital JNTUA Syllabus_Financial Management
 
The first chapter introduces us to Corporate finance is essential .docx
The first chapter introduces us to Corporate finance is essential .docxThe first chapter introduces us to Corporate finance is essential .docx
The first chapter introduces us to Corporate finance is essential .docx
 
Assignment-2_Capital Structure.docx
Assignment-2_Capital Structure.docxAssignment-2_Capital Structure.docx
Assignment-2_Capital Structure.docx
 
Capital structure defenition
Capital structure defenitionCapital structure defenition
Capital structure defenition
 
Capital structure defenition
Capital structure defenitionCapital structure defenition
Capital structure defenition
 
Sources of capital on the basis of ownership & Cost Of Borrowed Capital & Lev...
Sources of capital on the basis of ownership & Cost Of Borrowed Capital & Lev...Sources of capital on the basis of ownership & Cost Of Borrowed Capital & Lev...
Sources of capital on the basis of ownership & Cost Of Borrowed Capital & Lev...
 
COC Reading Material (2).pdf
COC Reading Material (2).pdfCOC Reading Material (2).pdf
COC Reading Material (2).pdf
 
Ch 09
Ch 09Ch 09
Ch 09
 
RBSA Advisors Research Report - The Reward of the ₹ : Cost of Capital In India
RBSA Advisors Research Report - The Reward of the ₹ : Cost of Capital In IndiaRBSA Advisors Research Report - The Reward of the ₹ : Cost of Capital In India
RBSA Advisors Research Report - The Reward of the ₹ : Cost of Capital In India
 
Ppt financial management
 Ppt financial  management  Ppt financial  management
Ppt financial management
 
vluation of bond.pptx
vluation of bond.pptxvluation of bond.pptx
vluation of bond.pptx
 
2d Acli Paper Discount Rates 1 2011
2d Acli Paper Discount Rates 1 20112d Acli Paper Discount Rates 1 2011
2d Acli Paper Discount Rates 1 2011
 
Cost of capital
Cost of capitalCost of capital
Cost of capital
 
Sg03
Sg03Sg03
Sg03
 
Bf chapter 3
Bf chapter 3Bf chapter 3
Bf chapter 3
 

More from Hugo Mendes Domingos

Chapter5 modelling innovation - preview
Chapter5   modelling innovation - previewChapter5   modelling innovation - preview
Chapter5 modelling innovation - previewHugo Mendes Domingos
 
Innovation and the imf recommendations
Innovation and the imf recommendationsInnovation and the imf recommendations
Innovation and the imf recommendationsHugo Mendes Domingos
 
Chapter 3 modelling innovation - teaser
Chapter 3   modelling innovation - teaserChapter 3   modelling innovation - teaser
Chapter 3 modelling innovation - teaserHugo Mendes Domingos
 
Económico tv - 04.10.2010 - Sovereign Funds
Económico tv - 04.10.2010 - Sovereign FundsEconómico tv - 04.10.2010 - Sovereign Funds
Económico tv - 04.10.2010 - Sovereign FundsHugo Mendes Domingos
 
Económico tv - 2010.09.27 - The Clinton Initiative
Económico tv - 2010.09.27 - The Clinton InitiativeEconómico tv - 2010.09.27 - The Clinton Initiative
Económico tv - 2010.09.27 - The Clinton InitiativeHugo Mendes Domingos
 
Económico tv - 2010.09.18 - Price of Medicine in Portugal
Económico tv - 2010.09.18 - Price of Medicine in PortugalEconómico tv - 2010.09.18 - Price of Medicine in Portugal
Económico tv - 2010.09.18 - Price of Medicine in PortugalHugo Mendes Domingos
 
ETV - Company Insolvency and Innovation
ETV - Company Insolvency and Innovation ETV - Company Insolvency and Innovation
ETV - Company Insolvency and Innovation Hugo Mendes Domingos
 
ETV - Portugal’s austerity measures and the impact on business innovation
ETV - Portugal’s austerity measures and the impact on business innovationETV - Portugal’s austerity measures and the impact on business innovation
ETV - Portugal’s austerity measures and the impact on business innovationHugo Mendes Domingos
 
ETV - Bad loans, ECB intervention and competitive advantages
ETV - Bad loans, ECB intervention and competitive advantagesETV - Bad loans, ECB intervention and competitive advantages
ETV - Bad loans, ECB intervention and competitive advantagesHugo Mendes Domingos
 
Paper Contraditório - Private Equity - Transactions in Portugal
Paper Contraditório - Private Equity - Transactions in PortugalPaper Contraditório - Private Equity - Transactions in Portugal
Paper Contraditório - Private Equity - Transactions in PortugalHugo Mendes Domingos
 
1272894403 private equitytransactionsinportugal-final-original
1272894403 private equitytransactionsinportugal-final-original1272894403 private equitytransactionsinportugal-final-original
1272894403 private equitytransactionsinportugal-final-originalHugo Mendes Domingos
 

More from Hugo Mendes Domingos (20)

Post brooking's study
Post brooking's studyPost brooking's study
Post brooking's study
 
Chapter 7 ep - teaser
Chapter 7   ep - teaserChapter 7   ep - teaser
Chapter 7 ep - teaser
 
Chapter5 modelling innovation - preview
Chapter5   modelling innovation - previewChapter5   modelling innovation - preview
Chapter5 modelling innovation - preview
 
Innovation and the imf recommendations
Innovation and the imf recommendationsInnovation and the imf recommendations
Innovation and the imf recommendations
 
Top 5 posts hmd
Top 5 posts   hmdTop 5 posts   hmd
Top 5 posts hmd
 
Chapter 3 modelling innovation - teaser
Chapter 3   modelling innovation - teaserChapter 3   modelling innovation - teaser
Chapter 3 modelling innovation - teaser
 
Farol de ideias dicas 20100921
Farol de ideias dicas 20100921Farol de ideias dicas 20100921
Farol de ideias dicas 20100921
 
Económico tv pe 07072010 v2
Económico tv pe 07072010 v2Económico tv pe 07072010 v2
Económico tv pe 07072010 v2
 
Económico tv - 04.10.2010 - Sovereign Funds
Económico tv - 04.10.2010 - Sovereign FundsEconómico tv - 04.10.2010 - Sovereign Funds
Económico tv - 04.10.2010 - Sovereign Funds
 
Económico tv - 2010.09.27 - The Clinton Initiative
Económico tv - 2010.09.27 - The Clinton InitiativeEconómico tv - 2010.09.27 - The Clinton Initiative
Económico tv - 2010.09.27 - The Clinton Initiative
 
Económico tv - 2010.09.18 - Price of Medicine in Portugal
Económico tv - 2010.09.18 - Price of Medicine in PortugalEconómico tv - 2010.09.18 - Price of Medicine in Portugal
Económico tv - 2010.09.18 - Price of Medicine in Portugal
 
Impacto da TSU
Impacto da TSUImpacto da TSU
Impacto da TSU
 
Crédito vencido em Portugal
Crédito vencido em PortugalCrédito vencido em Portugal
Crédito vencido em Portugal
 
Insolvências em Portugal
Insolvências em PortugalInsolvências em Portugal
Insolvências em Portugal
 
ETV - Company Insolvency and Innovation
ETV - Company Insolvency and Innovation ETV - Company Insolvency and Innovation
ETV - Company Insolvency and Innovation
 
ETV - Portugal’s austerity measures and the impact on business innovation
ETV - Portugal’s austerity measures and the impact on business innovationETV - Portugal’s austerity measures and the impact on business innovation
ETV - Portugal’s austerity measures and the impact on business innovation
 
ETV - Bad loans, ECB intervention and competitive advantages
ETV - Bad loans, ECB intervention and competitive advantagesETV - Bad loans, ECB intervention and competitive advantages
ETV - Bad loans, ECB intervention and competitive advantages
 
Paper Contraditório - Private Equity - Transactions in Portugal
Paper Contraditório - Private Equity - Transactions in PortugalPaper Contraditório - Private Equity - Transactions in Portugal
Paper Contraditório - Private Equity - Transactions in Portugal
 
Black swan 20120524 1416
Black swan 20120524 1416Black swan 20120524 1416
Black swan 20120524 1416
 
1272894403 private equitytransactionsinportugal-final-original
1272894403 private equitytransactionsinportugal-final-original1272894403 private equitytransactionsinportugal-final-original
1272894403 private equitytransactionsinportugal-final-original
 

Chapter4 modelling innovation - teaser

  • 1. Modelling Innovation – CHAPTER 4 Chapter 4 The weighted average cost of capital1 4.1 What is the WACC? The WACC is the appropriate discount rate of a company’s cash flows given its capital structure. The capital structure of a company includes Equity, Debt, as well as other forms of financing (including hybrid securities). The WACC is the average cost of these types of capital, according to the proportion that each represents in the company’s capital structure. The WACC takes into account the return for equity and debt holders and is the right discount rate to calculate the Enterprise Value and, based on that figure, the company’s Equity Value (and as a result, other measures including share price estimates). The shareholders’ return on their shares (the return on equity) represents a financial cost to the company and is usually higher than the return demanded by banks and investors in order to extend finance to the company in the form of loans, bonds or other fixed income securities. Equity holders will only obtain returns on their investment after paying off other security holders, due to the nature of the equity contract. Accordingly, equity investors demand a higher return than debt holders or bondholders. The DCF method takes this into account in the WACC, which is a blended cost of capital. 4.2 The WACC equation The DCF methodology is extremely sensitive to the discount rate and therefore the WACC should be calculated in detail. An interpretation and comparison to reality should be made before using the WACC in the DCF model. The following formula uses the case of a company financed by Equity, Debt 1 © 2012, Hugo Mendes Domingos and Eduardo Vera-Cruz Pinto 1
  • 2. and Preferred Shares. A variation of the same formula would be used if the analysed company used other forms of capital, such as convertibles or other hybrid securities. Equation 1. Weighted Average Cost of Capital Formula In this formula, the WACC is calculated after tax in the sense that the cost of debt taken into account allows for the tax shield impact of debt financing. Interest is usually tax deductible, and as a result, a company’s cost of debt should be considered net of the tax savings generated by the fact that the company will reduce its tax payments to the extent that it uses debt as a form of financing. Preferred Shares are presented in the calculation of the WACC without taxation as it is a hybrid form of finance (with both debt and equity characteristics) and its coupon may be classified as a dividend and is usually not tax deductible (except in some countries). For the sake of simplicity, we assume that the interest paid on preferred shares is non tax-deductible. 4.3 What is the Cost of Debt? The cost of debt in valuation models is the annual cost that the company incurs for being financed by debt (assuming that the model itself is annual). This cost is normally mistaken for the interest rate on bank loans; however there are other debt instruments that dismiss this simplistic view, including bonds,
  • 3. Modelling Innovation – CHAPTER 4 bank loans and other forms of fixed income financing. What is needed is a general formula that takes into account the fact that the same company could be financed using various forms of debt or via the fixed income capital markets. The formula for determining the cost of debt is as follows: Equation 2. Cost of Debt 𝐾 𝐷 = 𝑅𝑓 + 𝑆𝑝𝑟𝑒𝑎𝑑 + 𝐶𝑅𝑃 𝐾 𝐷 → 𝐶𝑜𝑠𝑡 𝑜𝑓 𝐷𝑒𝑏𝑡 𝑅𝑓 → 𝑅𝑖𝑠𝑘 𝑓𝑟𝑒𝑒 𝑟𝑎𝑡𝑒 𝐶𝑅𝑃 → 𝐶𝑜𝑢𝑛𝑡𝑟𝑦 𝑅𝑖𝑠𝑘 𝑃𝑟𝑒𝑚𝑖𝑢𝑚  The Risk Free Rate for the Cost of Debt and the Country Risk Premium This parameter is the minimum cost of debt (if the spread is zero) and is theoretically a zero-coupon bond. Since zero-coupon bonds are not immediately available at all maturities, an acceptable estimation is to use the yield on a Government bond. At first, the analyst might have the tendency to bonds of the country where the company is headquartered. In practice, this is not the best approach. For European countries, we recommend the use of a German bund, especially if the company consolidates in euros. The specific risk associated with the country is captured by the country risk premium (CRP), which is described later on. In the case of a UK company reporting in Pounds Sterling, the UK Government bond yield should be used. In that case, there is no need to use the CRP since the Government bond used as a proxy for the Risk Free Rate captures the country’s risk. The same principle would apply to a German company. For companies that operate in various countries, a separate analysis should be conducted for every country that is a material contributor to the revenues. In those cases, a specific WACC (and a specific cost of debt) should be calculated for each country. The analyst should use bonds with maturity equal to the projection period of valuation. When in doubt, the standard favoured by practitioners is the 10-year bond.  The Spread This spread is the additional return from the risk-free rate, demanded by banks, creditors or fixed income investors, when extending finance to a particular company. If the company has issued bonds listed on an exchange, the spread will be calculated based on the yield to maturity of those bonds. If the company has obtained a credit rating, its spread is usually public information or can be obtained from the agency that issued the rating. 3
  • 4. For private companies without credit rating and that do not disclose their spread (as is usually the case), there are two options. If the analyst has access to the company’s confidential information, the average spread should be calculated as the weighted average of the spreads corresponding to the company’s actual debt, with the weight corresponding to the outstanding amount for each loan or security. Note that we do not recommend the use of the spread at which the company can raise finance in the market at the date of valuation since this might be an unusually low or unusually high number. In our view, using the average is a better way to capture the company’s average cost of debt across the business cycle. If the analysis has to be performed without having access to confidential information, the best option is often to perform a comparable companies analysis, using quoted comparable companies that disclose their own spreads, or through market consultation.  The Country Risk Premium This assumption corresponds to the additional premium, which would be demanded by investors in order to invest in a particular country. There are a number of sources for the CRP. The website of Aswath Damodaran at New York University is often used as it tracks the premiums for a number of countries in a reliable way and is updated regularly. Damodaran calculates the country risk premium for us his website is public therefore in our view there is no need to perform the calculation.  The Inflation Delta This assumption is useful, for instance, for Eurozone companies that report in euro and have operations in countries outside the Eurozone. In that case, each country’s cash flows should (at least theoretically) be valued separately in local currency. Accordingly, the WACC should vary for each of those countries. The inflation delta captures the difference in the medium to long-run inflation in that particular country. It can be calculated by deducting the non-Eurozone country’s expected inflation projections from the projected euro inflation. 4.4 What is the Cost of Equity? The cost of equity is the annual cost the company incurs for having issued shares (again, assuming that we are dealing with annual cash flow projections). This cost is normally higher than the cost of debt, as was described earlier, and given the nature of equity, it is not tax deductible. Cost of equity is determined by the following equation: Equation 3. Cost of Equity 𝐾 𝐸 = 𝑅𝑓 + (𝛽 𝐶𝑜𝑚𝑝𝑎𝑛𝑦 ∗ 𝑀𝑅𝑃)
  • 5. Modelling Innovation – CHAPTER 4 𝐾 𝐸 → 𝐶𝑜𝑠𝑡 𝑜𝑓 𝐸𝑞𝑢𝑖𝑡𝑦 𝑅𝑓 → 𝑅𝑖𝑠𝑘 𝑓𝑟𝑒𝑒 𝑅𝑎𝑡𝑒 𝛽 𝐶𝑜𝑚𝑝𝑎𝑛𝑦 → 𝐶𝑜𝑚𝑝𝑎𝑛𝑦′𝑠 𝐵𝑒𝑡𝑎  What is the company’s Beta? A company’s beta represents the sensitivity of a share to market movements, ceteris paribus, when it is analysed individually. A Beta is an empirical indication of the relation between the return of a share’s price and the return of the Market. The beta should be adjusted to take into account the company’s capital structure and debt. Table 1- Beta Value Descriptions 5
  • 6. Calculating the Beta For most quoted companies, market data providers disclose their own calculation of the company’s Beta. If the company is not listed, the Beta should be calculated based on a comparable companies analysis. Even for quoted companies, certain adjustments can be made to the company’s Beta which improves the DCF’s accuracy. In the case of a quoted company, the Beta disclosed by market data providers is often called the Levered Beta, as it reflects the company’s capital structure. This structure may be inadequate, influenced by the economic cycle or different from the company’s target. The adjustment to be made for valuation purposes is called de-leveraging this Beta and then re-leveraging it. The first step results in an Unlevered Beta, which is a measure of risk for the company’s assets, debt-free. It is a pure measure of business risk or sector risk. This is why usually companies that exhibit high business risk have low levels of debt and companies with relative stable business risk have more debt (e.g. utilities). In the second step, the analyst can include an adequate level of debt and re-leverage the Unlevered Beta, producing a Levered Beta that can be used in determining the WACC. Example – Astrazeneca’s Beta AstraZeneca is a pharmaceutical company based in the UK with a primary listing on the London Stock Exchange. To calculate its Beta, a database of prices from AstraZeneca’s share (AZN.L) was composed with a horizon of 12 years. Another list of the prices of the FTSE100 (^FTSE) was also recovered from http://finance.yahoo.com with the same horizon. With the two lists of prices, a cloud of points can be drawn in which both the share and market returns can be measured and compared, these returns include any dividend payments made by either the components of the FTSE100 and Astrazeneca in the horizon chosen. The risk free rate for UK Government Bonds is subtracted to each AstraZeneca and FTSE 100 returns. The result is presented in the chart below, the trend line represents the correlation between the market return and the share return and the equation is the result of the regression. The resulting equation is of the type: (𝑟 𝐴𝑍𝑁 − 𝑅𝑓) = 𝛽 𝐴𝑍𝑁 ∗ (𝑟 𝐹𝑇𝑆𝐸 − 𝑅𝑓) + 𝛼 The expected weekly return of AZN’s share is equal to alpha, which is a measure of return of the share without risk (Beta or Market Return equal to zero), and it is the return of the stock if the market return is equal to zero (which renders its value meaningless for this analysis), plus AZN’s Beta, which measures the shares response to the market, multiplied by the return of the market portfolio, which is the return of all the shares quoted in the ^FTSE. AZN’s Beta is equal to 0,7036.
  • 7. Modelling Innovation – CHAPTER 4 Chart 1 - AZN's Beta 20% 15% y = 0.7036x + 0.0005 10% 5% 0% AZN.L -30% -20% -10% 0% 10% 20% -5% Linear (AZN.L) -10% -15% -20% -25% Unleveringand Re-levering the Beta. Equation 4. Unlevering the Beta 𝛽𝐿 𝛽𝑈 = 𝐷 𝑃 (1+( ) ∗(1−𝑇)+( )) 𝐸 𝐶 𝐸 7
  • 8. Equation 5. Re-levering the Beta 𝐷 𝑃 𝛽 𝐿 = 𝛽 𝑈 ∗ (1 + ( ) ∗ (1 − 𝑇) + ( )) 𝐸 𝑇 𝐸 𝛽 𝑈 → 𝑈𝑛𝑙𝑒𝑣𝑒𝑟𝑒𝑑 𝐵𝑒𝑡𝑎 𝛽 𝐿 → 𝐿𝑒𝑣𝑒𝑟𝑒𝑑 𝐵𝑒𝑡𝑎 𝑃 → 𝑆𝑡𝑜𝑐𝑘 𝑂𝑝𝑡𝑖𝑜𝑛𝑠 (𝑖𝑓 𝑒𝑥𝑖𝑠𝑡𝑒𝑛𝑡) 𝑇 → 𝑇𝑎𝑥 𝑅𝑎𝑡𝑒 𝐷 → 𝐷𝑒𝑏𝑡 (𝑀𝑎𝑟𝑘𝑒𝑡 𝑉𝑎𝑙𝑢𝑒) 𝐸 → 𝐸𝑞𝑢𝑖𝑡𝑦 (𝑀𝑎𝑟𝑘𝑒𝑡 𝑉𝑎𝑙𝑢𝑒) 𝐷 ( ) → 𝑇𝑎𝑟𝑔𝑒𝑡 𝐿𝑒𝑣𝑒𝑙 𝑜𝑓 𝐷𝑒𝑏𝑡 𝐸 𝑇 𝐷 ( ) → 𝐶𝑢𝑟𝑟𝑒𝑛𝑡 𝐿𝑒𝑣𝑒𝑙 𝑜𝑓 𝐷𝑒𝑏𝑡 𝐸 𝐶  What is the Market Risk Premium? The teaser is over! If you want to read the rest, you will have to wait until the full print is available at http://www.innovation- models.com