Financial statement analysis
•
0 likes•372 views

Financial statment analysis is very important for every organization, because compnay get the info for its future planning, how to make growth plan ,

Recommended
More Related Content
Similar to Financial statement analysis
Similar to Financial statement analysis (20)
More from Sumaira Sultana Talpur (MBA Finance)
More from Sumaira Sultana Talpur (MBA Finance) (19)
Recently uploaded
Recently uploaded (20)
Financial statement analysis
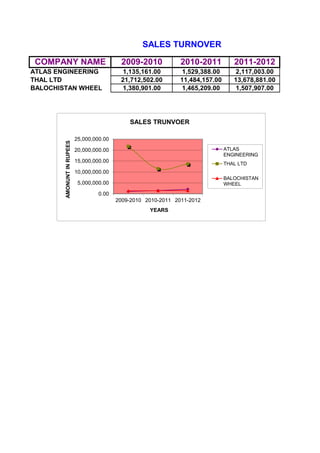
- 1. 2009-2010 2010-2011 2011-2012 1,135,161.00 1,529,388.00 2,117,003.00 21,712,502.00 11,484,157.00 13,678,881.00 1,380,901.00 1,465,209.00 1,507,907.00 SALES TURNOVER ATLAS ENGINEERING THAL LTD BALOCHISTAN WHEEL COMPANY NAME 0.00 5,000,000.00 10,000,000.00 15,000,000.00 20,000,000.00 25,000,000.00 2009-2010 2010-2011 2011-2012 AMONUNTINRUPEES YEARS SALES TRUNVOER ATLAS ENGINEERING THAL LTD BALOCHISTAN WHEEL
- 3. 2009-2010 2010-2011 2011-2012 1.576667 1.51 2.213333 0.833333 0.983333 1.28 0.133333 0.235667 0.293333 0.14 0.246667 0.363333 141.2133 168.0533 172.0667 5.3 0.64 1.13 CURRENT LIABILITIES 0.16 0.16 0.21 CURRENT RATIO = CURRENT ASSETS 0.9 0.97 3.67 3.4 CASH RATIO = CASH 0.01 0.007 QUICK RATIO = CURRENT ASSET-INVENTORY 0.57 0.52 0.7 1.13 CURRENT LIABILITIES 0.03 CURRENT LIABILITIES 0.2 0.5 0.5 1.5 1.23 1.3 1.7 -0.03 -0.01 0 0.3 TOTAL ASSET 0.19 0.2 0.35 0.04 INTERVAL MEASURE = CURRENT ASSET 112.5 104 198.59 211.9 0.4 0.45 0.45 0.65 99.3 AVERAGE DAILY OPERATING COST 112.55 188.26 196.4 NET W.C TO ASSET NET WORKING CAPITAL 220.5 CALCULATION FOR INDUSTRY AVERAGES RATIOSLIQUIDITY RATIOS ATLAS ENGINEERING THAL LTD BALOCHISTAN WHEEL ATLAS ENGINEERING THAL LTD BALOCHISTAN WHEEL ATLAS ENGINEERING THAL LTD BALOCHISTAN WHEEL ATLAS ENGINEERING THAL LTD BALOCHISTAN WHEEL ATLAS ENGINEERING THAL LTD BALOCHISTAN WHEEL
- 4. 0.376 0.313333 0.286667 0.644333 0.496667 0.47 0.146667 0.11 0.09 5.886667 4.576667 4.873333 78.01667 96.29 96.76667 0.45 LONG TERM SOLVENCY RATIO TOTAL EQUITY TOTAL DEBIT RATIO = TOTAL ASSET -TOTAL EQUITY 0.44 LONG TERM DEBT LONG TERM DEBIT 0.18 0.49 TOTAL ASSETS DEB TO EQTY RATIO = TOTAL DEBIT 0.8 0.83 0.95 0.2 0.22 LONG TERM DEBIT+ TOTAL EQUITY 0.82 0.35 0.25 0.313 0.31 0.21 0.17 0.07 0 0.45 0.26 0.2 0.238 0.23 0.17 0.09 0.06 0.05 7.6 8.4 INVENTORY ASSET MANAGEMENT OR TURN OVER RATIO INVEN TURN OVER RATIO = COGS 8.9 6 3.39 3.8 2.76 2.74 2.42 DAYS SALES IN INVETORY = DAYS 41 48 43.5 INENTORY TURNVOER DAYS IN SALES 60.8 107.67 96 132.25 133.2 150.8 ATLAS ENGINEERING THAL LTD BALOCHISTAN WHEEL ATLAS ENGINEERING THAL LTD BALOCHISTAN WHEEL ATLAS ENGINEERING THAL LTD BALOCHISTAN WHEEL ATLAS ENGINEERING THAL LTD BALOCHISTAN WHEEL ATLAS ENGINEERING THAL LTD BALOCHISTAN WHEEL
- 5. 14.44667 14.8 13.8 29.30333 25.89667 26.93333 -6.12333 -37.48 14.26333 1.88 2.766667 3.3 25 27 RECEIVABLE TURN VOER 19.2 22.4 RECEVIABLE TURNOVER RATIO A/CC REC TURNOVER RATIO SALES 9.1 14.5 13.5 ACC REC 22.8 PAYABLE TURNOVER RATIO ASSET TURNOVER RATIO = SALES -33.2 31.91 DAYS SALES IN RECEIVABLE = DAYS 40 -119.2 36.8 N.W.C 3.8 3.49 FIXED ASSET TURNOVER = SALES 1.4 11.7 3.13 1.8 2.6 NET FIXED ASSET 3.9 2.9 3.3 0.34 3.6 4 1.24 1.58 1.4 1.4 0.99 TOTAL ASSETS 1.9 1.3 1.37 1.3 TOTAL ASSET TURNOVER RATIO SALES 19 16.3 11.44 10.9 11.6 16 33.49 31.4 2.96 2.5 ATLAS ENGINEERING THAL LTD BALOCHISTAN WHEEL ATLAS ENGINEERING THAL LTD BALOCHISTAN WHEEL ATLAS ENGINEERING THAL LTD BALOCHISTAN WHEEL ATLAS ENGINEERING THAL LTD BALOCHISTAN WHEEL ATLAS ENGINEERING THAL LTD BALOCHISTAN WHEEL
- 6. 1.42 1.28 1.46 0.05 0.056667 0.073333 0.07 0.08 0.37 0.113333 0.106667 0.14 9.14 8.79 11.02667 0.04 0.02 0.03 PAYABLE TURNOVER RATIO RETURN ON ASSETS = NET INCOME 0.03 0.05 0.05 PROFIT MARGIN = NET INCOME SALES 0.04 0.06 0.07 0.12 0.06 SHARES OUT STANDING MARKET VALUE MEASURES EPS = NET INCOME 1.9 0.05 0.1 TOTAL EQUITY 0.16 0.16 0.21 RETURN ON EQUITY = NET INCOME 0.07 0.09 TOTAL ASSETS 6.27 7.12 7.7 0.11 0.11 0.11 19.25 17.75 22.48 0.12 0.17 1.5 2.9 0.08 0.09 0.89 0.09 ATLAS ENGINEERING THAL LTD BALOCHISTAN WHEEL ATLAS ENGINEERING THAL LTD BALOCHISTAN WHEEL ATLAS ENGINEERING BALOCHISTAN WHEEL THAL LTD BALOCHISTAN WHEEL ATLAS ENGINEERING THAL LTD
- 7. ATLAS ENGINEERING THAL LTD BALOCHISTAN WHEEL ATLAS ENGINEERING THAL LTD BALOCHISTAN WHEEL ATLAS ENGINEERING THAL LTD BALOCHISTAN WHEEL ATLAS ENGINEERING THAL LTD BALOCHISTAN WHEEL ATLAS ENGINEERING THAL LTD BALOCHISTAN WHEEL
- 8. ATLAS ENGINEERING THAL LTD BALOCHISTAN WHEEL ATLAS ENGINEERING THAL LTD BALOCHISTAN WHEEL ATLAS ENGINEERING THAL LTD BALOCHISTAN WHEEL ATLAS ENGINEERING THAL LTD BALOCHISTAN WHEEL ATLAS ENGINEERING THAL LTD BALOCHISTAN WHEEL
- 9. ATLAS ENGINEERING THAL LTD BALOCHISTAN WHEEL ATLAS ENGINEERING THAL LTD BALOCHISTAN WHEEL ATLAS ENGINEERING THAL LTD BALOCHISTAN WHEEL ATLAS ENGINEERING THAL LTD BALOCHISTAN WHEEL ATLAS ENGINEERING THAL LTD BALOCHISTAN WHEEL
- 10. ATLAS ENGINEERING THAL LTD BALOCHISTAN WHEEL ATLAS ENGINEERING THAL LTD BALOCHISTAN WHEEL ATLAS ENGINEERING BALOCHISTAN WHEEL THAL LTD BALOCHISTAN WHEEL ATLAS ENGINEERING THAL LTD
- 11. 2009-2010 2010-2011 2011-2012 1.58 1.5 2.2 0.83 0.98 1.28 0.13 0.256 0.29 0.9 0.64 CURRENT LIABILITIES CASH RATIO = CASH 0.01 0.007 0.03 CURRENT LIABILITIES QUICK RATIO = INDUSTRY INDUSTRY ATLAS ENGINEERING FINANCIAL STATEMENT ANALYSIS RATIOS CALCULATIONS INDUSTRY LIQUIDITY RATIOS CURRENT RATIO = CURRENT ASSETS CURRENT ASSET-INVENTORY 0.57 0.52 0.97 1.13 CURRENT LIABILITIES
- 12. 0.14 0.25 0.36 141.2 168 172 0.38 0.31 0.29 0.49 TOTAL ASSETS LONG TERM SOLVENCY RATIO INTERVAL MEASURE = CURRENT ASSET 112.5 TOTAL DEBIT RATIO = TOTAL ASSET -TOTAL EQUITY 0.44 0.45 -0.01 0.04 TOTAL ASSET NET W.C TO ASSET RATIO = NET WORKING CAPITAL -0.03 104 99.3 AVERAGE DAILY OPERATING COST INDUSTRY INDUSTRY INDUSTRY
- 13. 0.64 0.5 0.47 0.15 0.11 0.09 5.9 4.6 4.9 INVEN TURN OVER RATIO = COGS 8.9 7.6 0.2 0.22 LONG TERM DEBIT+ TOTAL EQUITY ASSET MANAGEMENT OR TURN OVER RATIO INDUSTRY 8.4 INVENTORY LONG TERM DEBT LONG TERM DEBIT 0.18 DEB TO EQTY RATIO = TOTAL DEBIT 0.8 0.83 0.95 TOTAL EQUITY INDUSTRY INDUSTRY
- 14. 78.02 96.29 96.8 14.4 14.8 13.8 29.3 25.9 26.9 ASSET TURNOVER RATIO = SALES -33.2 -119.2 27 RECEIVABLE TURN VOER PAYABLE TURNOVER RATIO DAYS SALES IN RECEIVABLE = DAYS 40 36.8 N.W.C DAYS SALES IN INVETORY = DAYS 41 48 43.5 INENTORY TURNVOER DAYS IN SALES 25 9.1 14.5 13.5 ACC REC RECEVIABLE TURNOVER RATIO A/CC REC TURNOVER RATIO = SALES INDUSTRY INDUSTRY INDUSTRY
- 15. -6.1 -37.48 14.26 1.88 2.8 3.3 1.42 1.28 1.46 0.05 0.056 0.07 0.04 0.99 1.24 0.02 0.03 SALES FIXED ASSET TURNOVER = SALES 1.4 1.8 2.6 NET FIXED ASSET 1.58 TOTAL ASSETS TOTAL ASSET TURNOVER RATIO = SALES INDUSTRY INDUSTRY INDUSTRY INDUSTRY PAYABLE TURNOVER RATIO PROFIT MARGIN = NET INCOME
- 16. 0.07 0.08 0.37 0.11 0.12 0.14 9.14 8.79 11.02 0.07 0.05 0.1 TOTAL EQUITY RETURN ON ASSETS = 1.9 1.5 2.9 SHARES OUT STANDING MARKET VALUE MEASURES EPS = NET INCOME INDUSTRY NET INCOME 0.04 0.03 0.05 TOTAL ASSETS INDUSTRY INDUSTRY RETURN ON EQUITY = NET INCOME
- 17. NGINEERING ATEMENT ANALYSIS GRAHPHICAL COMPARASION 0 0.2 0.4 0.6 0.8 1 1.2 1.4 2009-2010 2010-2011 2011-2012 RATIO YEARS QUICK RATIO ATLAS ENGIEERING INDUSTRY AVERAGES 0 0.5 1 1.5 2 2.5 2009-2010 2010-2011 2011-2012 RATIO YEARS CURRENT RATIO ATLAS ENGINEERING INDUSTRY AVERAGES 0 0.05 0.1 0.15 0.2 0.25 0.3 0.35 2009-2010 2010-2011 2011-2012 RATIO YEARS CASH RATIO ATLAS ENGINEERING INDUSTRY AVERAGES
- 18. 0 0.1 0.2 0.3 0.4 0.5 0.6 2009-2010 2010-2011 2011-2012 RATIO YEARS TOTAL DEBIT RATIO ATLAS ENGINEERING INDUSTRY AVERAGES DEBIT TO EQUITY RATIO 0 50 100 150 200 2009-2010 2010-2011 2011-2012 RATIOS YEARS INTERVAIL MAEASURE ATLAS ENGINEERING INDUSTRY AVERAGES -0.05 0 0.05 0.1 0.15 0.2 0.25 0.3 0.35 0.4 2009-2010 2010-2011 2011-2012 RATIO YEARS NET WORKING CAPITAL TO T.ASSET RATIO ATLAS ENGINEERING INDUSTRY AVERAGES
- 19. 0 0.2 0.4 0.6 0.8 1 2009-2010 2010-2011 2011-2012 RATIO YEARS ATLAS ENGINEERING INDUSTRY AVERAGES 0 1 2 3 4 5 6 7 8 9 10 2009-2010 2010-2011 2011-2012 RATIO YEARS INV TURN OVER RATIO ATLAS ENGINERING INDUSTRY AVERAGES 0 0.05 0.1 0.15 0.2 0.25 2009-2010 2010-2011 2011-2012 RATIOS YEARS LONG TERM DEBIT RATIO ATLAS ENGINERING INDUSTRY AVERAGES 100 120 DAYS SALES IN INVENTORY
- 20. 0 20 40 60 80 100 2009-2010 2010-2011 2011-2012 RATIOS YEARS ATLAS ENGINEERING INDUSTRY AVERAGES 0 2 4 6 8 10 12 14 16 2009-2010 2010-2011 2011-2012 RATIOS YEARS A/C RECEIABLE TURN OVER RATIO ATLAS ENGINEERING INDUSTRY AVERAGES 0 10 20 30 40 50 29.3 25.9 26.9 RATIOS YEARS DAYS SALES IN RECEIABLE ATLAS ENGINEERING INDUSTRY AVERAGES -50 0 50 -6.1 -37.48 14.26 RATIOS ASSET TURNOVER RATIO ATLAS ENGINEERING INDUSTRY AVERAGES
- 21. 0 0.01 0.02 0.03 0.04 0.05 0.06 0.07 0.08 2009-2010 2010-2011 2011-2012 RATIO YEARS PROFIT MARGIN ATLAS ENGINEERING INDUSTRY AVERAGES -150 -100 -50 RATIOS YEARS INDUSTRY AVERAGES 0 0.5 1 1.5 2 2.5 3 3.5 2009-2010 2010-2011 2011-2012 RATIOS YEARS FIXED ASSET TURNOVER RATIO ATLAS ENGINEERING INDUSTRY AVERAGES 0 0.5 1 1.5 2 2009-2010 2010-2011 2011-2012 RATIOS YEARS TOTAL ASSET TURNOVER RATIO ATLAS ENGINEERING INDUSTRY AVERAGES
- 22. YEARS 0 2 4 6 8 10 12 2009-2010 2010-2011 2011-2012 RATIO YEARS EEARNING PER SHARE ATLAS ENGINEERING INDUSTRY AVERAGES 0 0.05 0.1 0.15 0.2 0.25 0.3 0.35 0.4 2009-2010 2010-2011 2011-2012 RATIOS YEARS RETURN ON ASSETS ATLAS ENGINEERING INDUSTRY AVERAGES 0 0.02 0.04 0.06 0.08 0.1 0.12 0.14 0.16 2009-2010 2010-2011 2011-2012 RATIOS YEARS RETURN ON EQUITY ATLAS ENGINEERING INDUSTRY AVERAGES
- 23. 2009-2010 2010-2011 2011-2012 1.58 1.5 2.2 0.83 0.98 1.28 0.13 0.256 0.29 1.5 1.5 CURRENT LIABILITIES CASH RATIO = CASH 0.2 0.5 0.5 CURRENT LIABILITIES QUICK RATIO = INDUSTRY INDUSTRY THAL LIMITED FINANCIAL STATEMENT ANALYSIS RATIOS CALCULATIONS INDUSTRY LIQUIDITY RATIOS CURRENT RATIO = CURRENT ASSETS CURRENT ASSET-INVENTORY 0.7 1.13 2.7 3 CURRENT LIABILITIES
- 24. 0.14 0.25 0.36 141.2 168 172 0.38 0.31 0.29 0.2 TOTAL ASSETS LONG TERM SOLVENCY RATIO INTERVAL MEASURE = CURRENT ASSET 112.55 TOTAL DEBIT RATIO = TOTAL ASSET -TOTAL EQUITY 0.45 0.26 0.3 0.4 TOTAL ASSET NET W.C TO ASSET RATIO = NET WORKING CAPITAL 0 188.26 196.4 AVERAGE DAILY OPERATING COST INDUSTRY INDUSTRY INDUSTRY
- 25. 0.64 0.5 0.47 0.15 0.11 0.09 5.9 4.6 4.9 INVEN TURN OVER RATIO = COGS 6 3.39 0.07 0 LONG TERM DEBIT+ TOTAL EQUITY ASSET MANAGEMENT OR TURN OVER RATIO INDUSTRY 3.8 INVENTORY LONG TERM DEBT LONG TERM DEBIT 0.17 DEB TO EQTY RATIO = TOTAL DEBIT 0.82 0.35 0.25 TOTAL EQUITY INDUSTRY INDUSTRY
- 26. 78.02 96.29 96.8 14.4 14.8 13.8 29.3 25.9 26.9 ASSET TURNOVER RATIO = SALES 11.7 3.8 22.4 RECEIVABLE TURN VOER PAYABLE TURNOVER RATIO DAYS SALES IN RECEIVABLE = DAYS 16 3.49 N.W.C DAYS SALES IN INVETORY = DAYS 60.8 107.67 96 INENTORY TURNVOER DAYS IN SALES 19.2 22.8 19 16.3 ACC REC RECEVIABLE TURNOVER RATIO A/CC REC TURNOVER RATIO = SALES INDUSTRY INDUSTRY INDUSTRY
- 27. -6.1 -37.48 114.26 1.88 2.8 3.3 1.42 1.28 1.46 0.05 0.056 0.07 0.05 1.9 1.3 0.09 0.12 SALES FIXED ASSET TURNOVER = SALES 3.9 2.9 3.3 NET FIXED ASSET 1.4 TOTAL ASSETS TOTAL ASSET TURNOVER RATIO = SALES INDUSTRY INDUSTRY INDUSTRY INDUSTRY PAYABLE TURNOVER RATIO PROFIT MARGIN = NET INCOME
- 28. 0.07 0.08 0.37 0.11 0.12 0.14 9.14 8.79 11.02 0.16 0.16 0.21 TOTAL EQUITY RETURN ON ASSETS = 19.25 17.75 22.48 SHARES OUT STANDING MARKET VALUE MEASURES EPS = NET INCOME INDUSTRY NET INCOME 0.09 0.12 0.17 TOTAL ASSETS INDUSTRY INDUSTRY RETURN ON EQUITY = NET INCOME
- 29. LIMITED ATEMENT ANALYSIS GRAHPHICAL COMPARASION 0 0.5 1 1.5 2 2.5 3 3.5 2009-2010 2010-2011 2011-2012 RATIOS YEARS CURRENT RATIO THAL LTD INDUSTRY AVERAGES 0 0.5 1 1.5 2 0.83 0.98 1.28 RATIO YEARS QUICK RATIO THAL LTD INDUSTRY AVERAGES 0 0.1 0.2 0.3 0.4 0.5 0.6 2009-2010 2010-2011 2011-2012 RATIO YEARS CASH RATIO THAL LTD INDUSTRY AVERAGES
- 30. 0 0.1 0.2 0.3 0.4 0.5 2009-2010 2010-2011 2011-2012 RATIO YEARS TOTAL DEBIT RATIO THAL LTD INDUSTRY AVERAGES 0 0.05 0.1 0.15 0.2 0.25 0.3 0.35 0.4 0.45 2009-2010 2010-2011 2011-2012 RATIOS YEARS NET WORKING CAPITAL TO ASSET RATIO THAL LTD INDUSTRY AVERAGES 0 50 100 150 200 250 2009-2010 2010-2011 2011-2012 RATIO YEARS INTERVAIL MEASURE THAL LTD INDUSTRY AVERAGES 0.7 0.8 0.9 DEBIT TO EQUITY RATIO
- 31. 0 1 2 3 4 5 6 7 2009-2010 2010-2011 2011-2012 RATIO YEARS INV TURN OVER RATIO THAL LTD INDUSTRY AVERAGES 0 0.02 0.04 0.06 0.08 0.1 0.12 0.14 0.16 0.18 2009-2010 2010-2011 2011-2012 RATIOS YEARS LONG TERM DEBIT RATIO THAL LTD INDUSTRY AVEAGES 100 120 DAYS SALES IN INVENTORY 0 0.1 0.2 0.3 0.4 0.5 0.6 0.7 0.8 2009-2010 2010-2011 2011-2012 RATIO YEARS THAL LTD INDUSTRY AVERAGES
- 32. 0 20 40 60 80 100 2009-2010 2010-2011 2011-2012 RATIOS YEARS THAL LTD INDUSTRY AVERAGES 0 5 10 15 20 25 2009-2010 2010-2011 2011-2012 RATIOS YEARS A/C RECEIABLE TURN OVER RATIO THAL LTD INDUSTRY AVERAGES 0 5 10 15 20 25 30 35 2009-2010 2010-2011 2011-2012 RATIOS YEARS DAYS SALES IN RECEIABLE THAL LTD INDUSTRY AVERAGES 50 100 150 RATIOS ASSET TURNOVER RATIO THAL LTD
- 33. 0 0.02 0.04 0.06 0.08 0.1 0.12 0.14 2009-2010 2010-2011 2011-2012 RATIO YEARS PROFIT MARGIN THAL LTD INDUSTRY AVRAGES -50 0 50 2009-2010 2010-2011 2011-2012 RATIOS YEARS INDUSTRY AVERAGES 0 1 2 3 4 5 2009-2010 2010-2011 2011-2012 RATIOS YEARS FIXED ASSET TURNOVER RATIO THAL LTD INDUSTRY AVRAGES 0 0.5 1 1.5 2 2009-2010 2010-2011 2011-2012 RATIOS YEARS TOTAL ASSET TURNOVER RATIO THAL LTD INDUSTRY AVERAGE
- 34. YEARS 0 5 10 15 20 25 2009-2010 2010-2011 2011-2012 RATIO YEARS EEARNING PER SHARE THAL LTD INDUSTRY AVERAGS 0 0.05 0.1 0.15 0.2 0.25 0.3 0.35 0.4 2009-2010 2010-2011 2011-2012 RATIOS YEARS RETURN ON ASSETS THAL LTD INDUSTRY AVERAGES 0 0.05 0.1 0.15 0.2 0.25 2009-2010 2010-2011 2011-2012 RATIOS YEARS RETURN ON EQUITY THAL LTD INDUSTRY AVERAGES
- 35. 2009-2010 2010-2011 2011-2012 1.58 1.5 2.2 0.83 0.98 1.28 0.13 0.256 0.29 3.4 1.3 0.2 BALOCHISTAN WHEEL LIQUIDITY RATIOS 0.19 RATIOS 5.3 1.7 0.35 1.23 FINANCIAL STATEMENT ANALYSIS CURRENT RATIO = 3.67 CURRENT ASSETS CURRENT LIABILITIES INDUSTRY CALCULATIONS CURRENT ASSET-INVENTORY CURRENT LIABILITIES CASH CURRENT LIABILITIES CASH RATIO = INDUSTRY INDUSTRY QUICK RATIO =
- 36. 0.14 0.25 0.36 141.2 168 172 0.38 0.31 0.29 0.45 211.9 0.230.238 LONG TERM SOLVENCY RATIO TOTAL ASSET -TOTAL 0.45 198.59 0.65 220.5 0.17 CURRENT ASSETINTERVAL MEASURE = TOTAL ASSETS TOTAL DEBIT RATIO = AVERAGE DAILY OPERATING COST NET W.C TO ASSET RATIO = NET WORKING CAPITAL TOTAL ASSET INDUSTRY INDUSTRY INDUSTRY
- 37. 0.64 0.5 0.47 0.15 0.11 0.09 5.9 4.6 4.9 0.21 0.05 0.31 0.06 2.74 133.2 0.313 0.09 TOTAL EQUITY DEB TO EQTY RATIO = 2.76 132.25 2.42 150.8 LONG TERM DEBIT+ TOTAL EQUITY TOTAL DEBIT DAYS LONG TERM DEBT LONG TERM DEBIT ASSET MANAGEMENT OR TURN OVER RATIO COGS INVENTORY INDUSTRY INDUSTRY DAYS SALES IN INVETORY = INVEN TURN OVER RATIO = INDUSTRY
- 38. 78.02 96.29 96.8 14.4 14.8 13.8 29.3 25.9 26.9 -6.1 -37.48 14.26 2.5 33.49 2.96 133.2 10.9 3.13 RECEIVABLE TURN VOER PAYABLE TURNOVER RATIO 132.25 11.44 31.91 150.8 11.6 31.4 INENTORY TURNVOER DAYS IN SALES RECEVIABLE TURNOVER RATIO SALES ACC REC DAYS ASSET TURNOVER RATIO = SALES N.W.C INDUSTRY DAYS SALES IN INVETORY = A/CC REC TURNOVER RATIO = DAYS SALES IN RECEIVABLE = INDUSTRY INDUSTRY INDUSTRY
- 39. 1.88 2.8 3.3 1.42 1.28 1.46 0.05 0.056 0.07 4 1.4 0.07 3.6 1.3 0.06 SALES PROFIT MARGIN = PAYABLE TURNOVER RATIO 0.34 1.37 0.06 NET INCOME SALES NET FIXED ASSET TOTAL ASSET TURNOVER RATIO = SALES TOTAL ASSETS INDUSTRY INDUSTRY INDUSTRY FIXED ASSET TURNOVER =
- 40. 0.07 0.08 0.37 0.11 0.12 0.14 9.14 8.79 11.02 0.89 0.11 7.7 0.08 0.11 6.27 0.11 7.12 0.09 RETURN ON EQUITY = NET INCOME TOTAL EQUITY MARKET VALUE MEASURES NET INCOME SHARES OUT STANDING EPS = INDUSTRY NET INCOME TOTAL ASSETS RETURN ON ASSETS = INDUSTRY INDUSTRY
- 41. STAN WHEEL ATEMENT ANALYSIS GRAHPHICAL COMPARASION 0 1 2 3 4 5 6 2009-2010 2010-2011 2011-2012 RATIOS YEARS CURRENT RATIO BALOCHISTAN WHEEL INDUSTRY AVERAGES 0 0.5 1 1.5 2 2009-2010 2010-2011 2011-2012 RATIO YEARS QUICK RATIO BALOCHISTA N WHEEL INDUSTRY AVERAGES 0 0.05 0.1 0.15 0.2 0.25 0.3 0.35 0.4 2009-2010 2010-2011 2011-2012 RATIO YEARS CASH RATIO BALOCHISTAN WHEEL INDUSTRY AVERAGES
- 42. 0 0.05 0.1 0.15 0.2 0.25 0.3 0.35 0.4 2009-2010 2010-2011 2011-2012 RATIO YEARS TOTAL DEBIT RATIO BALOCHISTAN WHEEL INDUSTRY AVERAGES 0.6 0.7 DEBIT TO EQUITY RATIO 0 0.1 0.2 0.3 0.4 0.5 0.6 0.7 2009-2010 2010-2011 2011-2012 RATIOS YEARS NET WORKING CAPITAL TO ASSET RATIO BALOCHISTAN WHEEL INDUSTRY AVERAGES 0 50 100 150 200 250 2009-2010 2010-2011 2011-2012 RATIOS YEARS INTERVAIL MAEASURE BALOCHISTAN WHEEL INDUSTRY AVERAGES
- 43. 0 0.1 0.2 0.3 0.4 0.5 0.6 0.7 2009-2010 2010-2011 2011-2012 RATIO YEARS BALOCHISTAN WHEEL INDUSTRY AVERAGES 0 1 2 3 4 5 6 7 2009-2010 2010-2011 2011-2012 RATIO YEARS INV TURN OVER RATIO BALOCHISTAN WHEEL INDUSTRY AVERAGES 0 0.02 0.04 0.06 0.08 0.1 0.12 0.14 0.16 2009-2010 2010-2011 2011-2012 RATIOS YEARS LONG TERM DEBIT RATIO BALOCHISTAN WHEEL INDUSTRY AVERAGES 80 100 120 140 160 RATIOS DAYS SALES IN INVENTORY BALOCHISTAN WHEEL
- 44. 0 20 40 60 80 100 2009-2010 2010-2011 2011-2012 RATIOS YEARS BALOCHISTAN WHEEL INDUSTRY AVERAGES 0 2 4 6 8 10 12 14 16 2009-2010 2010-2011 2011-2012 RATIOS YEARS A/C RECEIABLE TURN OVER RATIO BALOCHISTAN AVERAGES INDUSTRY AVERAGES 0 5 10 15 20 25 30 35 40 2009-2010 2010-2011 2011-2012 RATIOS YEARS DAYS SALES IN RECEIABLE BALOCHISTAN WHEEL INDUSTRY AVERAGES -50 -40 -30 -20 -10 0 10 20 2009-2010 2010-2011 2011-2012 RATIOS YEARS ASSET TURNOVER RATIO BALOCHISTAN WHEEL INDUSTRY AVERAGES
- 45. 0 0.01 0.02 0.03 0.04 0.05 0.06 0.07 0.08 2009-2010 2010-2011 2011-2012 RATIO YEARS PROFIT MARGIN BALOCHISTAN WHEEL INDUSTRY AVERAGES YEARS 0 1 2 3 4 5 2009-2010 2010-2011 2011-2012 RATIOS YEARS FIXED ASSET TURNOVER RATIO BALOCHISTAN WHEEL INDUSTRY AVERAGES 1.15 1.2 1.25 1.3 1.35 1.4 1.45 1.5 2009-2010 2010-2011 2011-2012 RATIOS YEARS TOTAL ASSET TURNOVER RATIO BALOCHISTAN WHEEL INDUSTRY AVERAGES
- 46. 0 2 4 6 8 10 12 2009-2010 2010-2011 2011-2012 RATIO YEARS EEARNING PER SHARE BALOCHISTAN WHEEL INDUSTRY AVERAGES 0 0.2 0.4 0.6 0.8 1 2009-2010 2010-2011 2011-2012 RATIOS YEARS RETURN ON ASSETS BALOCHISTAN WHEEL INDUSTRY AVERAGES 0 0.02 0.04 0.06 0.08 0.1 0.12 0.14 0.16 2009-2010 2010-2011 2011-2012 RATIOS YEARS RETURN ON EQUITY BALOCHISTAN WHEEL INDUSTRY AVERAGES