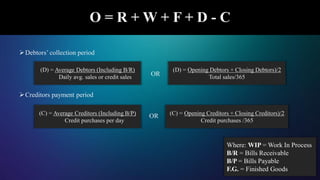
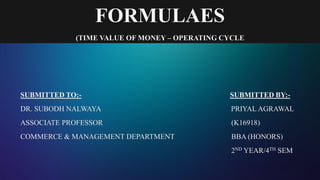
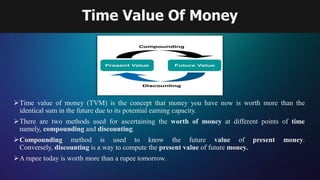
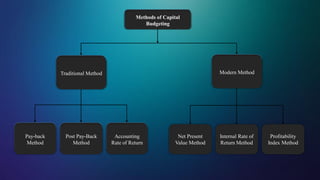
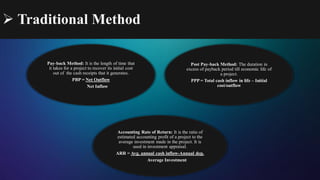
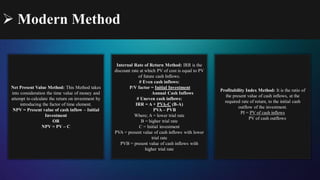
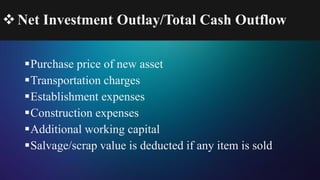
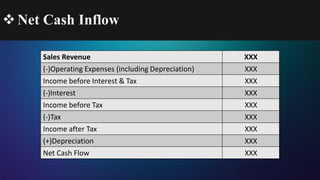
The document discusses various time value of money concepts such as compounding, discounting, and the time value principle that money today is worth more than money in the future. It also provides formulas for calculating future and present value of single and annuity cash flows. The document then discusses capital budgeting methods like payback period, accounting rate of return, net present value, internal rate of return, and profitability index. It also discusses working capital, its estimation using the operating cycle method, and financial leverage analysis.


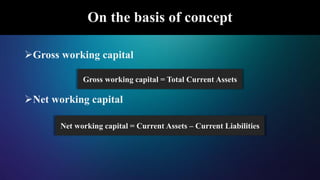
![Time Value Of Money
Present Value Future Value
Future value of single
present cash flow
FV=PV(1+r)n
Future Value of series
of equal cash flow:
Ordinary Annuity
FVA=A[(1+r)n-1]/r
Future value of series
of equal cash flow:
Annuity Due
FVA= A[(1+r)n-1/r]*
(1+r)
Future Value of series
of unequal cash flow:
Compute it
individually by
compounding each
years annuity
Where;
FV- Future Value
PV- Present Value
A- Annuity
r- Rate of interest
n- time period](https://image.slidesharecdn.com/priyalagrawalfm-201012061626/85/Financial-Management-4-320.jpg)
![Time Value Of Money
Future Value Present Value
Present Value of single
present cash flow:
PV=FV/(1+r)n
Also known as discounting factor
Present Value of series
of equal cash flow:
Ordinary Annuity
Annuity=FVA*r/[(1+r)
n-1]
Present Value of series
of equal cash flow:
Annuity Due
Annuity=
FVA*r/[(1+r)n-1]*(1+r)
Present value of series
of unequal cash flow:
Compute it
individually
considering &
compounding each
year’s interest rate
respectively.
Where;
PV- present
value
A- Annuity
r- Rate of interest
n- time period](https://image.slidesharecdn.com/priyalagrawalfm-201012061626/85/Financial-Management-5-320.jpg)

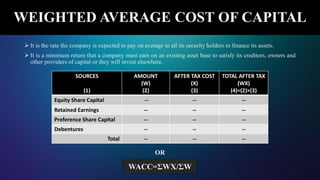
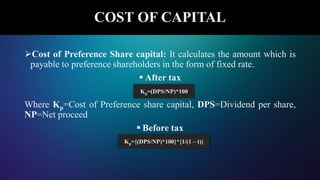
![COST OF CAPITAL
Cost of debt capital: It is an integral part of the discounted valuation
analysis which calculates the present value of a firm by discounting future
cash flows by the expected rate of return to its equity and debt holders.
Cost of Irredeemable debt
Where I=Annual interest charges, NP=Net proceeds, Kd=Cost of debt
Cost of Redeemable debt
Where RV=Redeemable value of debt at the time of maturity, n=No. of
years to maturity
Kd=(I/NP)*100
Kd=[{I+(RV-NP/n)}/{RV+NP/2}]*100](https://image.slidesharecdn.com/priyalagrawalfm-201012061626/85/Financial-Management-16-320.jpg)
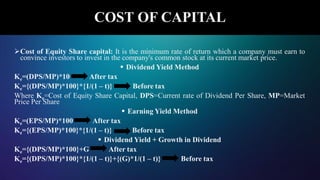
![Cost of Retained Earning: The amount of undistributed profits which is
available for investment is called Retained Earning.
Where Kr=Cost of retained earning, D=Dividend which would be
distributed as an alternative of retained earning, Ti=Income tax rate of
individual shareholder, B=Brokerage payable on investment of dividend
received, Tc=Capital gain tax rate applicable to individual shareholder,
MP=Market price per share
# If the shareholder does not have to pay tax on capital profit & income,
then:
COST OF CAPITAL
Kr=[{D(1-B)}/MP]*100
Kr={D*(1-Ti)*(1-B)}/{MP(1-Tc)}*100](https://image.slidesharecdn.com/priyalagrawalfm-201012061626/85/Financial-Management-19-320.jpg)