The document explains how to calculate Internal Rate of Return (IRR) and Net Present Value (NPV) using Microsoft Excel functions, detailing their syntax and parameters. It highlights essential considerations in capital budgeting, such as cash flows versus accounting profits, financing costs, working capital, and cash flow estimation methods. Additionally, real-world examples, including a case study on Speedo's LZR-2 swimsuit project, illustrate these concepts in a practical context.
![Compute IRR and NPV in Microsoft Excel
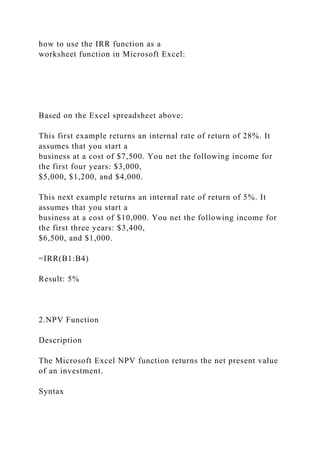
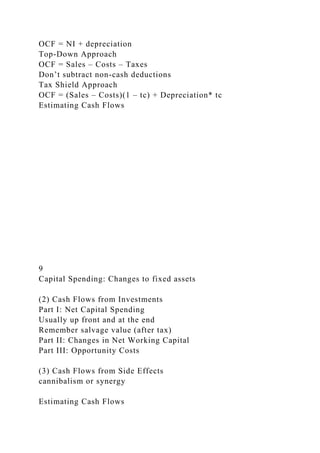
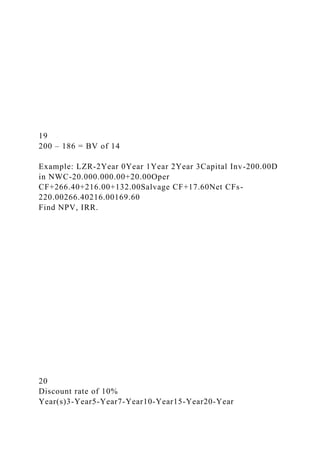
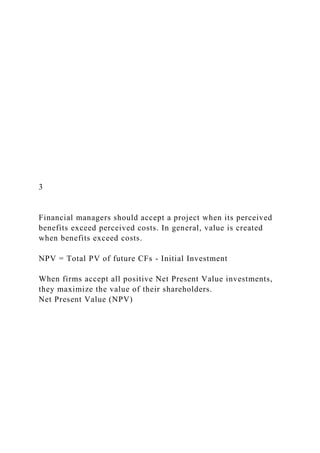
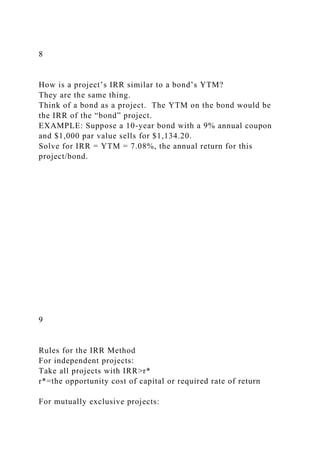
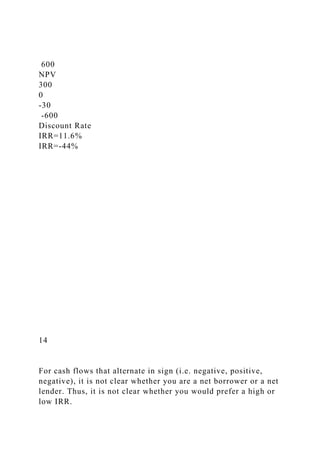
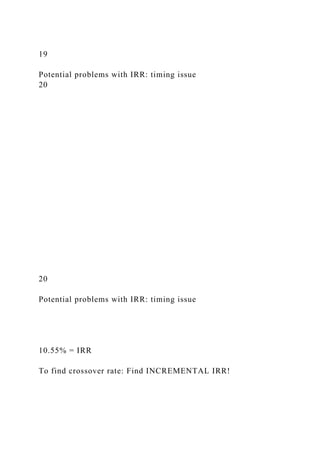
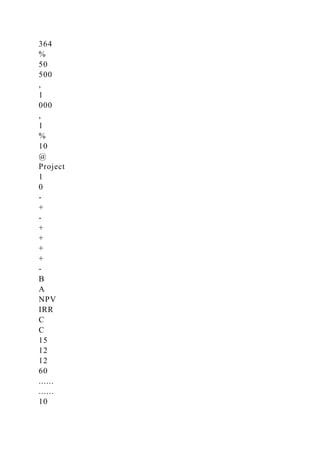
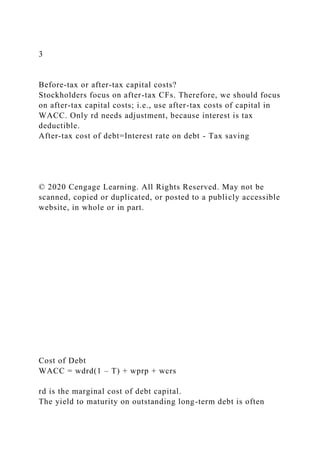
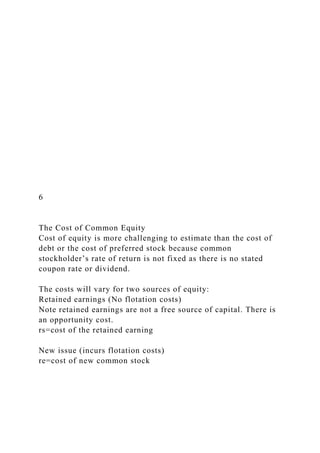
1.IRR Function
Description:
The Microsoft Excel IRR function returns the internal rate of
return for a series of cash flows. The cash
flows must occur at regular intervals, but do not have to be the
same amounts for each interval.
Syntax
The syntax for the IRR function in Microsoft Excel is:
IRR(range, [estimated_irr] )
Parameters or Arguments
range
A range of cells that represent the series of cash flows.
estimated_irr
Optional. It is your guess at the internal rate of return. If this
parameter is omitted, it
assumes an estimated_irr of 0.1 or 10%
Example (as Worksheet Function)
Let's look at some Excel IRR function examples and explore](https://image.slidesharecdn.com/computeirrandnpvinmicrosoftexcel1-221028224510-3822b722/85/Compute-IRR-and-NPV-in-Microsoft-Excel-1-IRR-Function-docx-1-320.jpg)
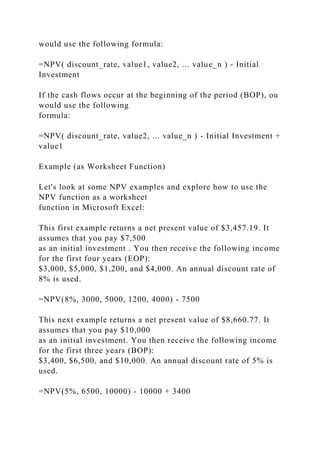
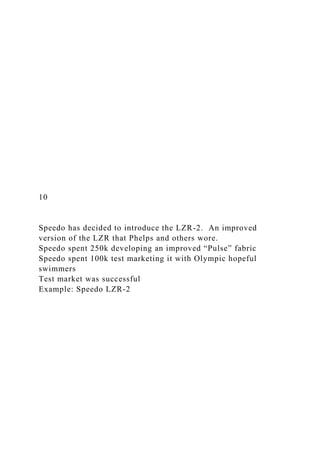
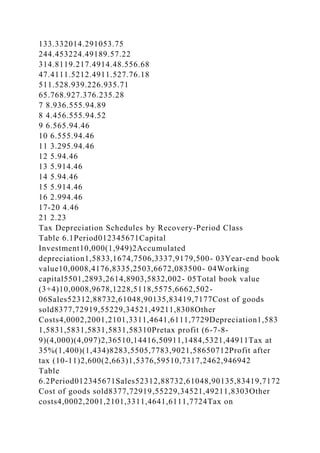
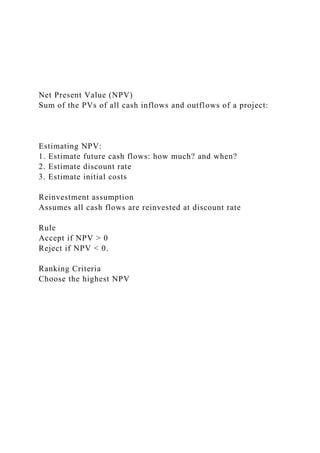
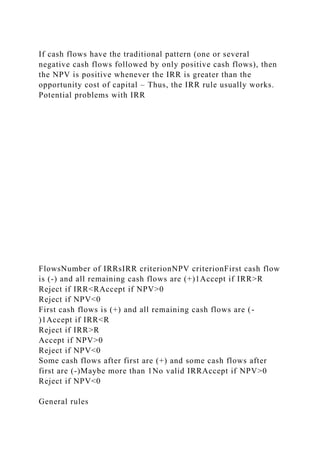
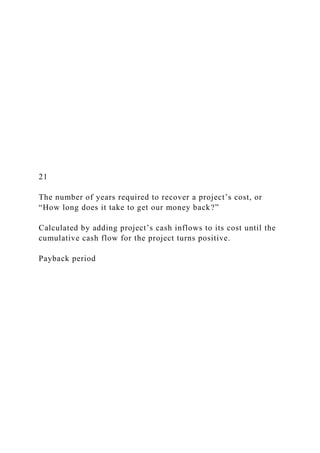
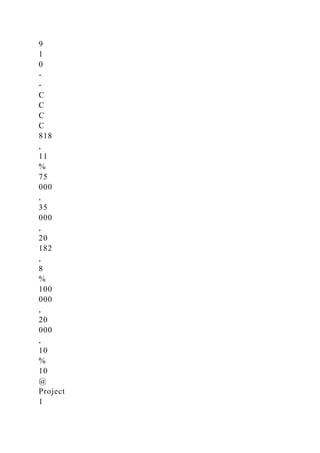
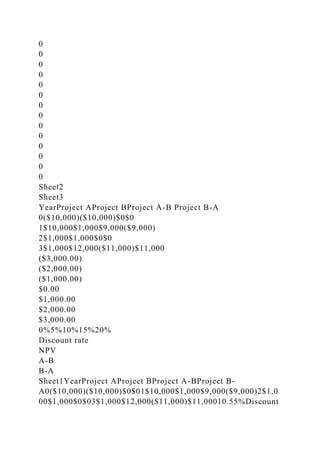
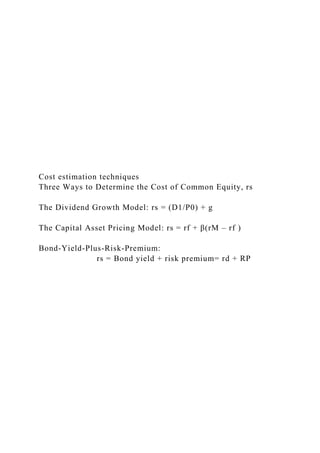
![The syntax for the NPV function in Microsoft Excel is:
NPV( discount_rate, value1, [value2, ... value_n] )
Parameters or Arguments
discount_rate
The discount rate for the period.
value1, value2, ... value_n
The future payments and income for the investment (ie: cash
flows). There can be up
to 29 values entered.
Note
Microsoft Excel's NPV function does not account for the intial
cash outlay, or may account for
it improperly depending on the version of Excel. However, there
is a workaround.
This workaround requires that you NOT include the initial
investment in the future
payments/income for the investment (ie: value1, value2, ...
value_n), but instead, you need to
subtract from the result of the NPV function, the amount of the
initial investment.
The workaround formula is also different depending on whether
the cash flows occur at the
end of the period (EOP) or at the beginning of the period
(BOP).
If the cash flows occur at the end of the period (EOP), you](https://image.slidesharecdn.com/computeirrandnpvinmicrosoftexcel1-221028224510-3822b722/85/Compute-IRR-and-NPV-in-Microsoft-Excel-1-IRR-Function-docx-3-320.jpg)


![1. Payback Period and Net Present Value[LO1, 2] If a project with .docx](https://cdn.slidesharecdn.com/ss_thumbnails/1-221101035238-1d86b81e-thumbnail.jpg?width=640&height=640&fit=bounds)


