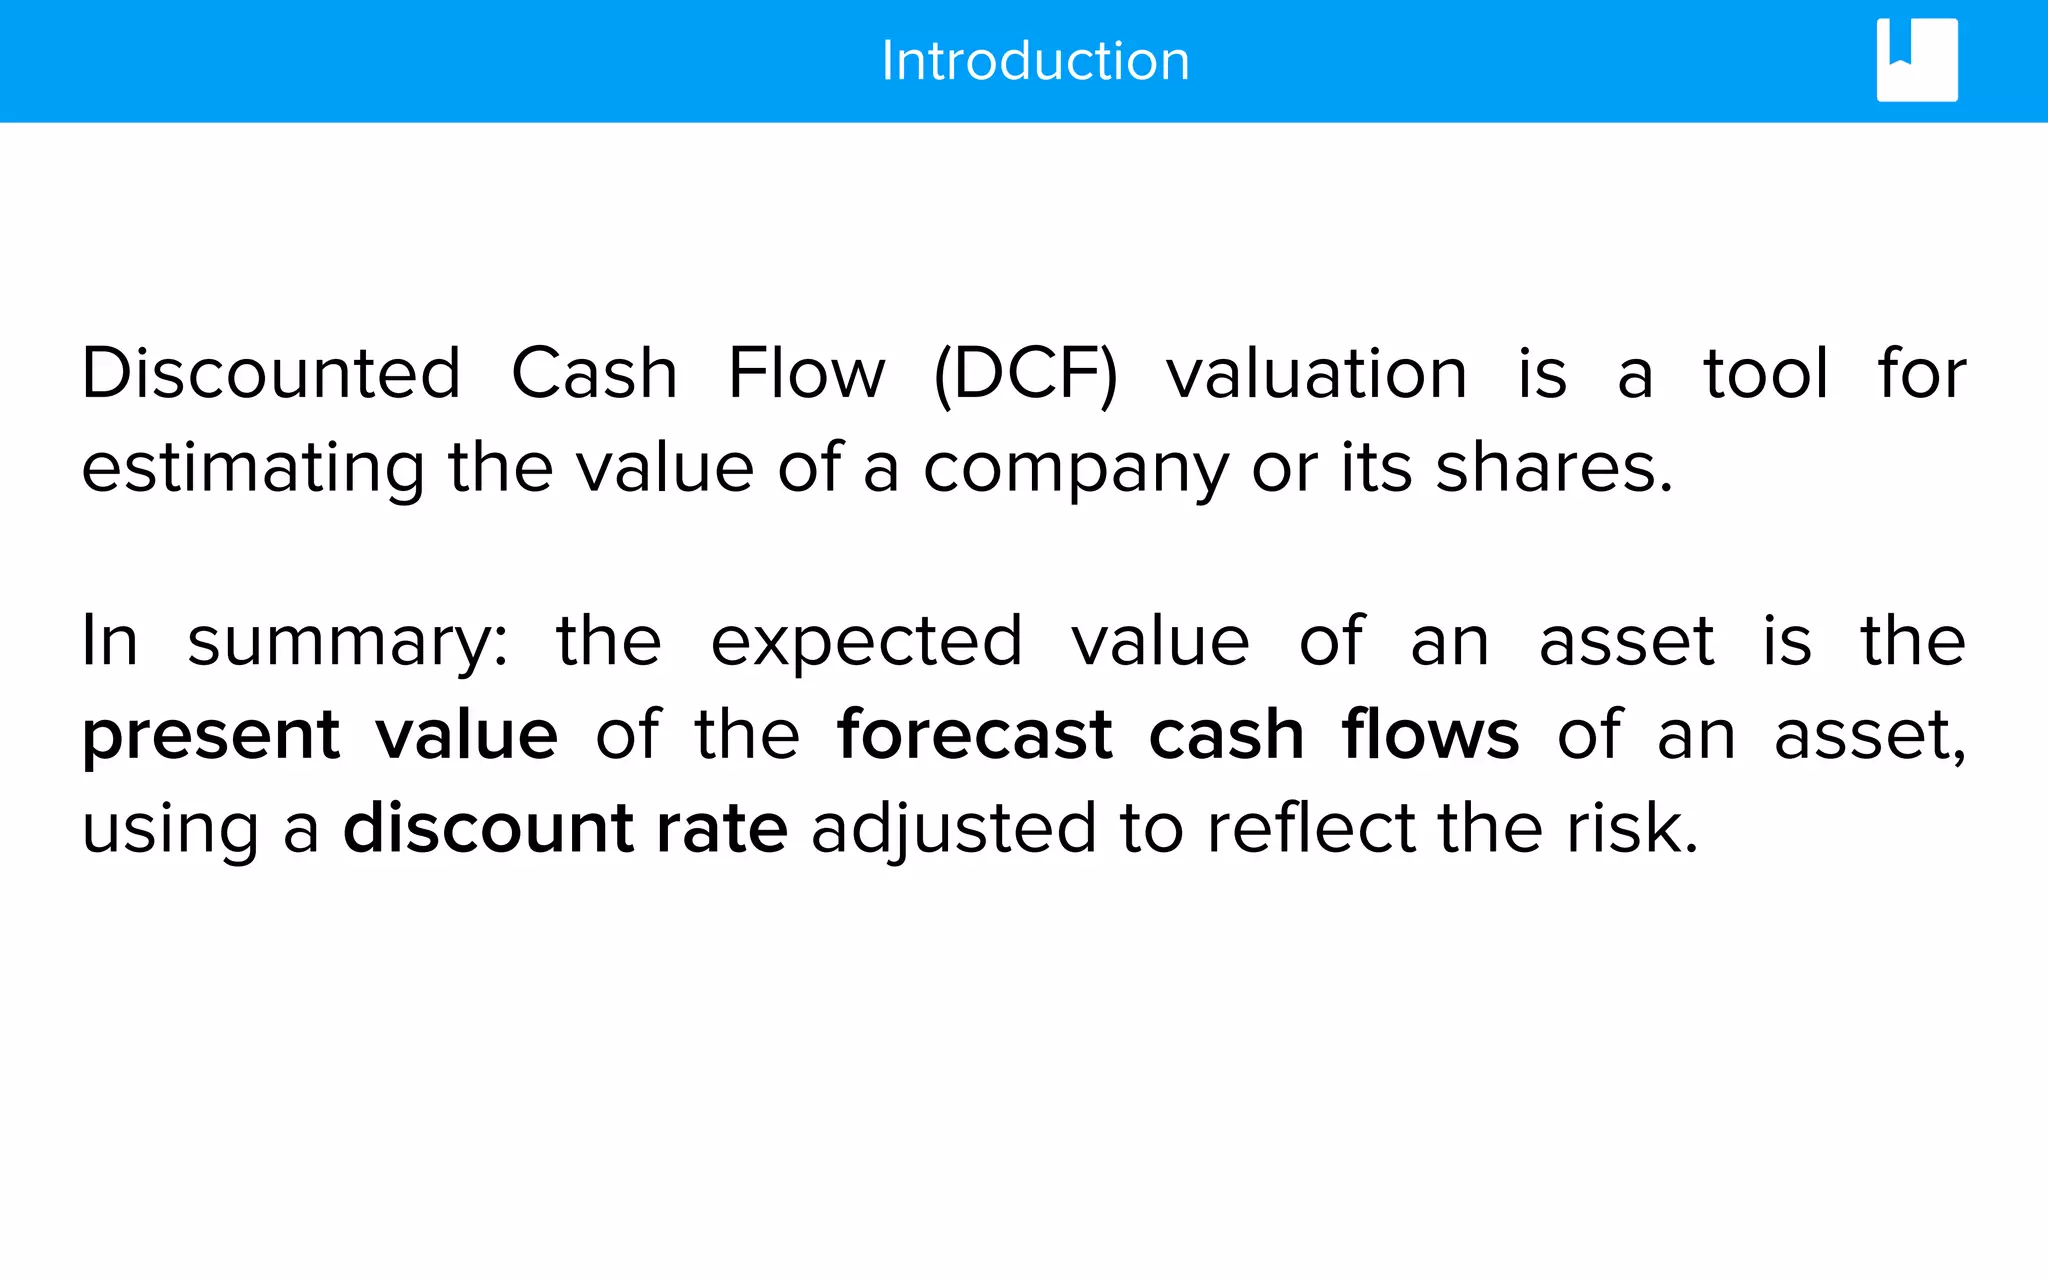
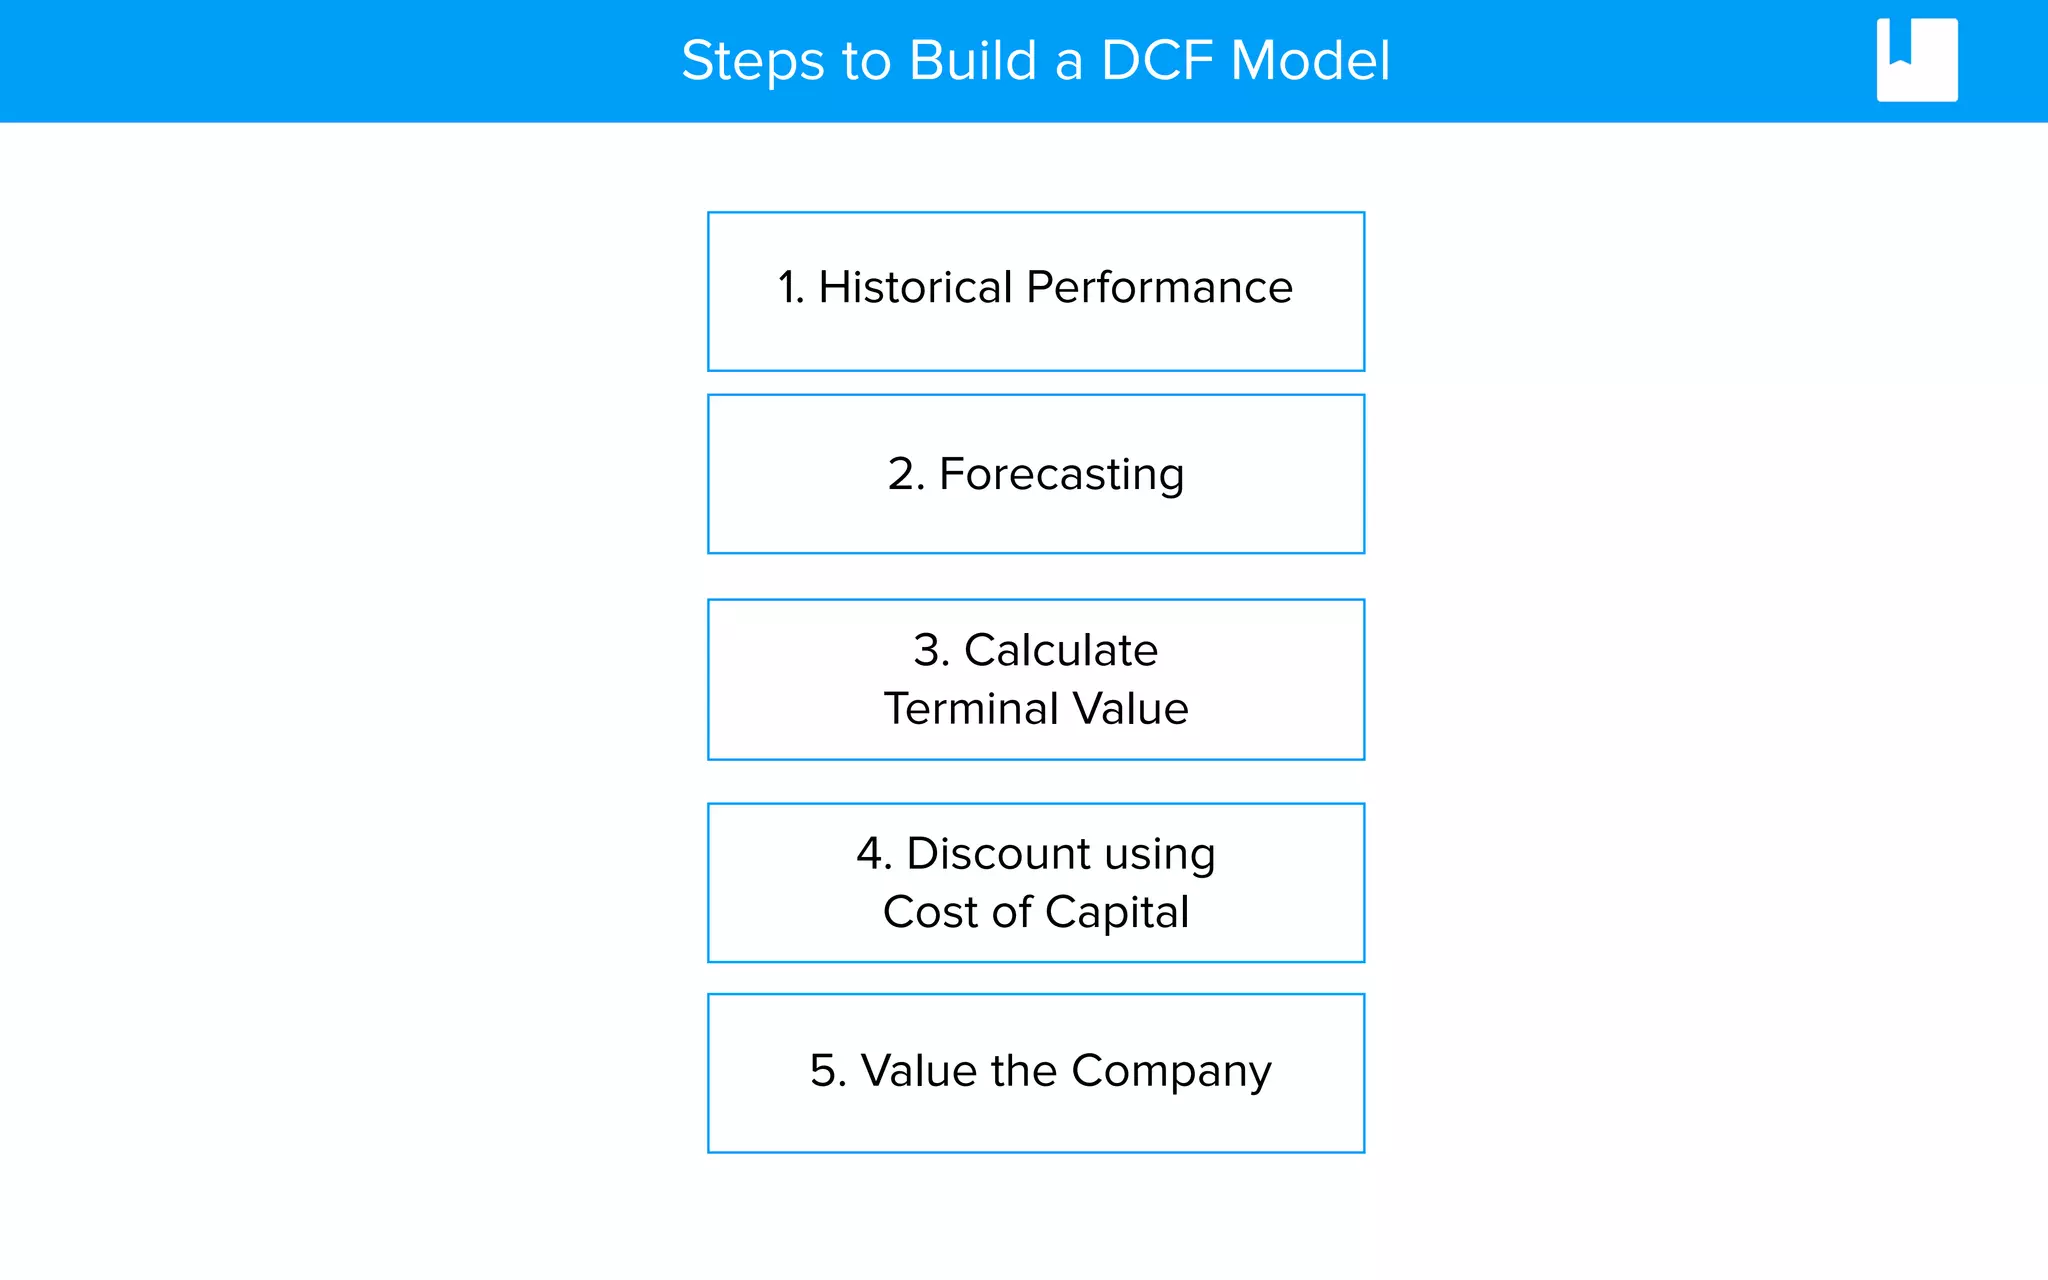
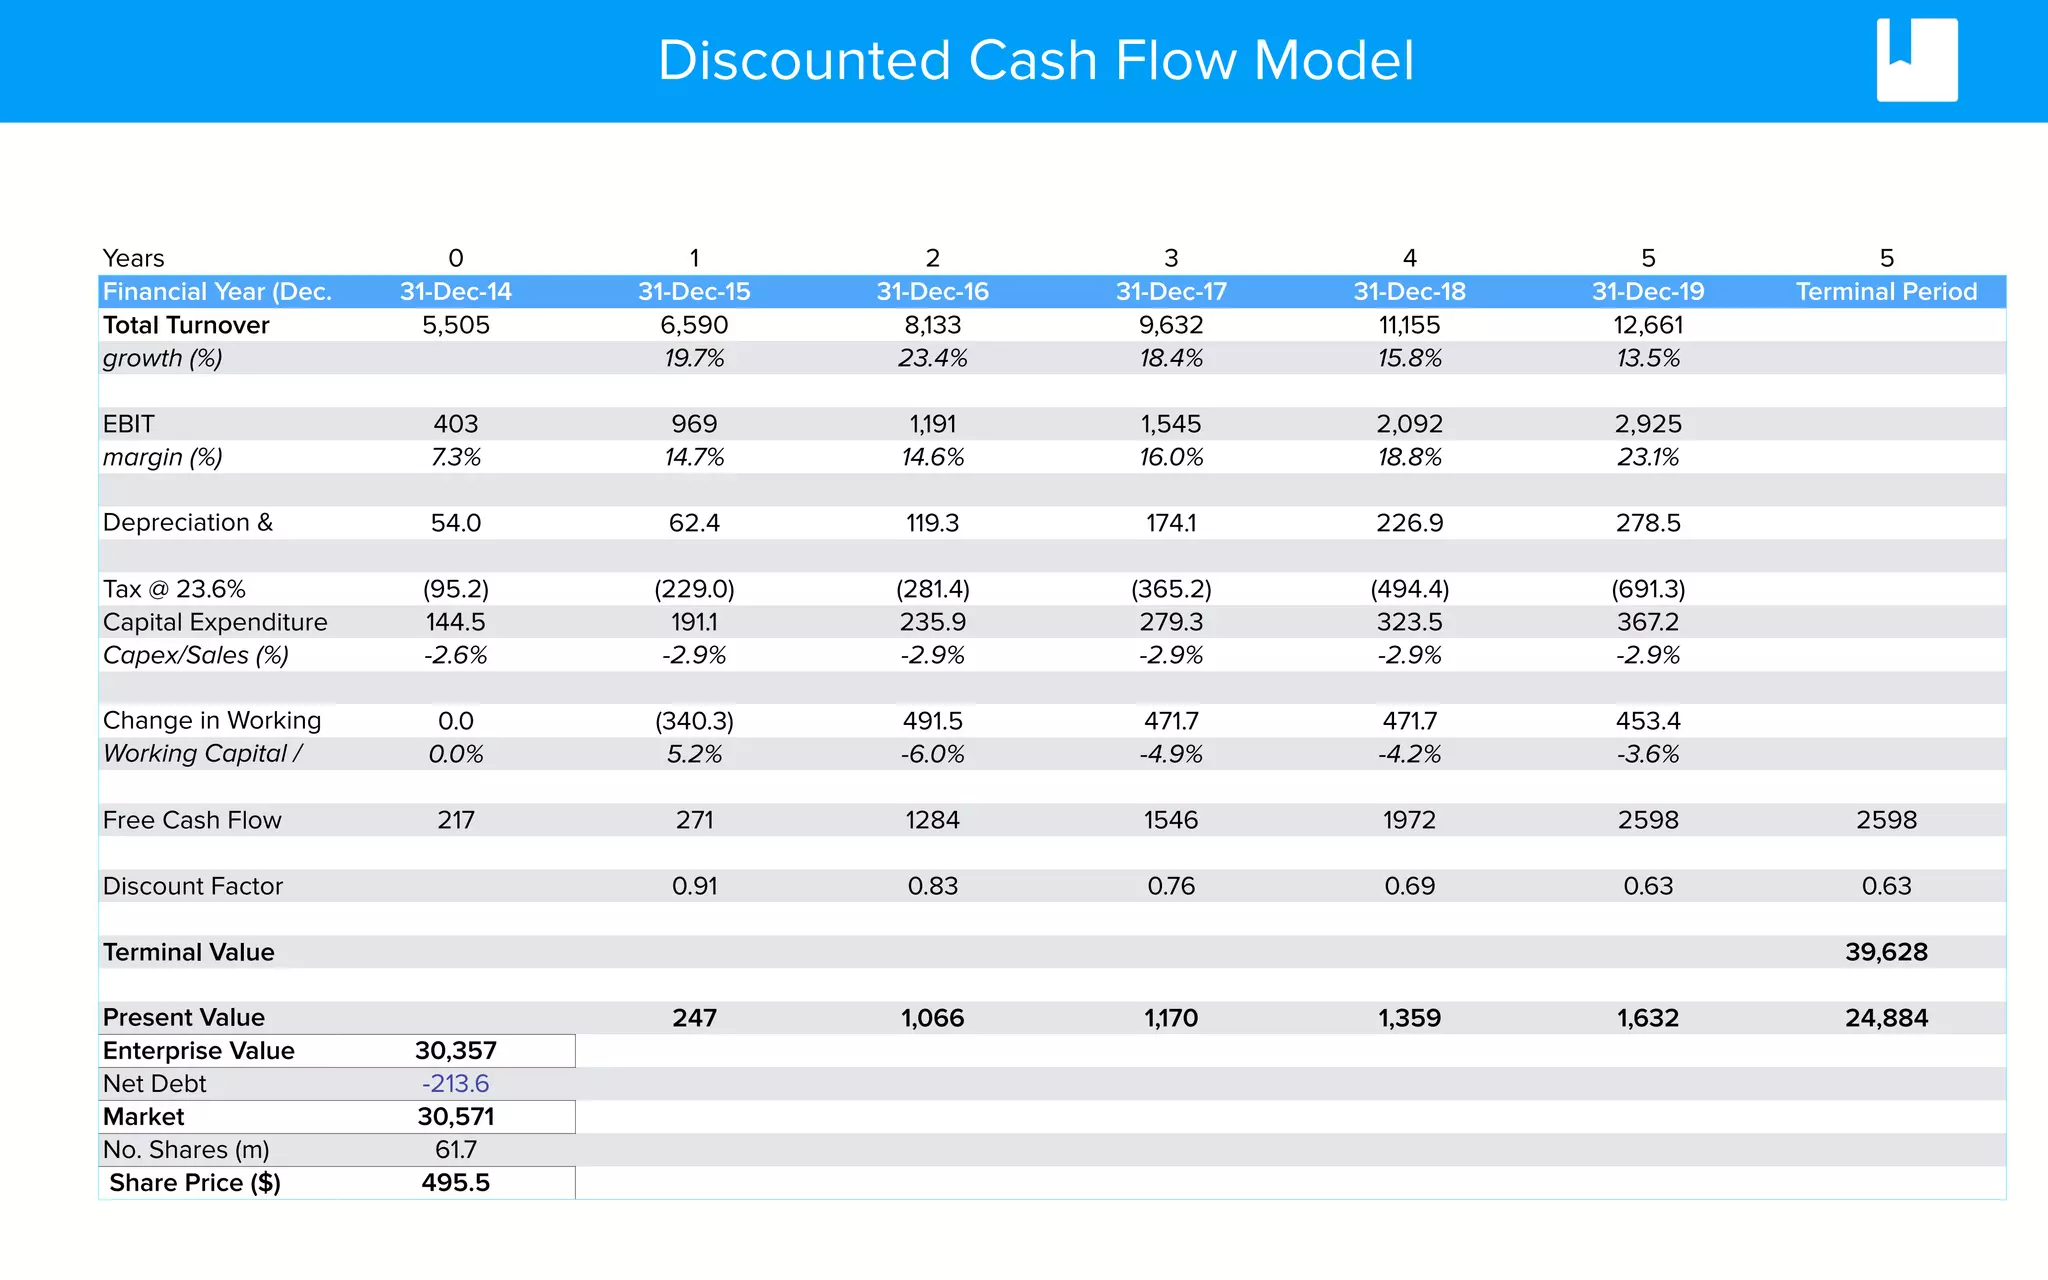
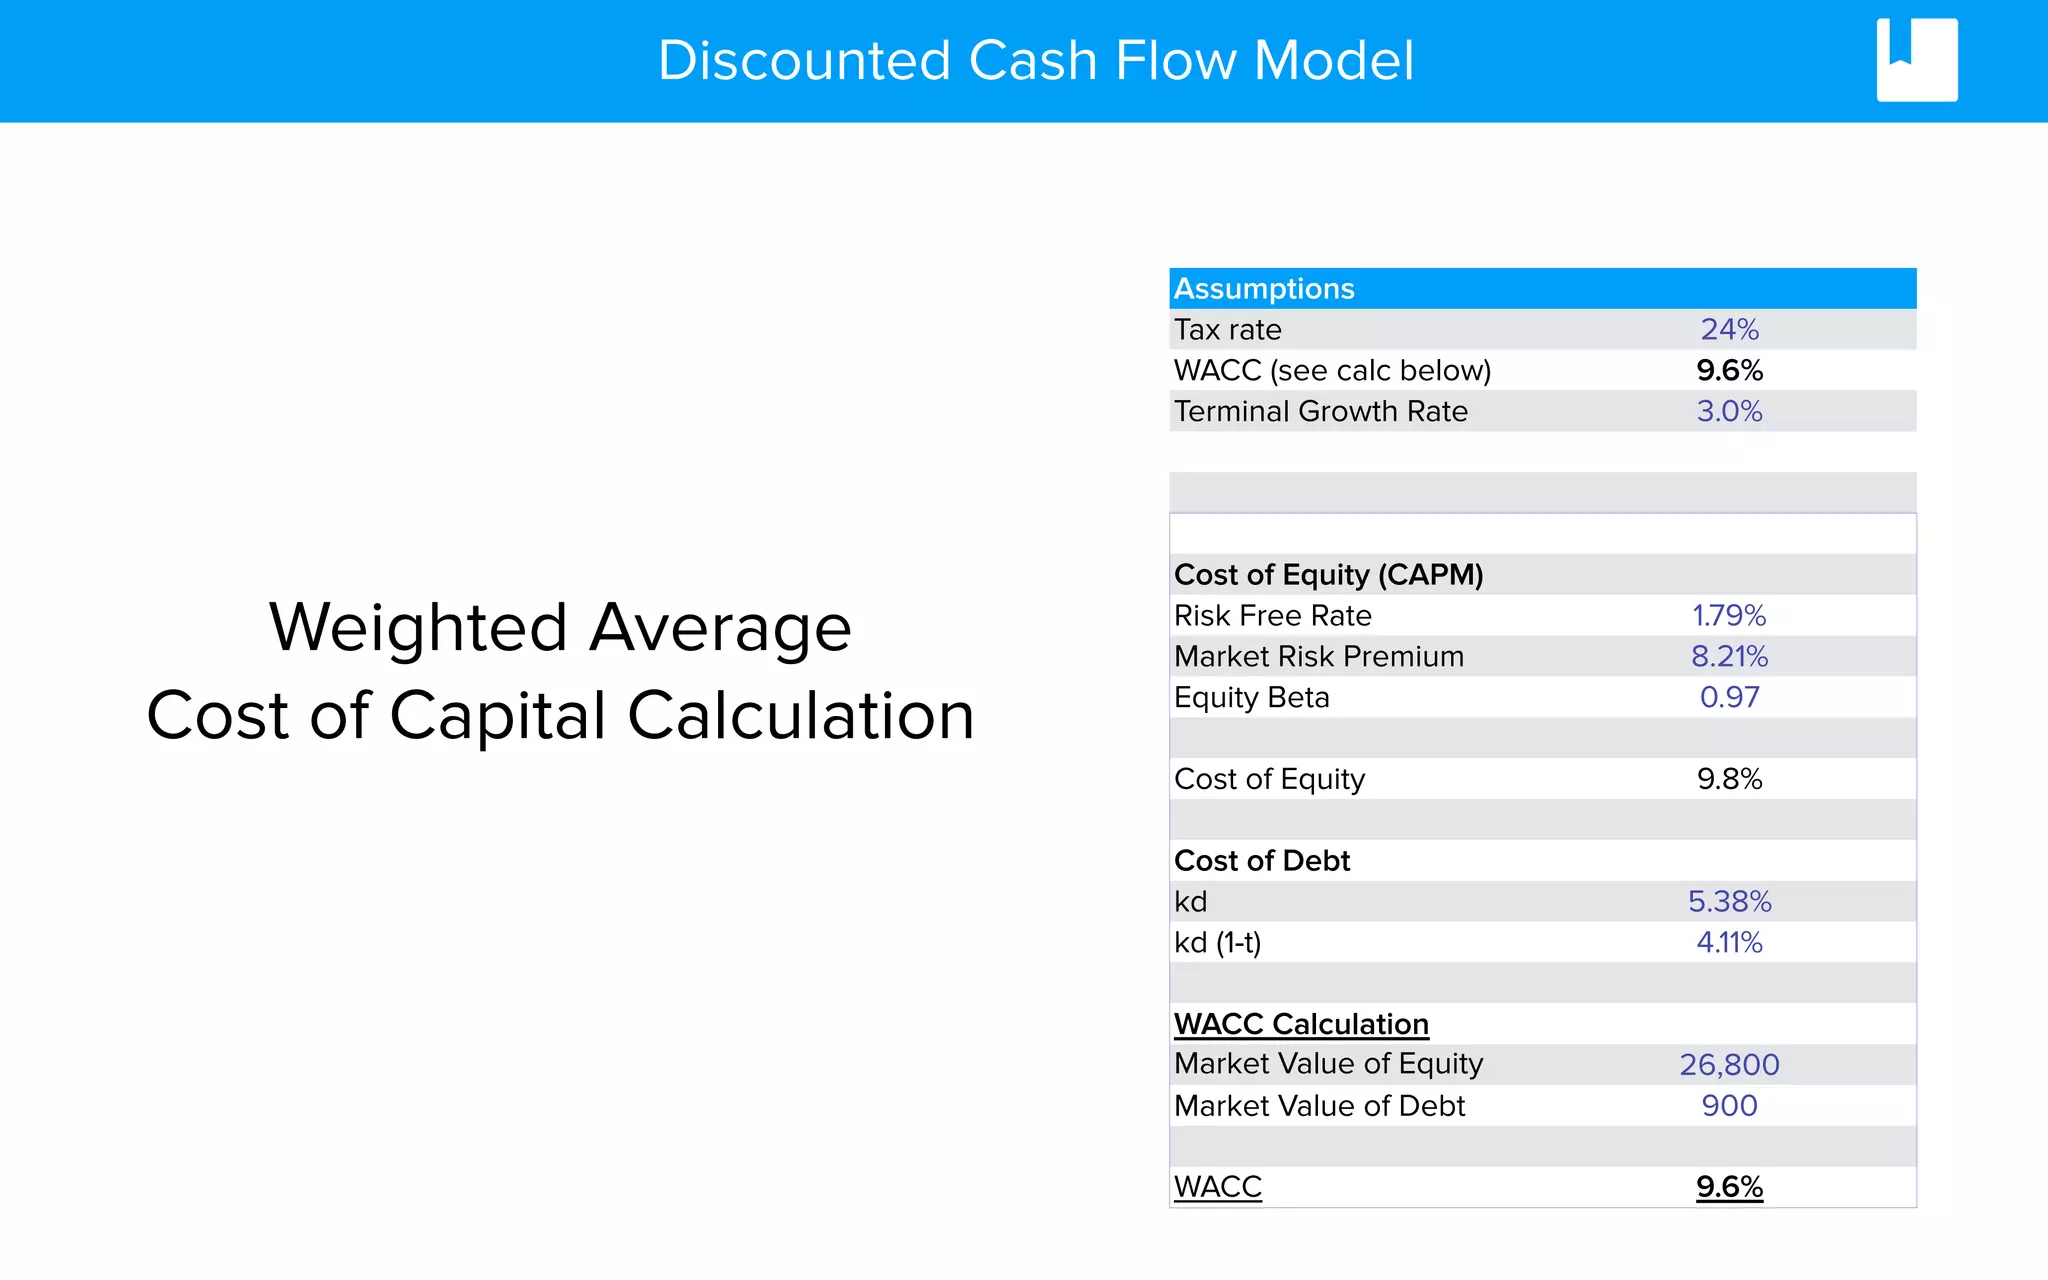
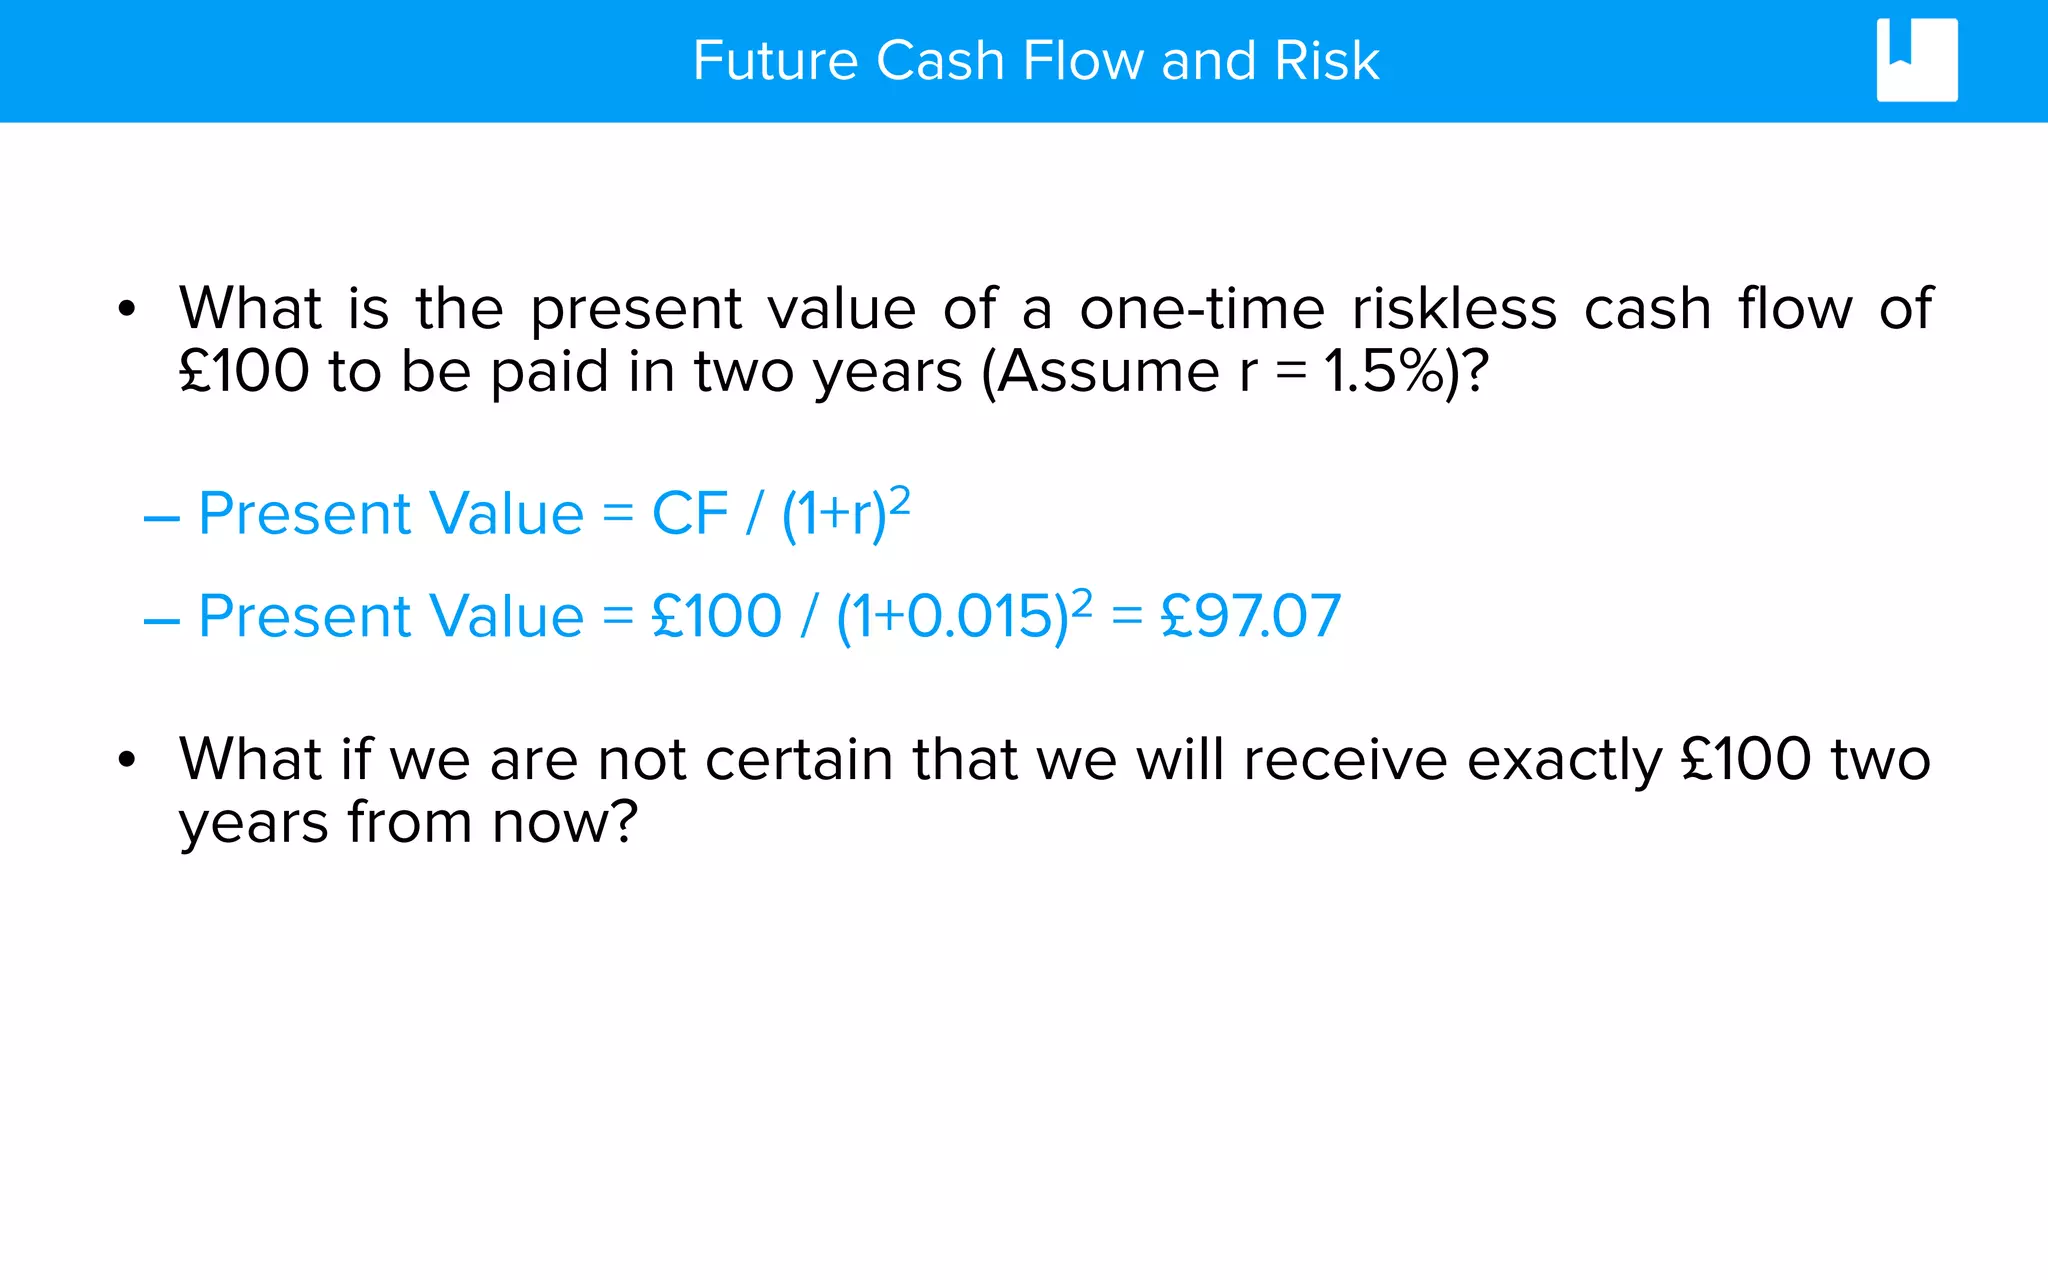
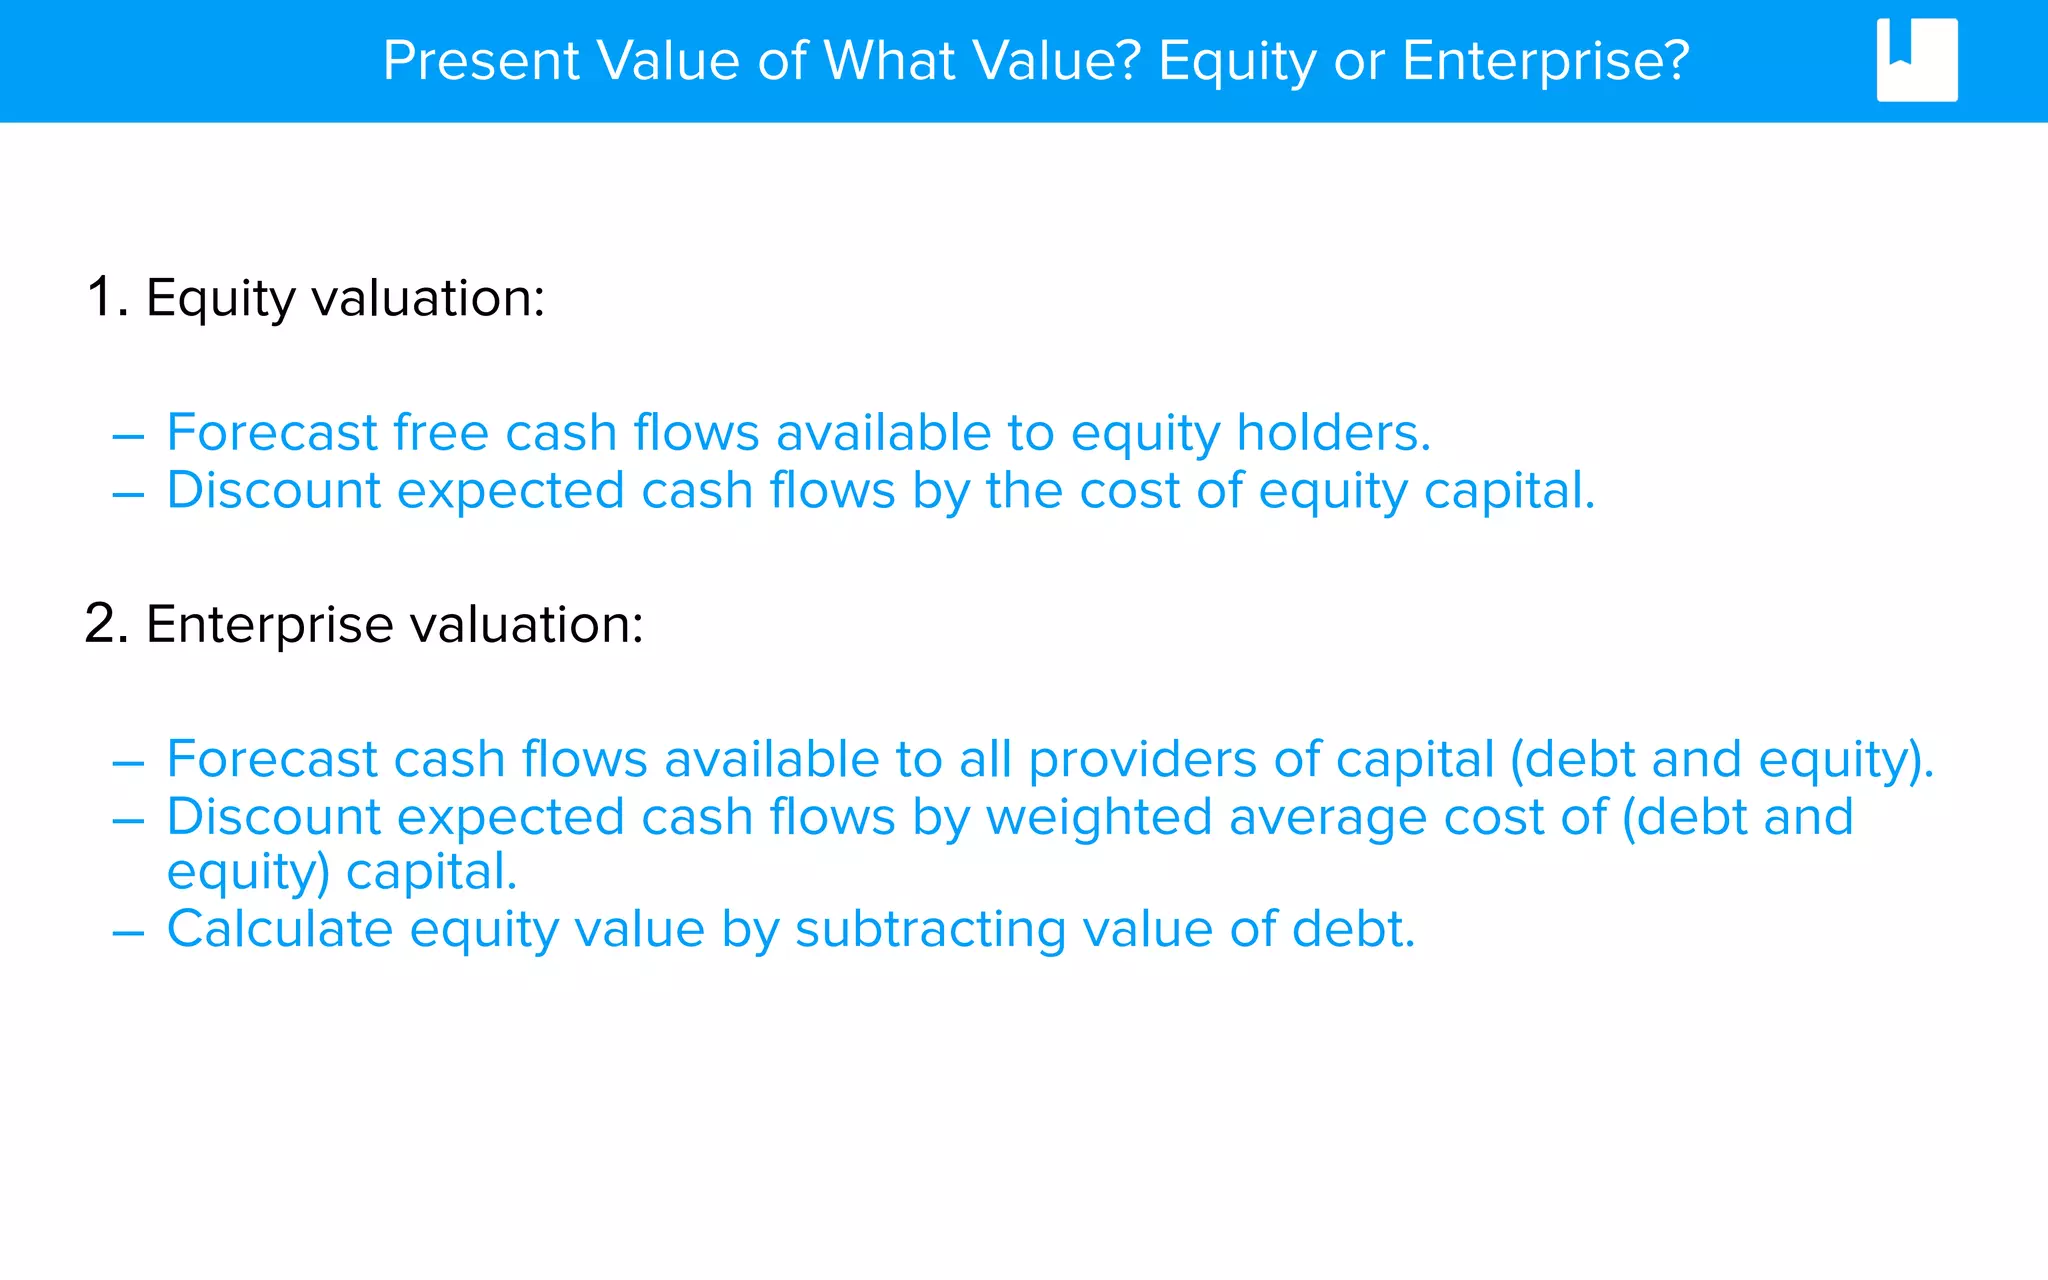
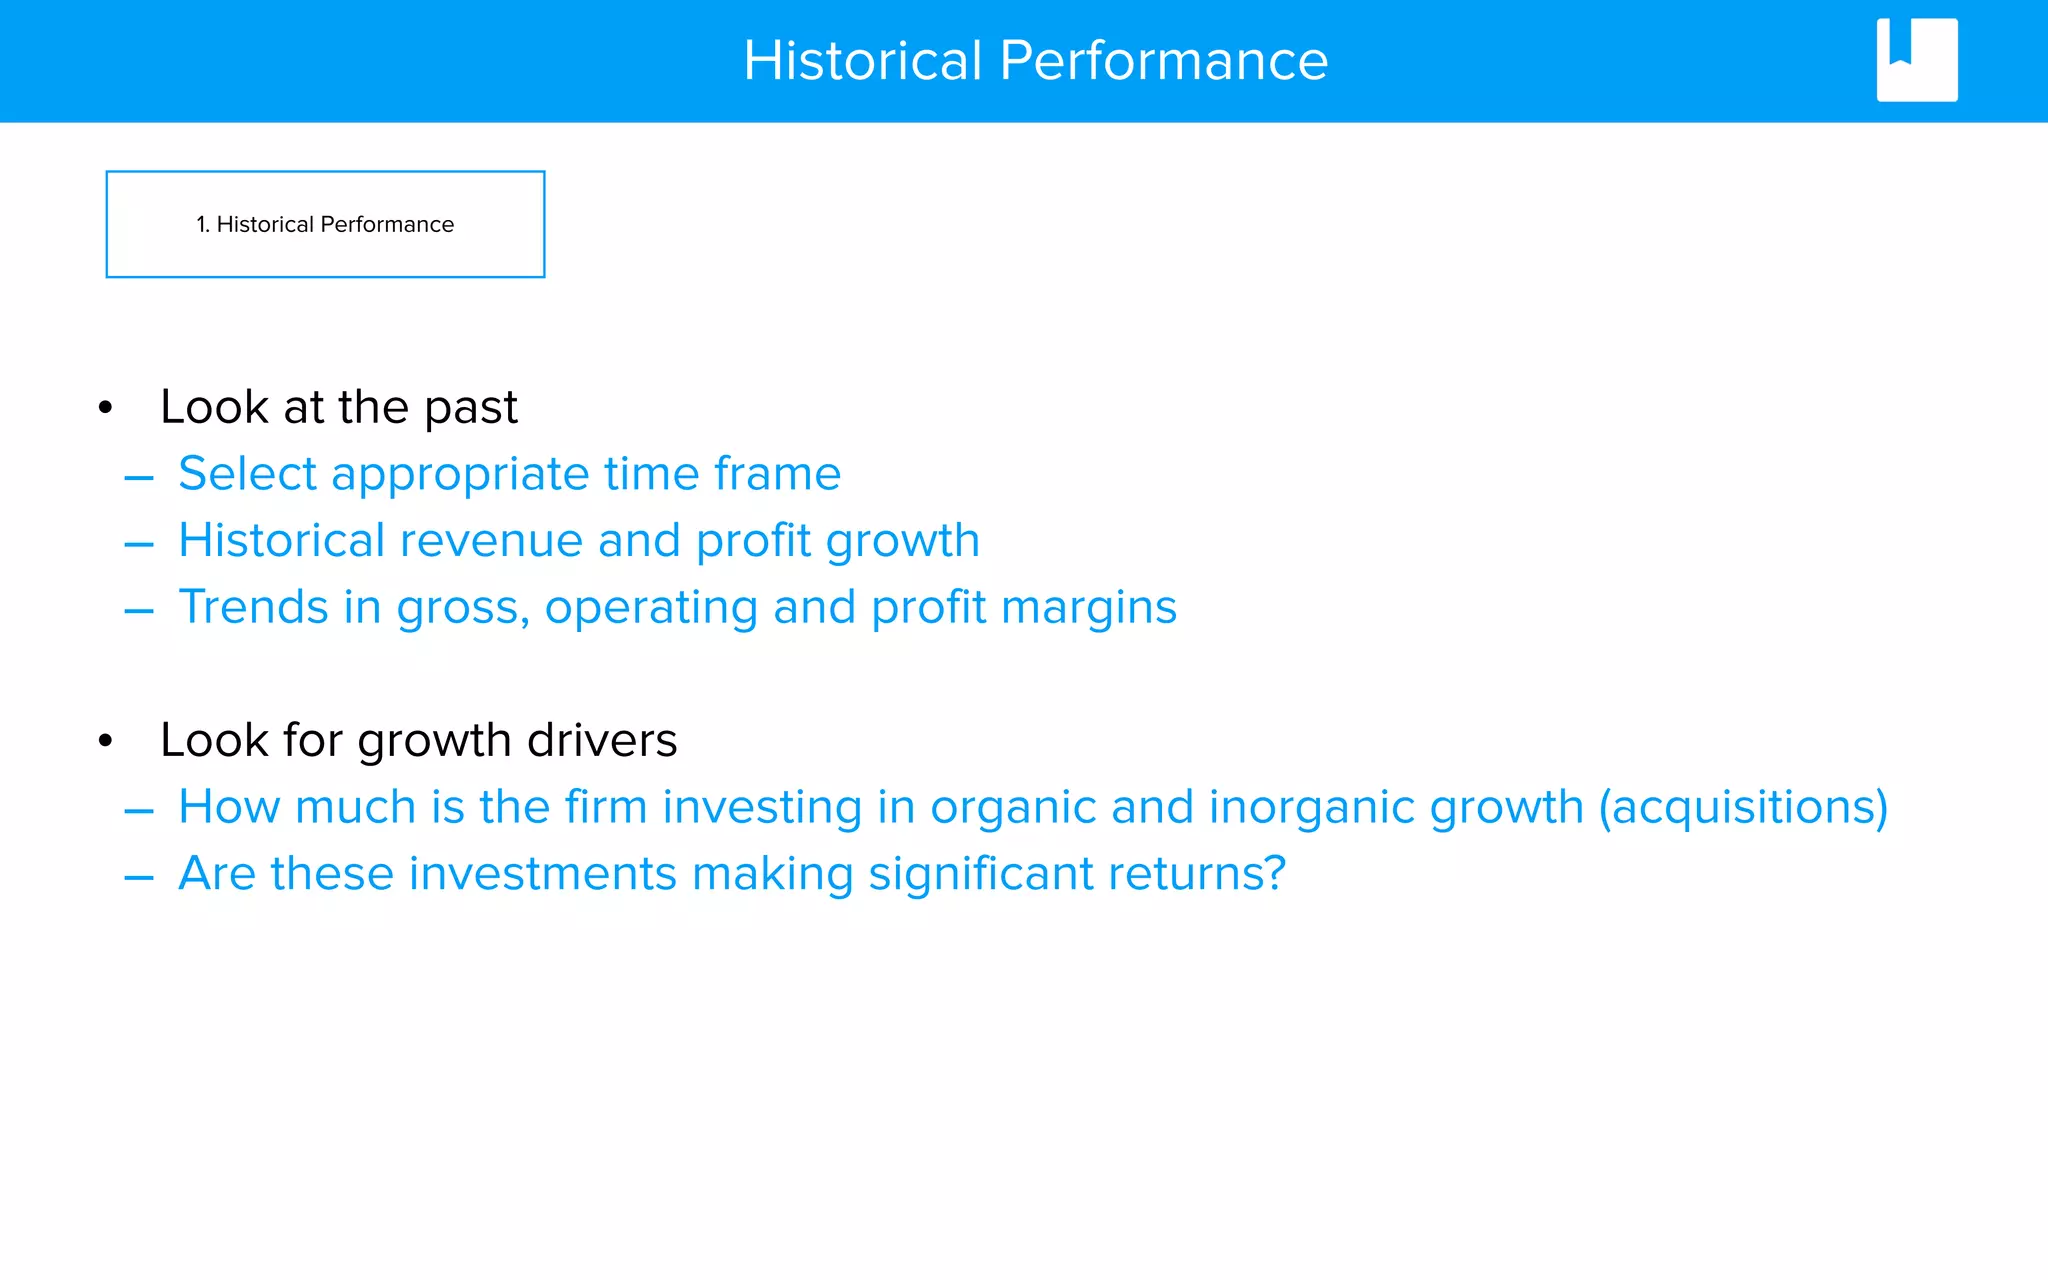
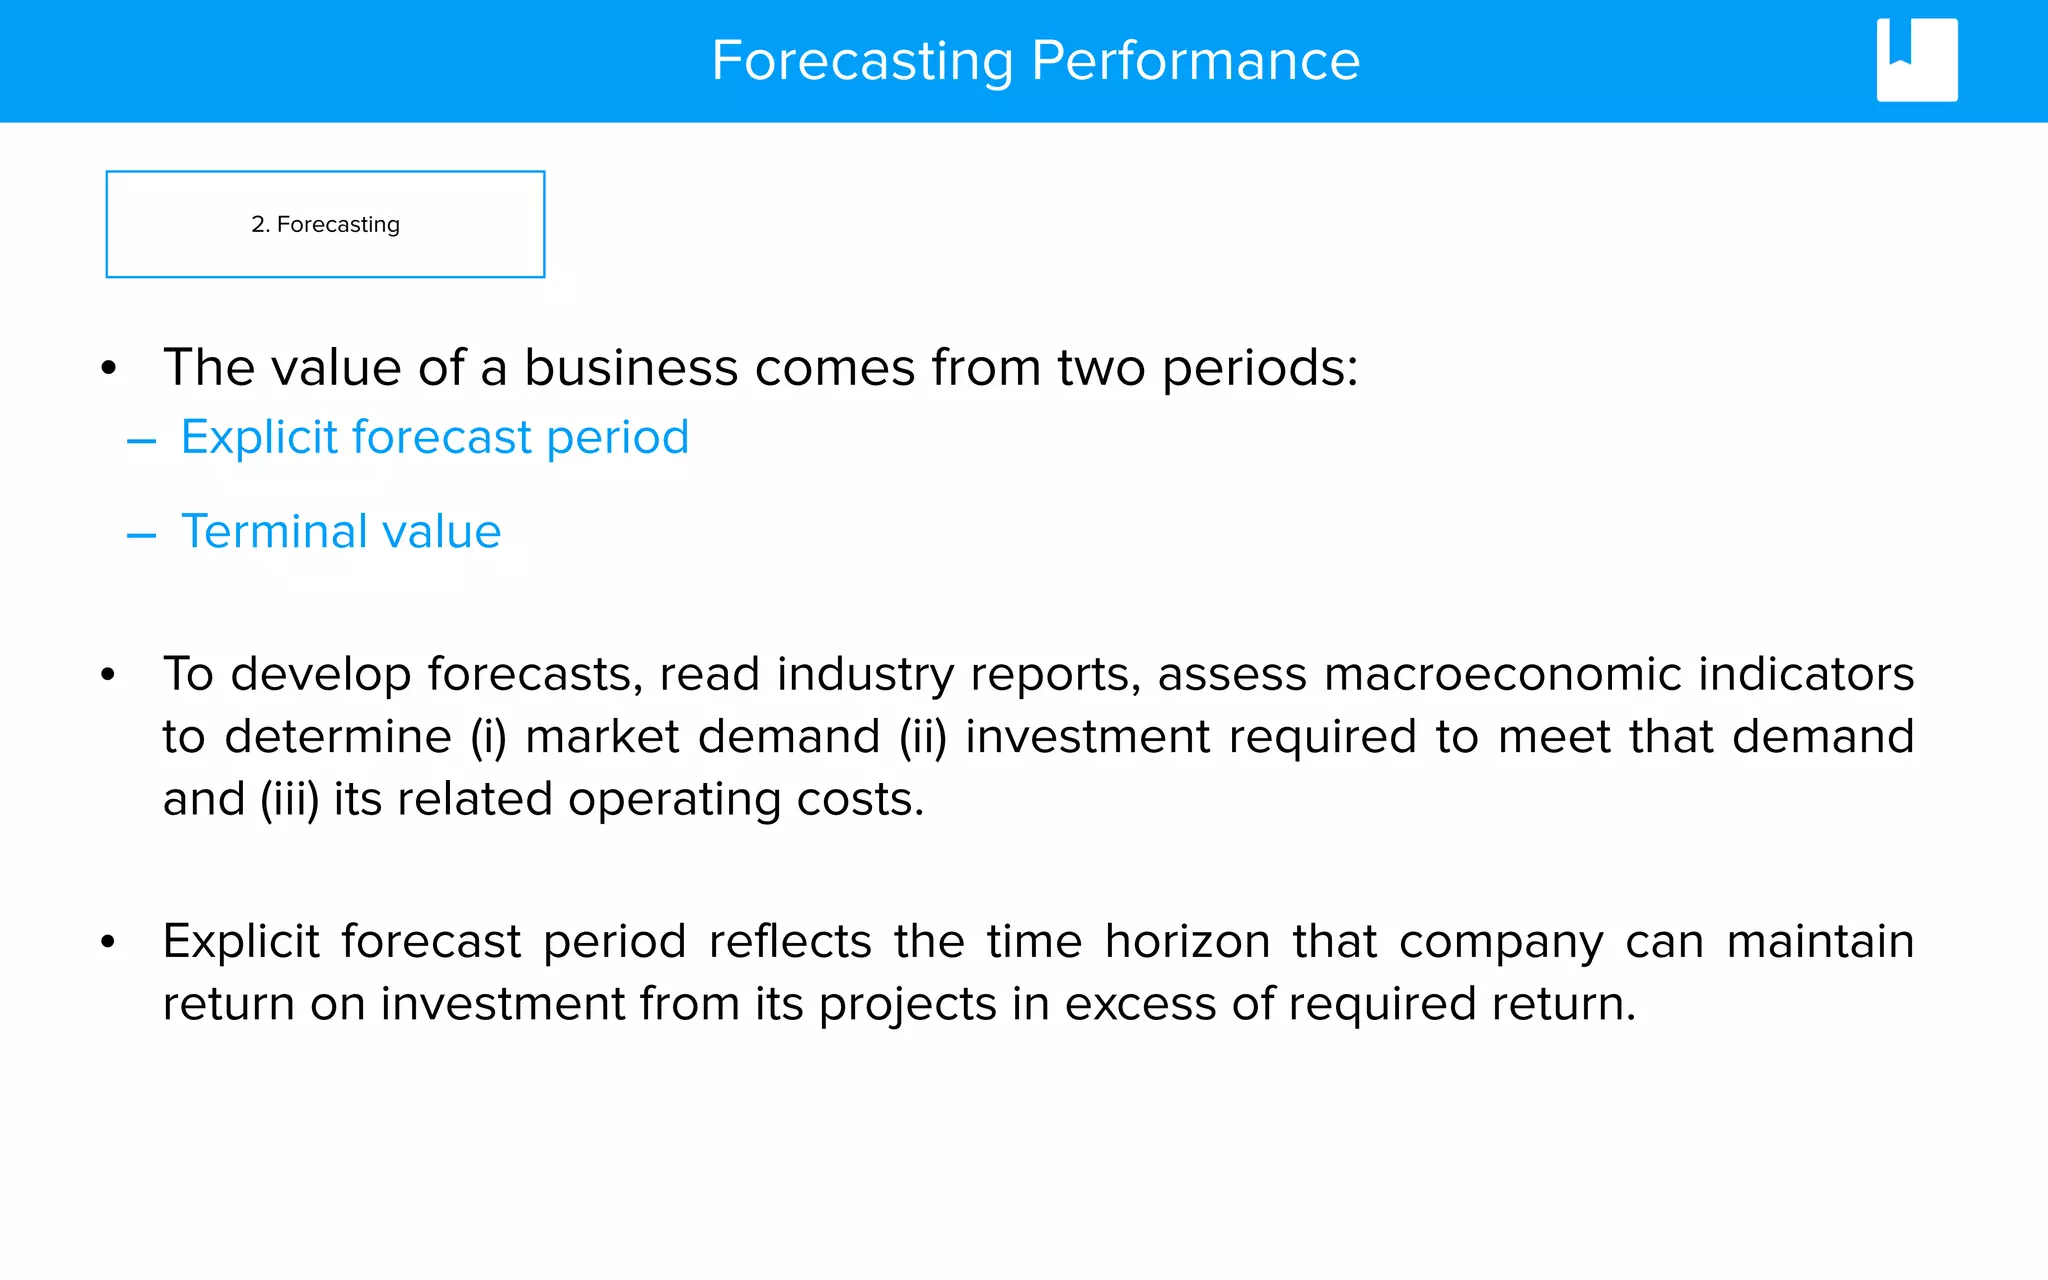
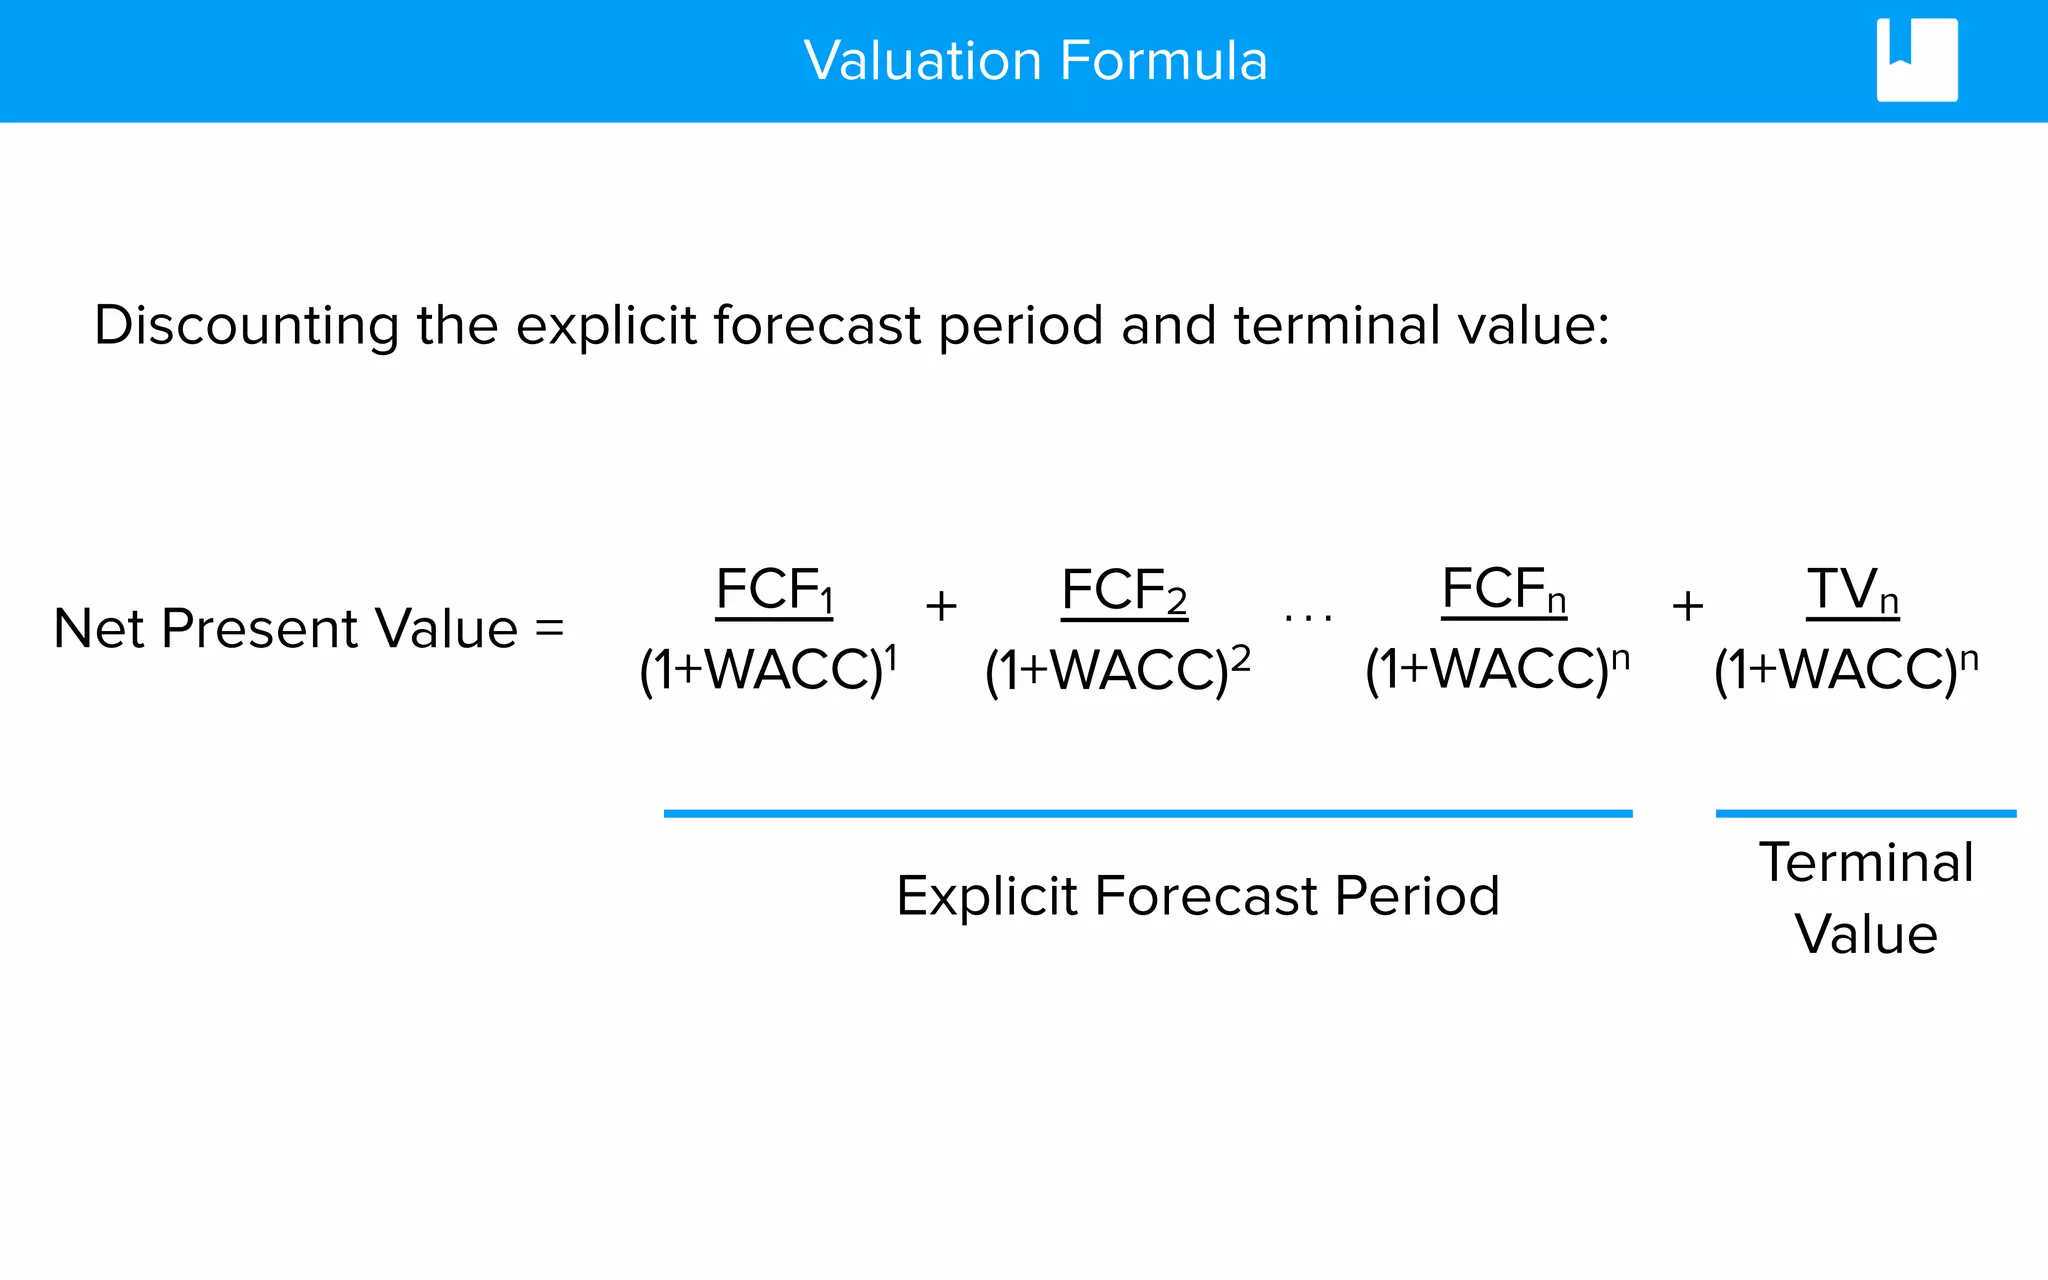
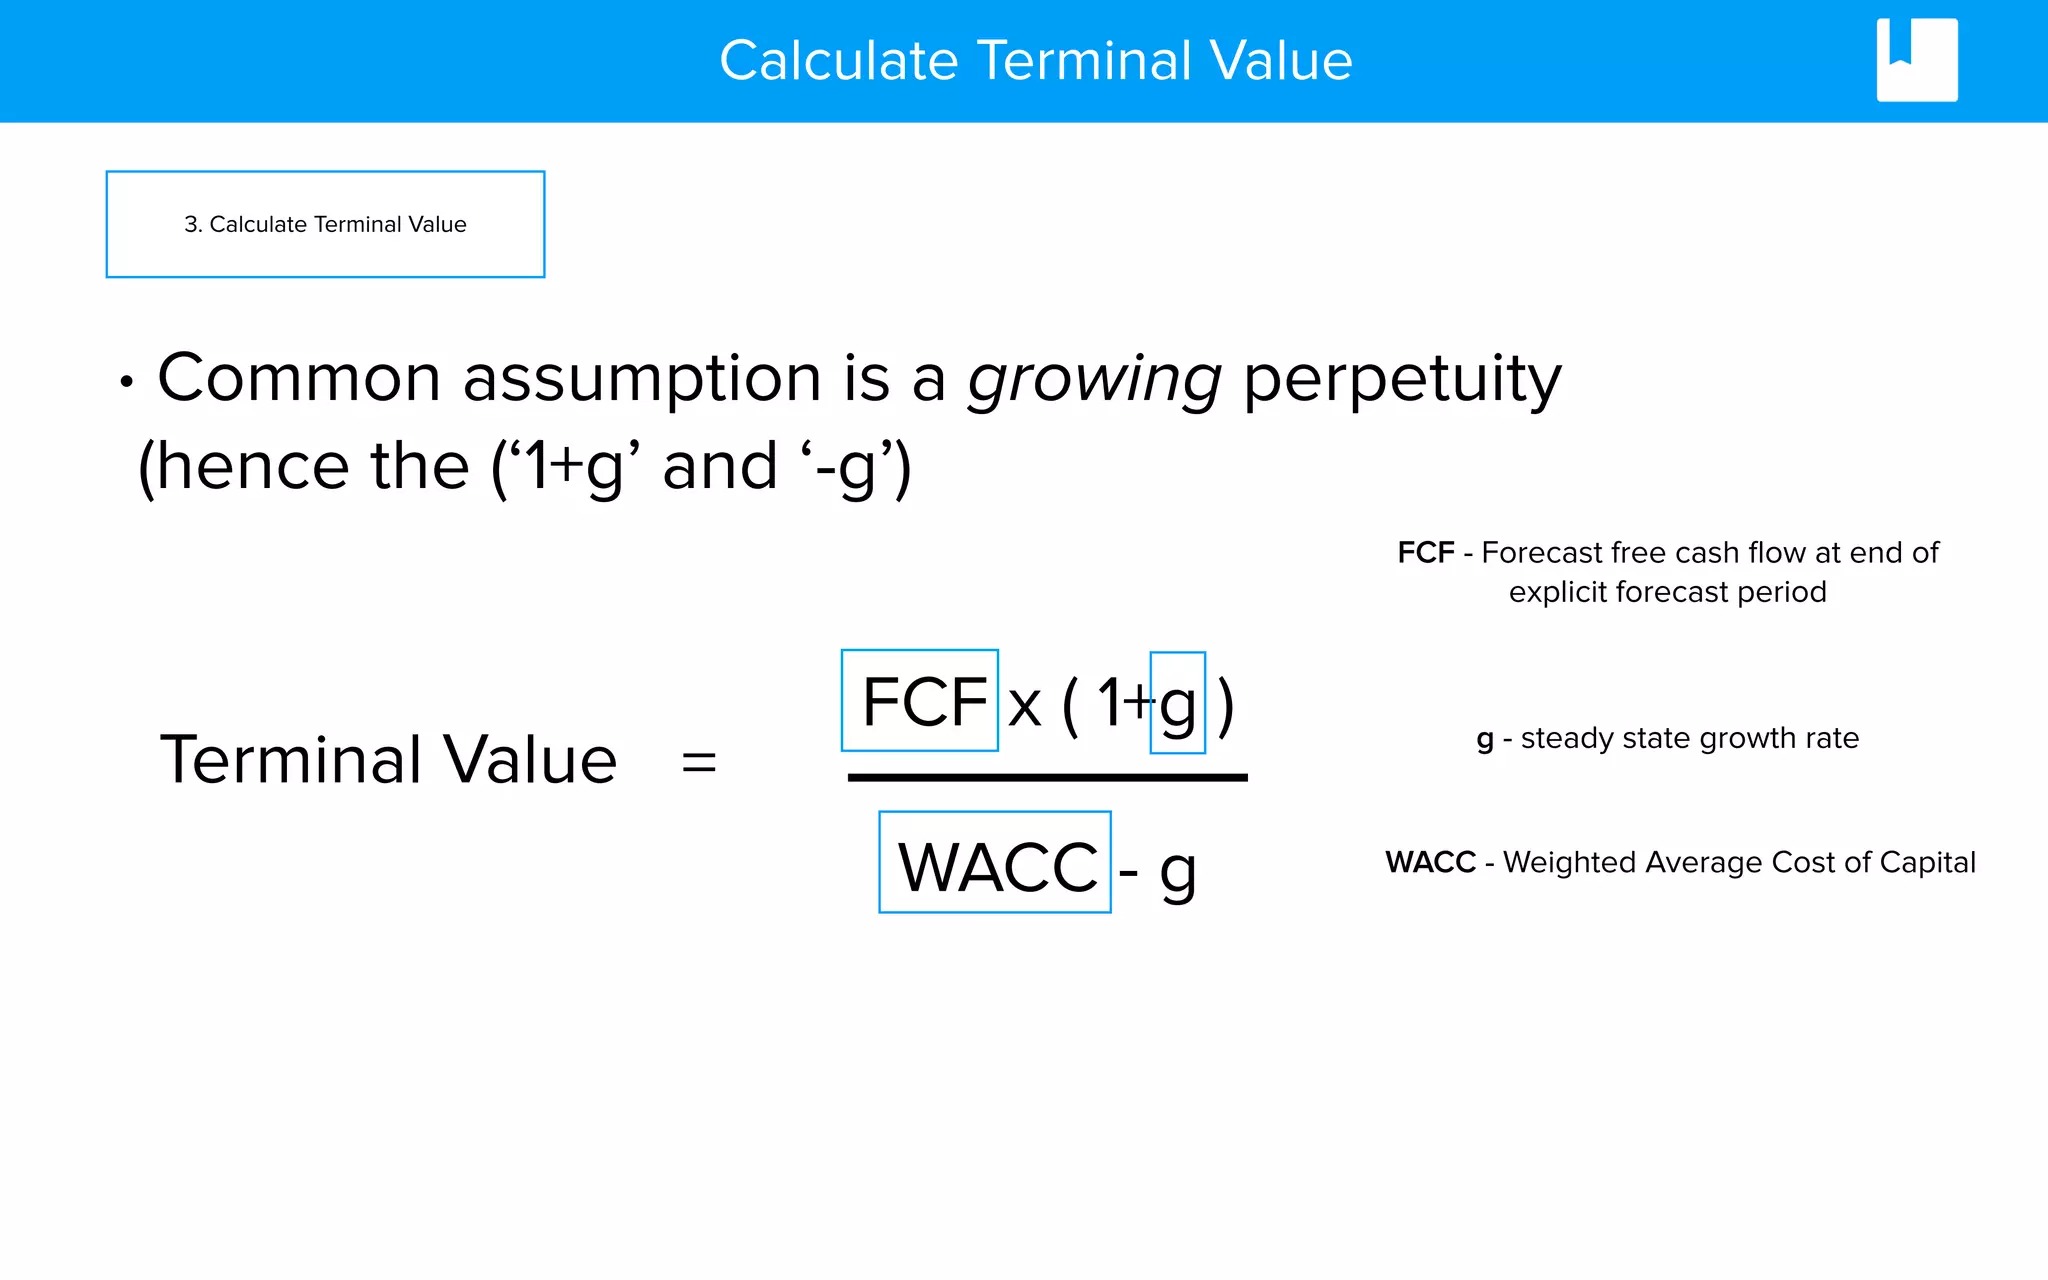
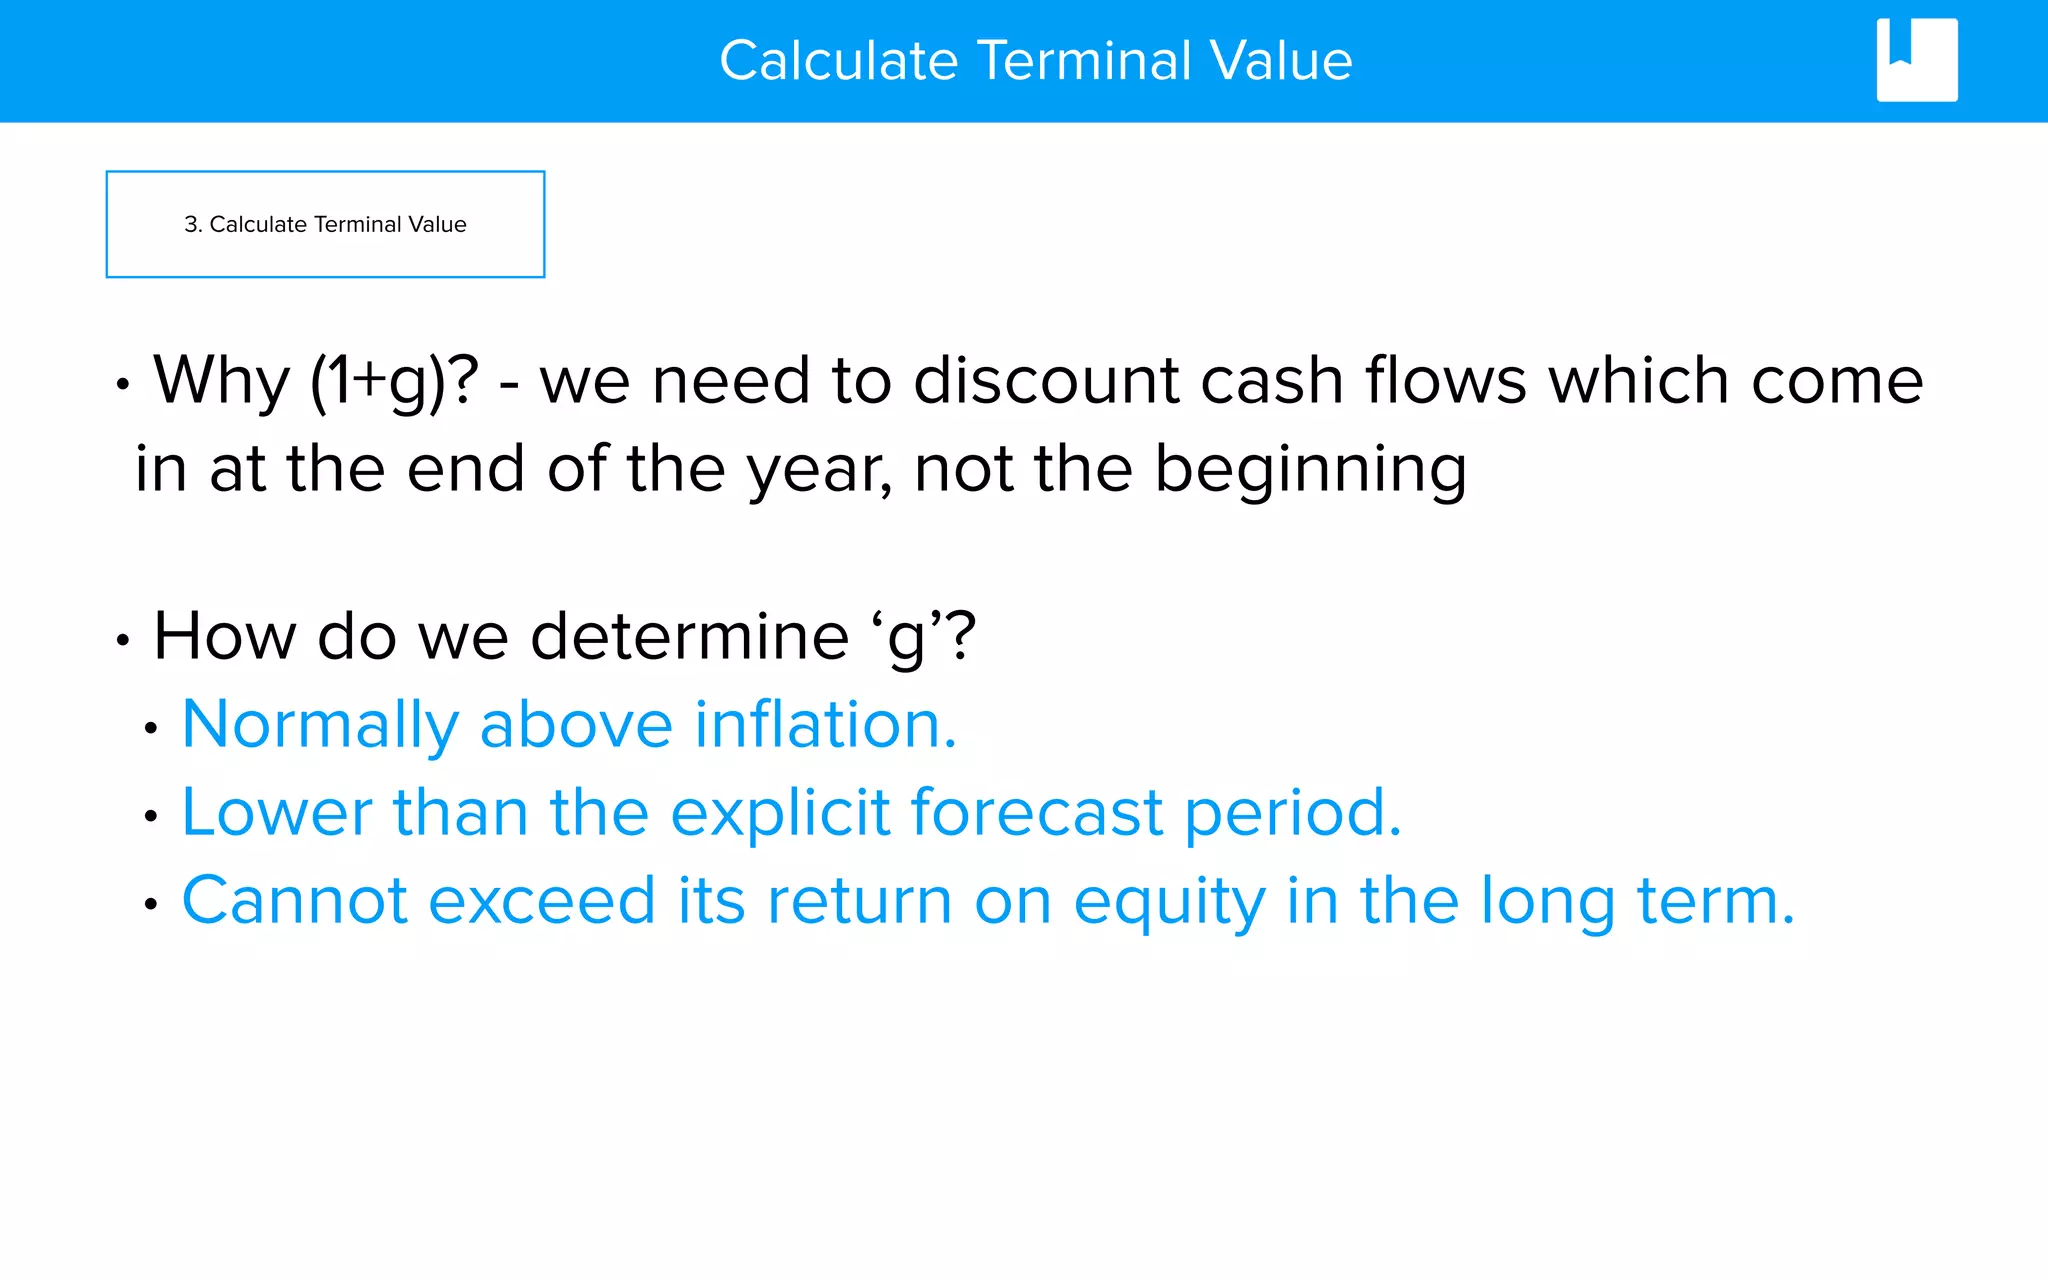
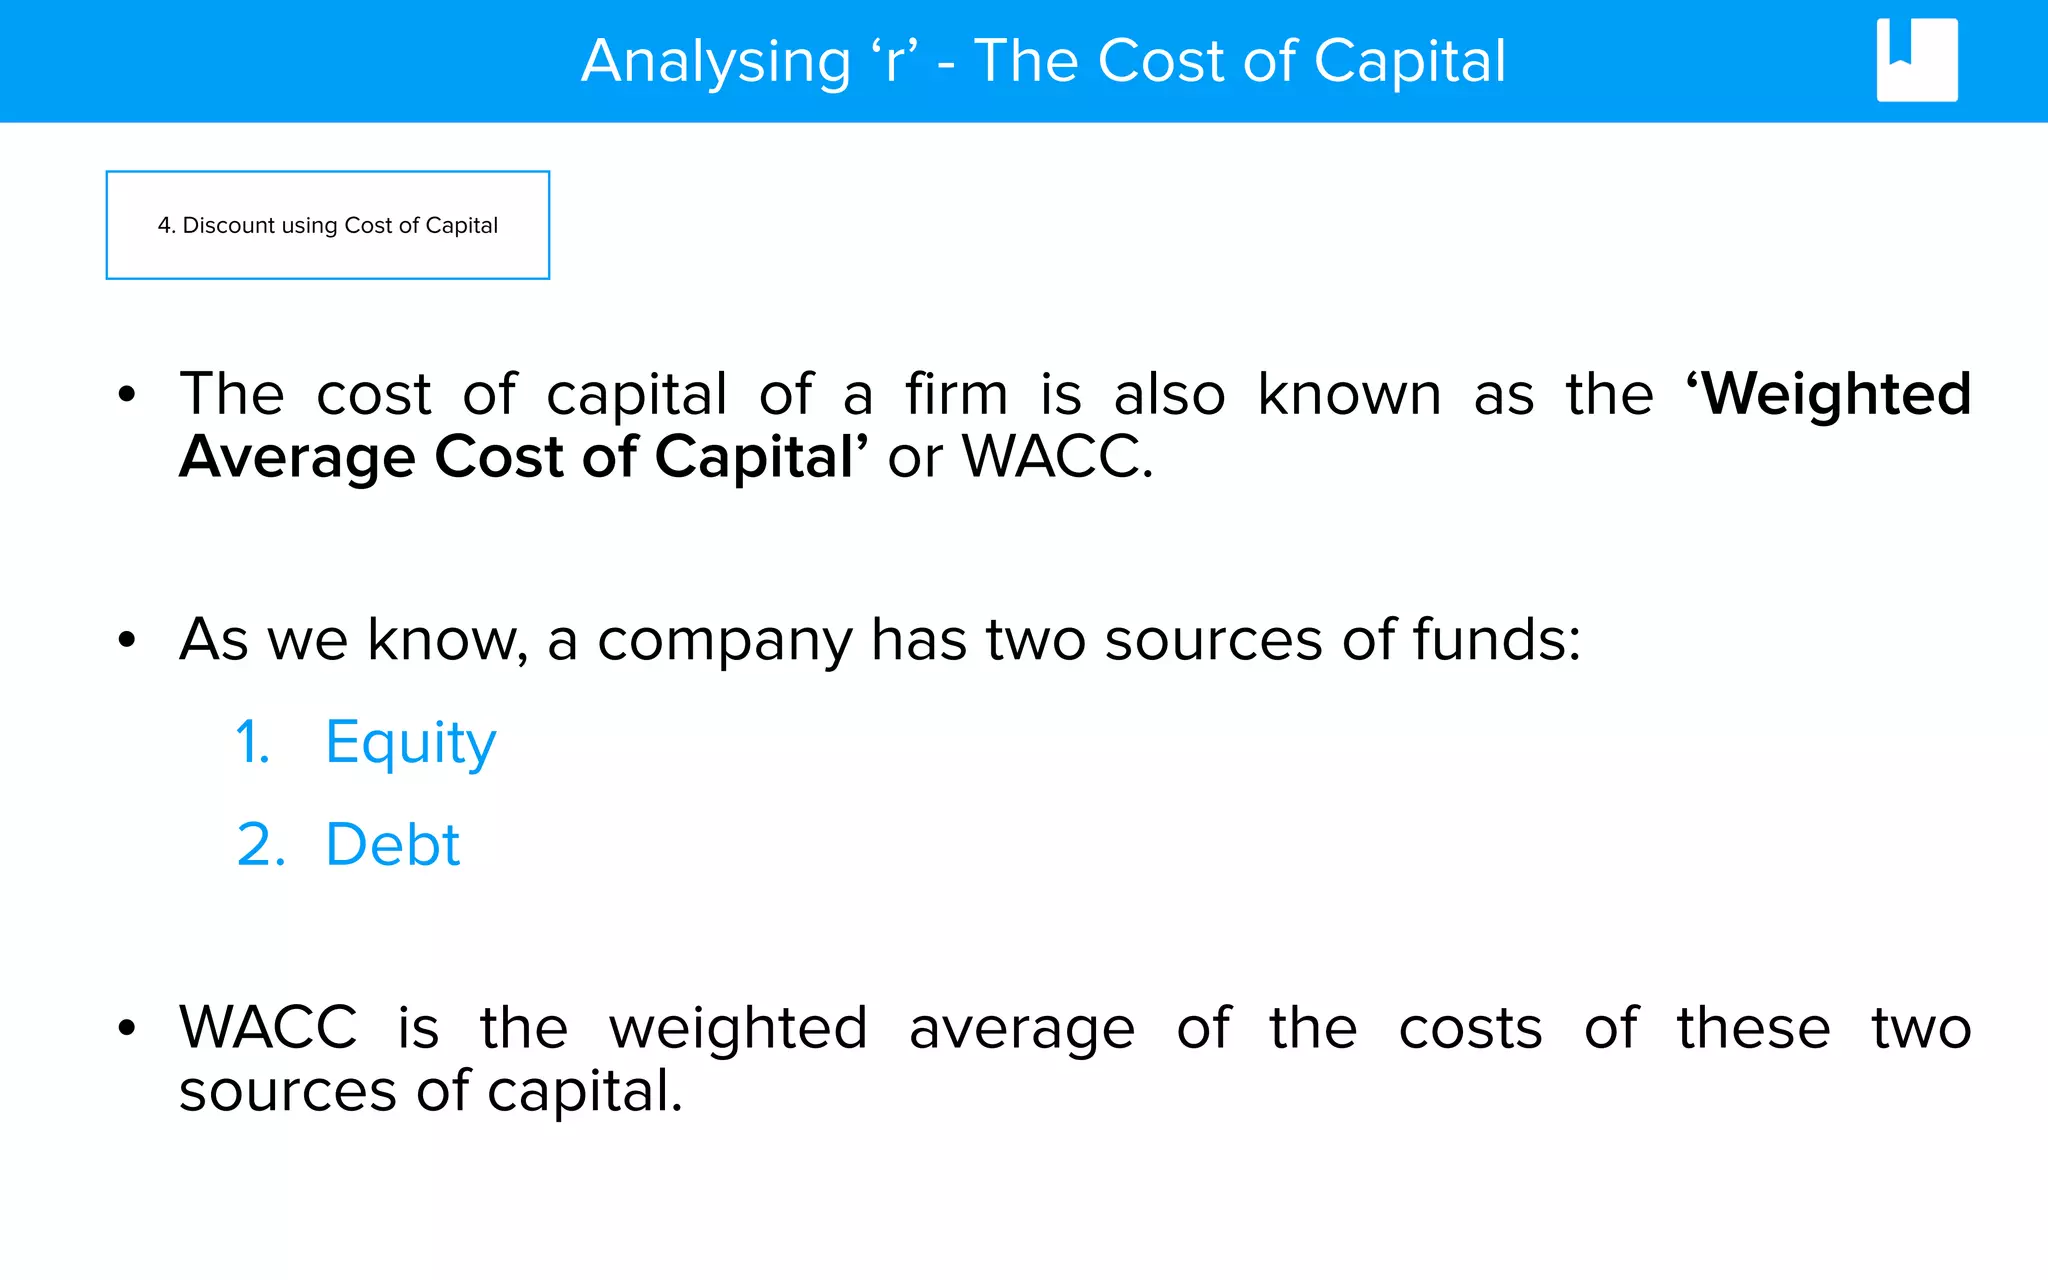
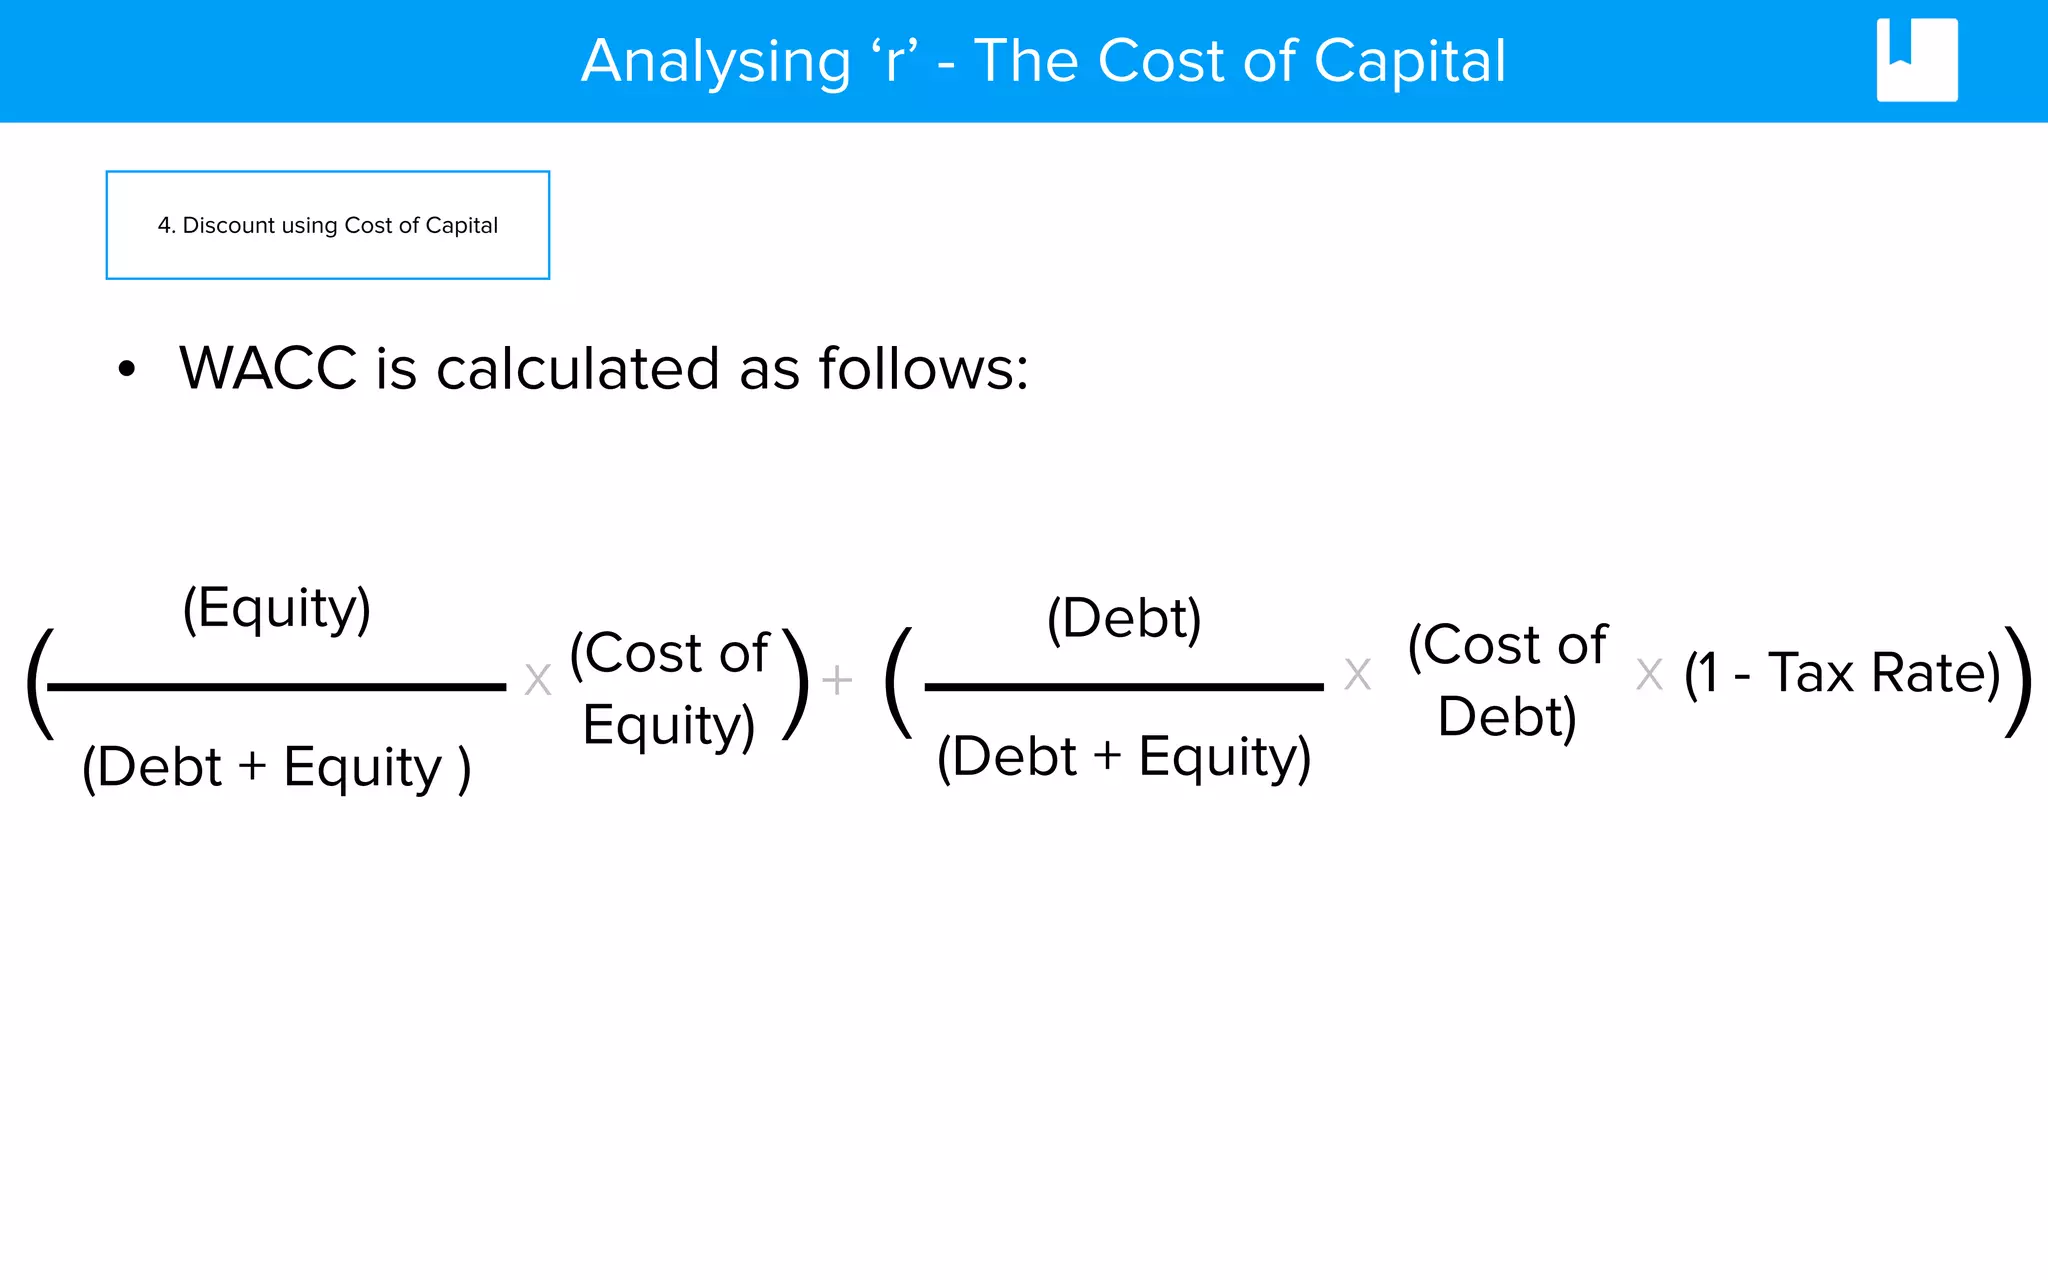
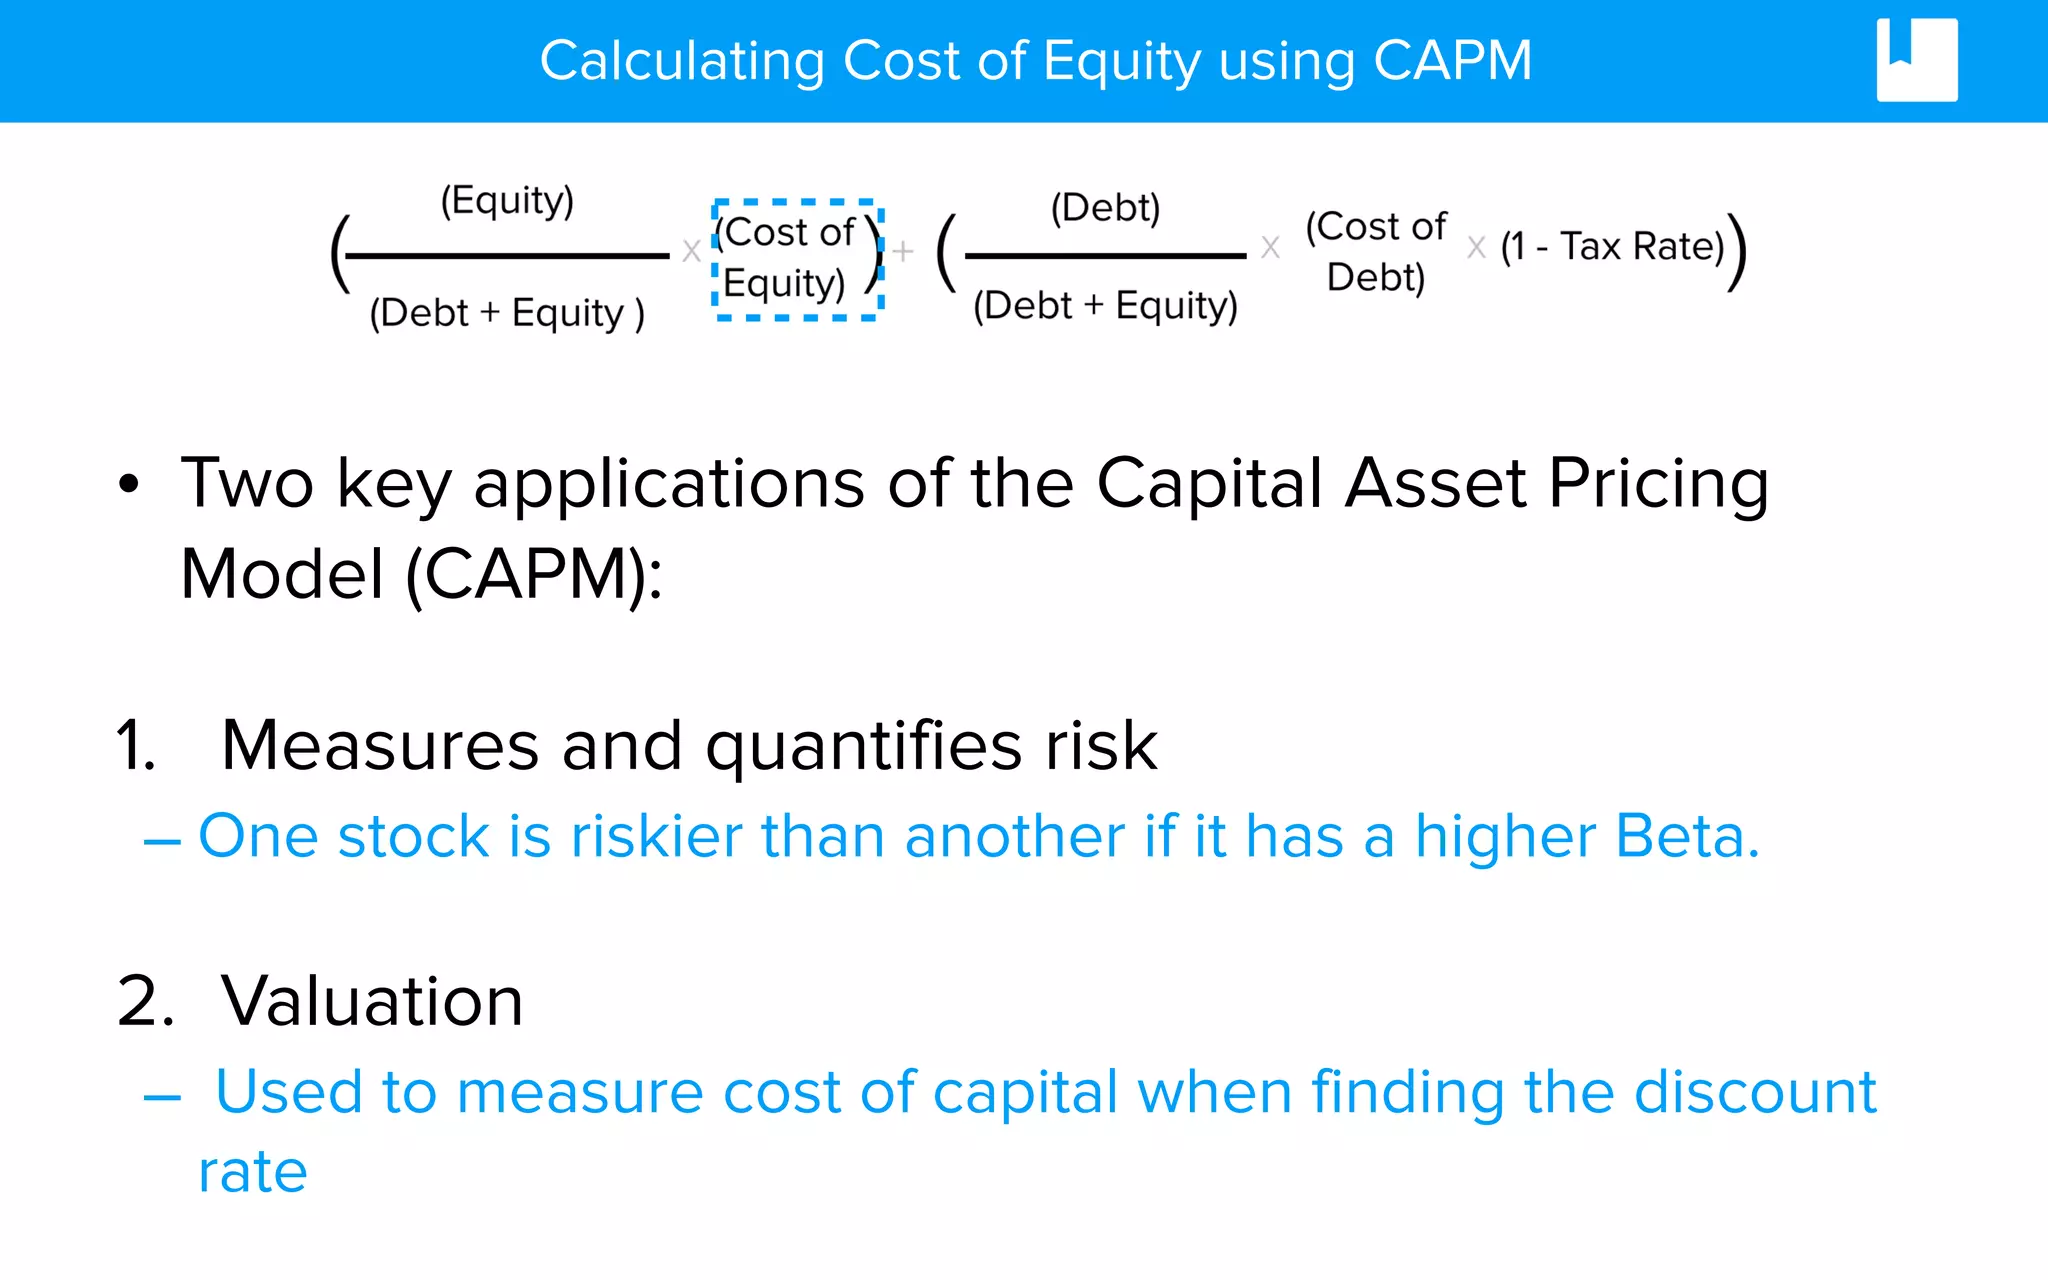
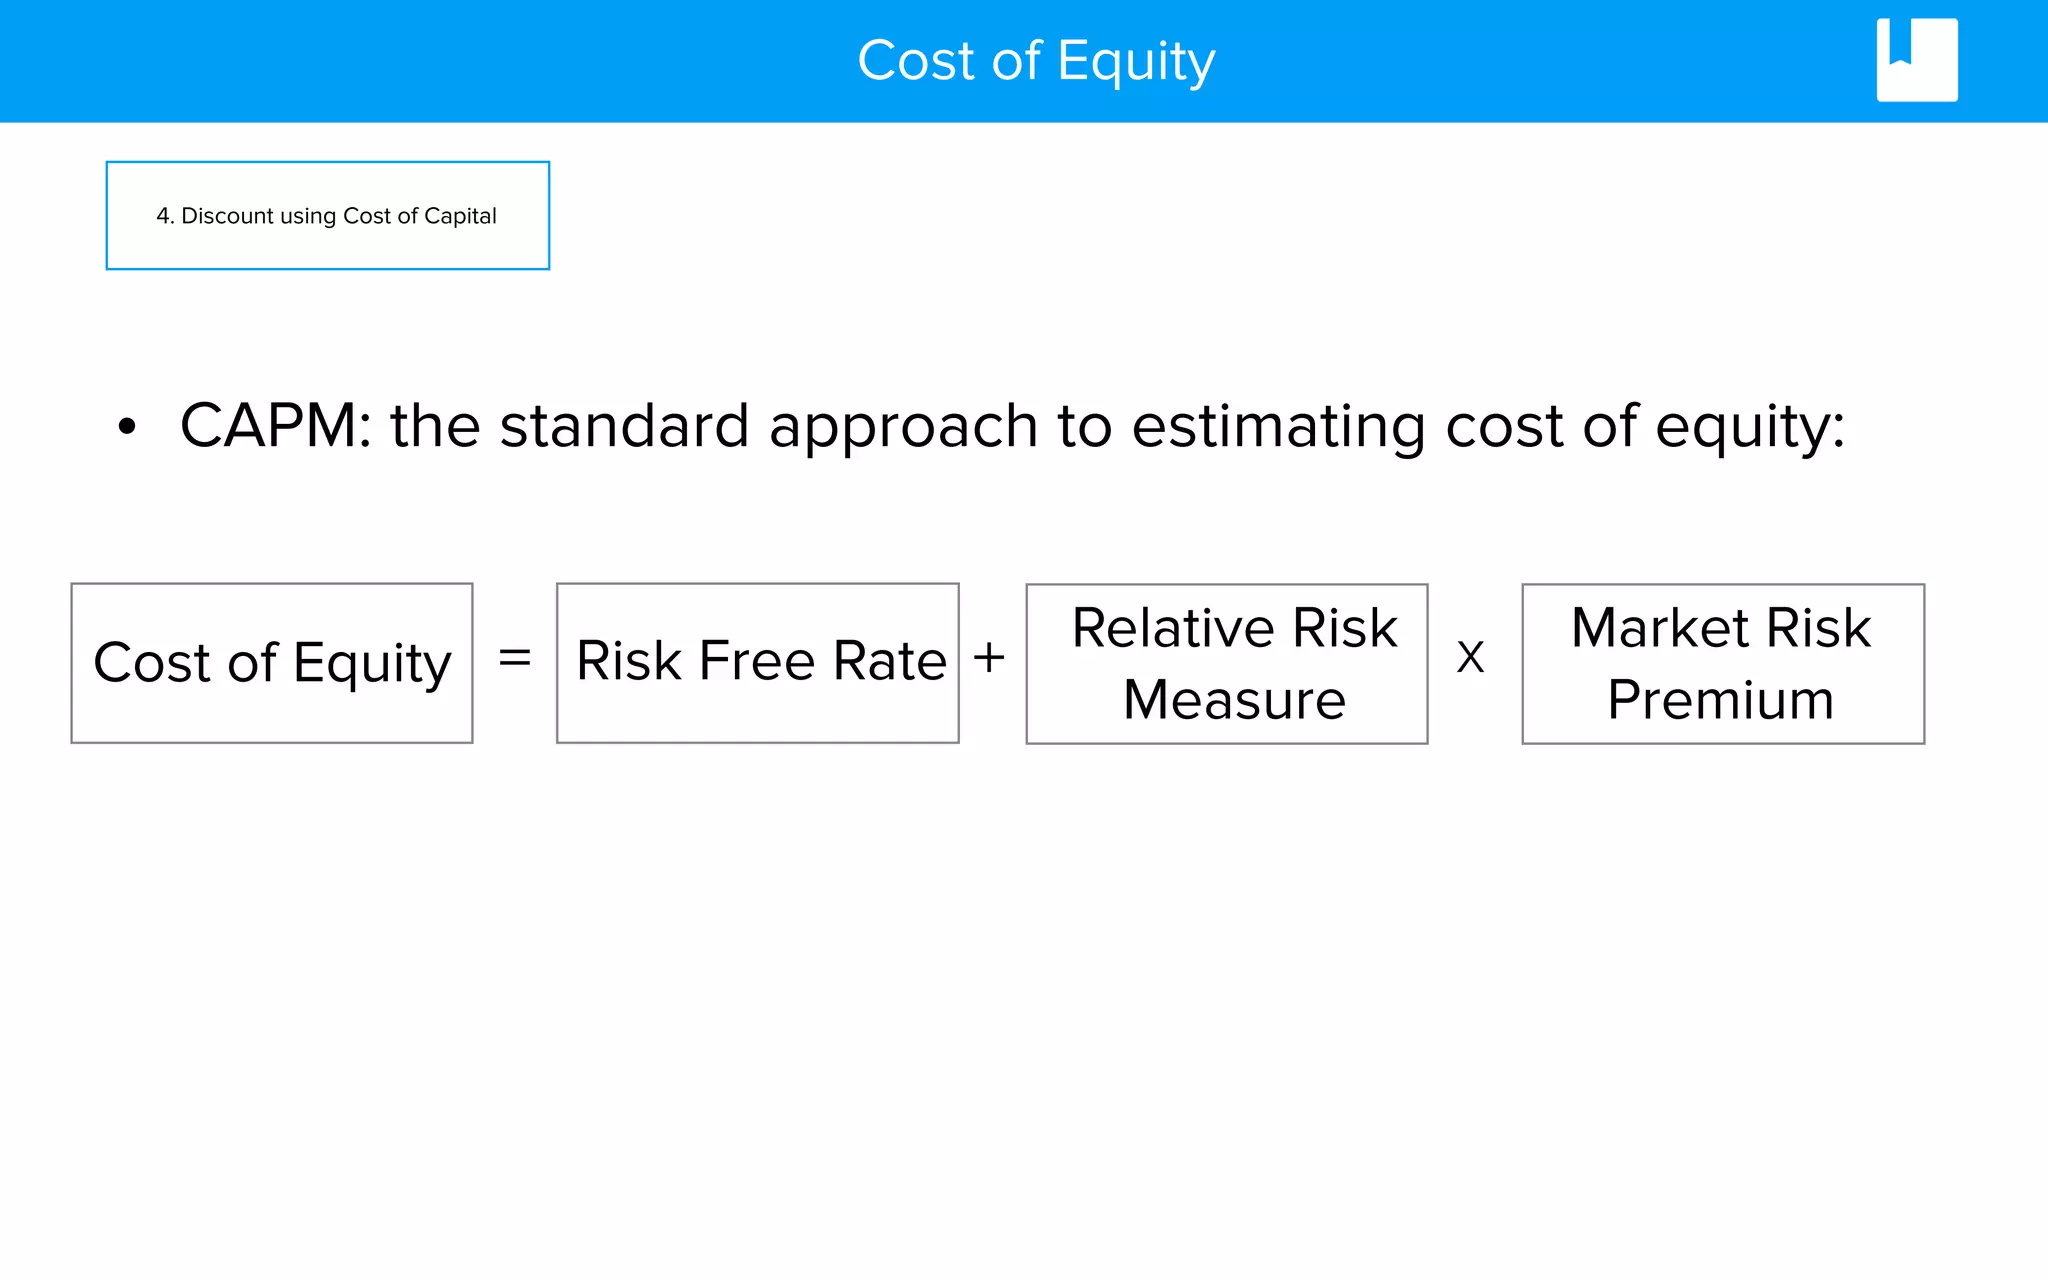
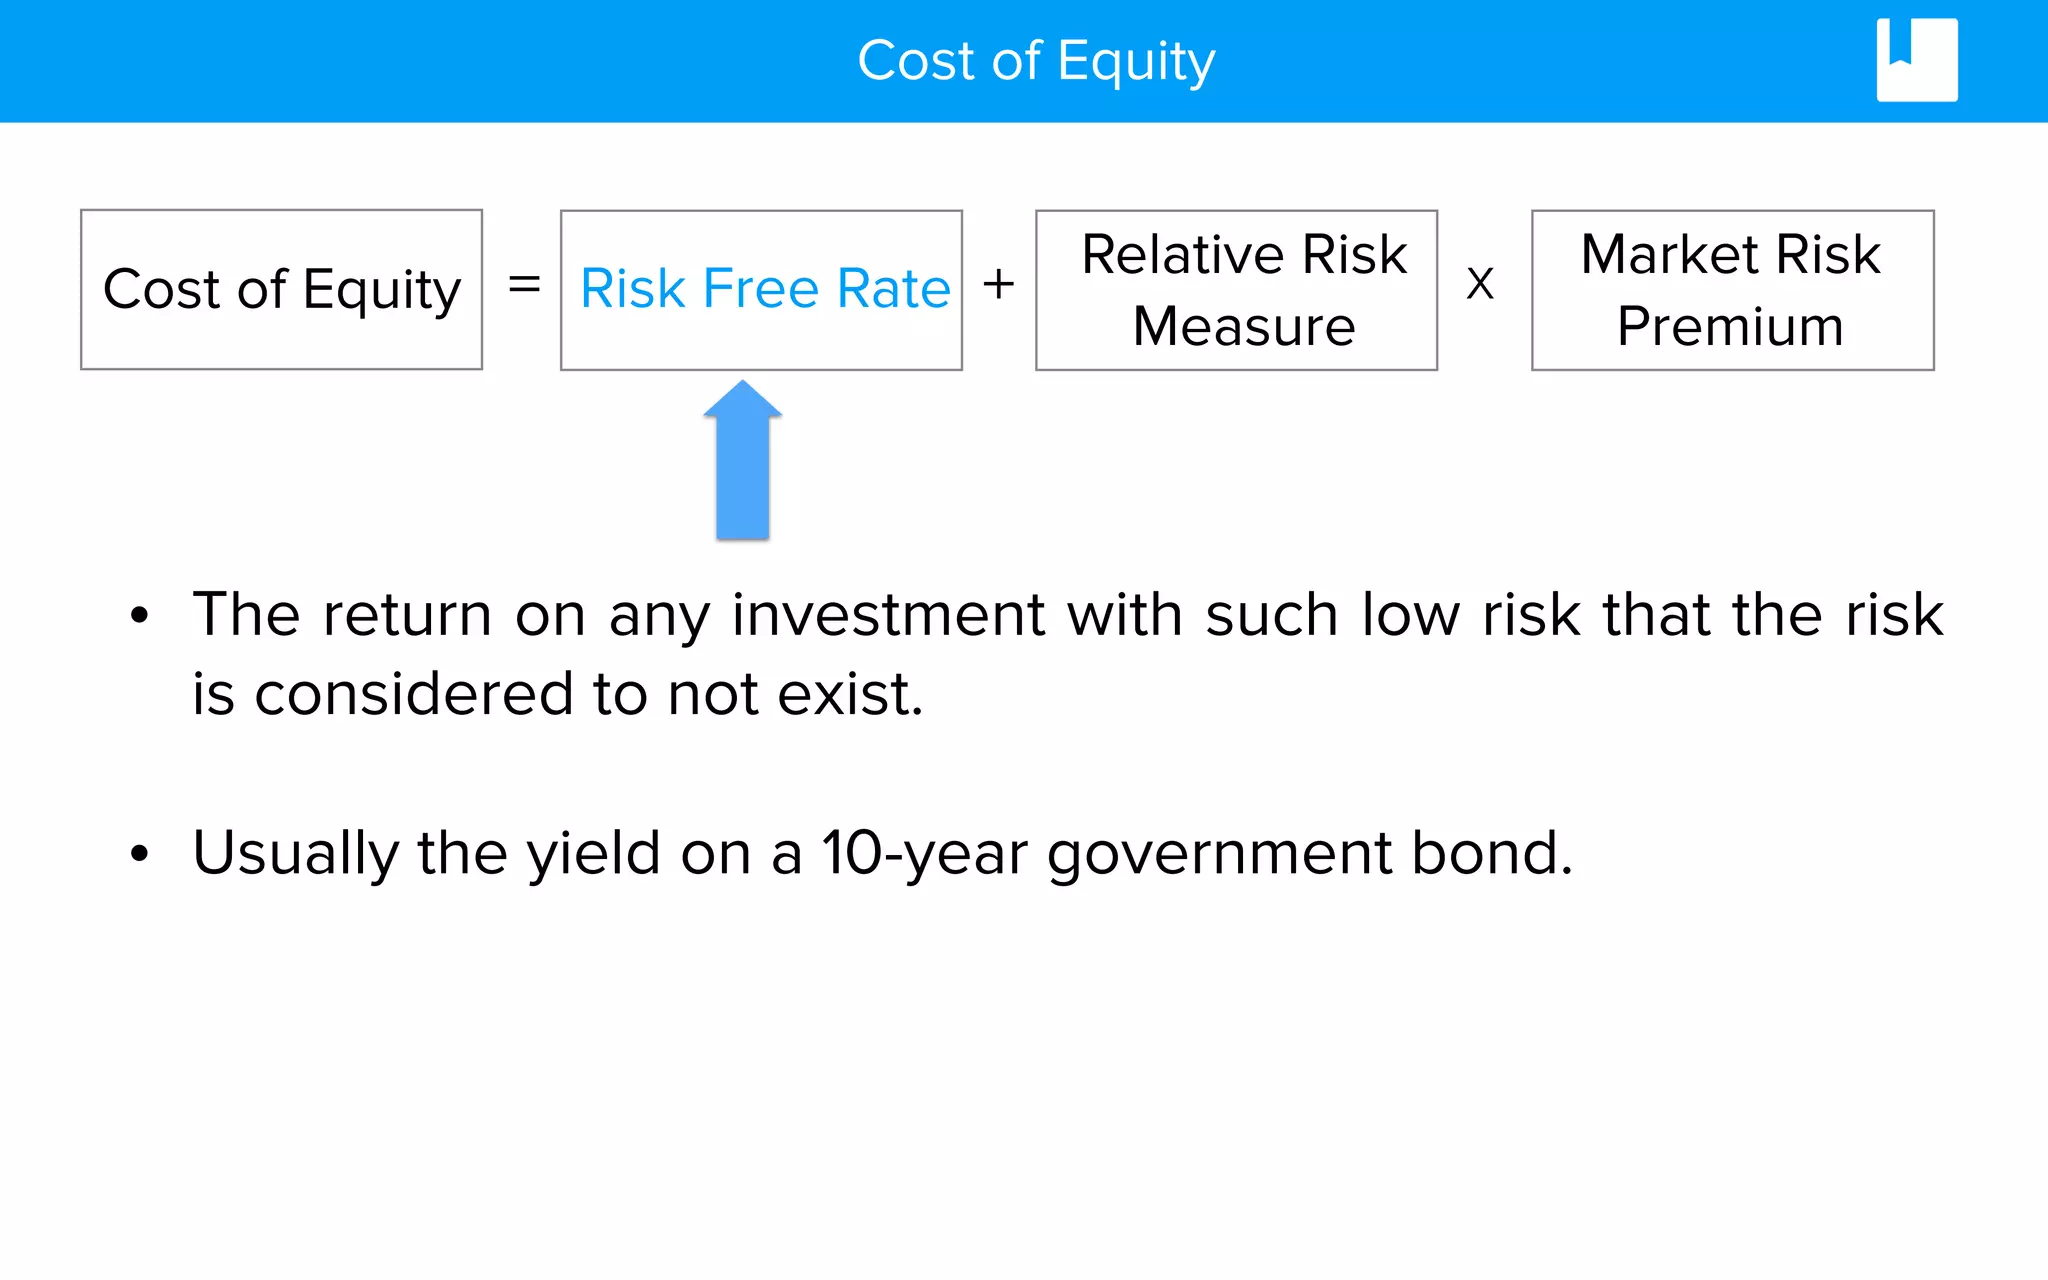
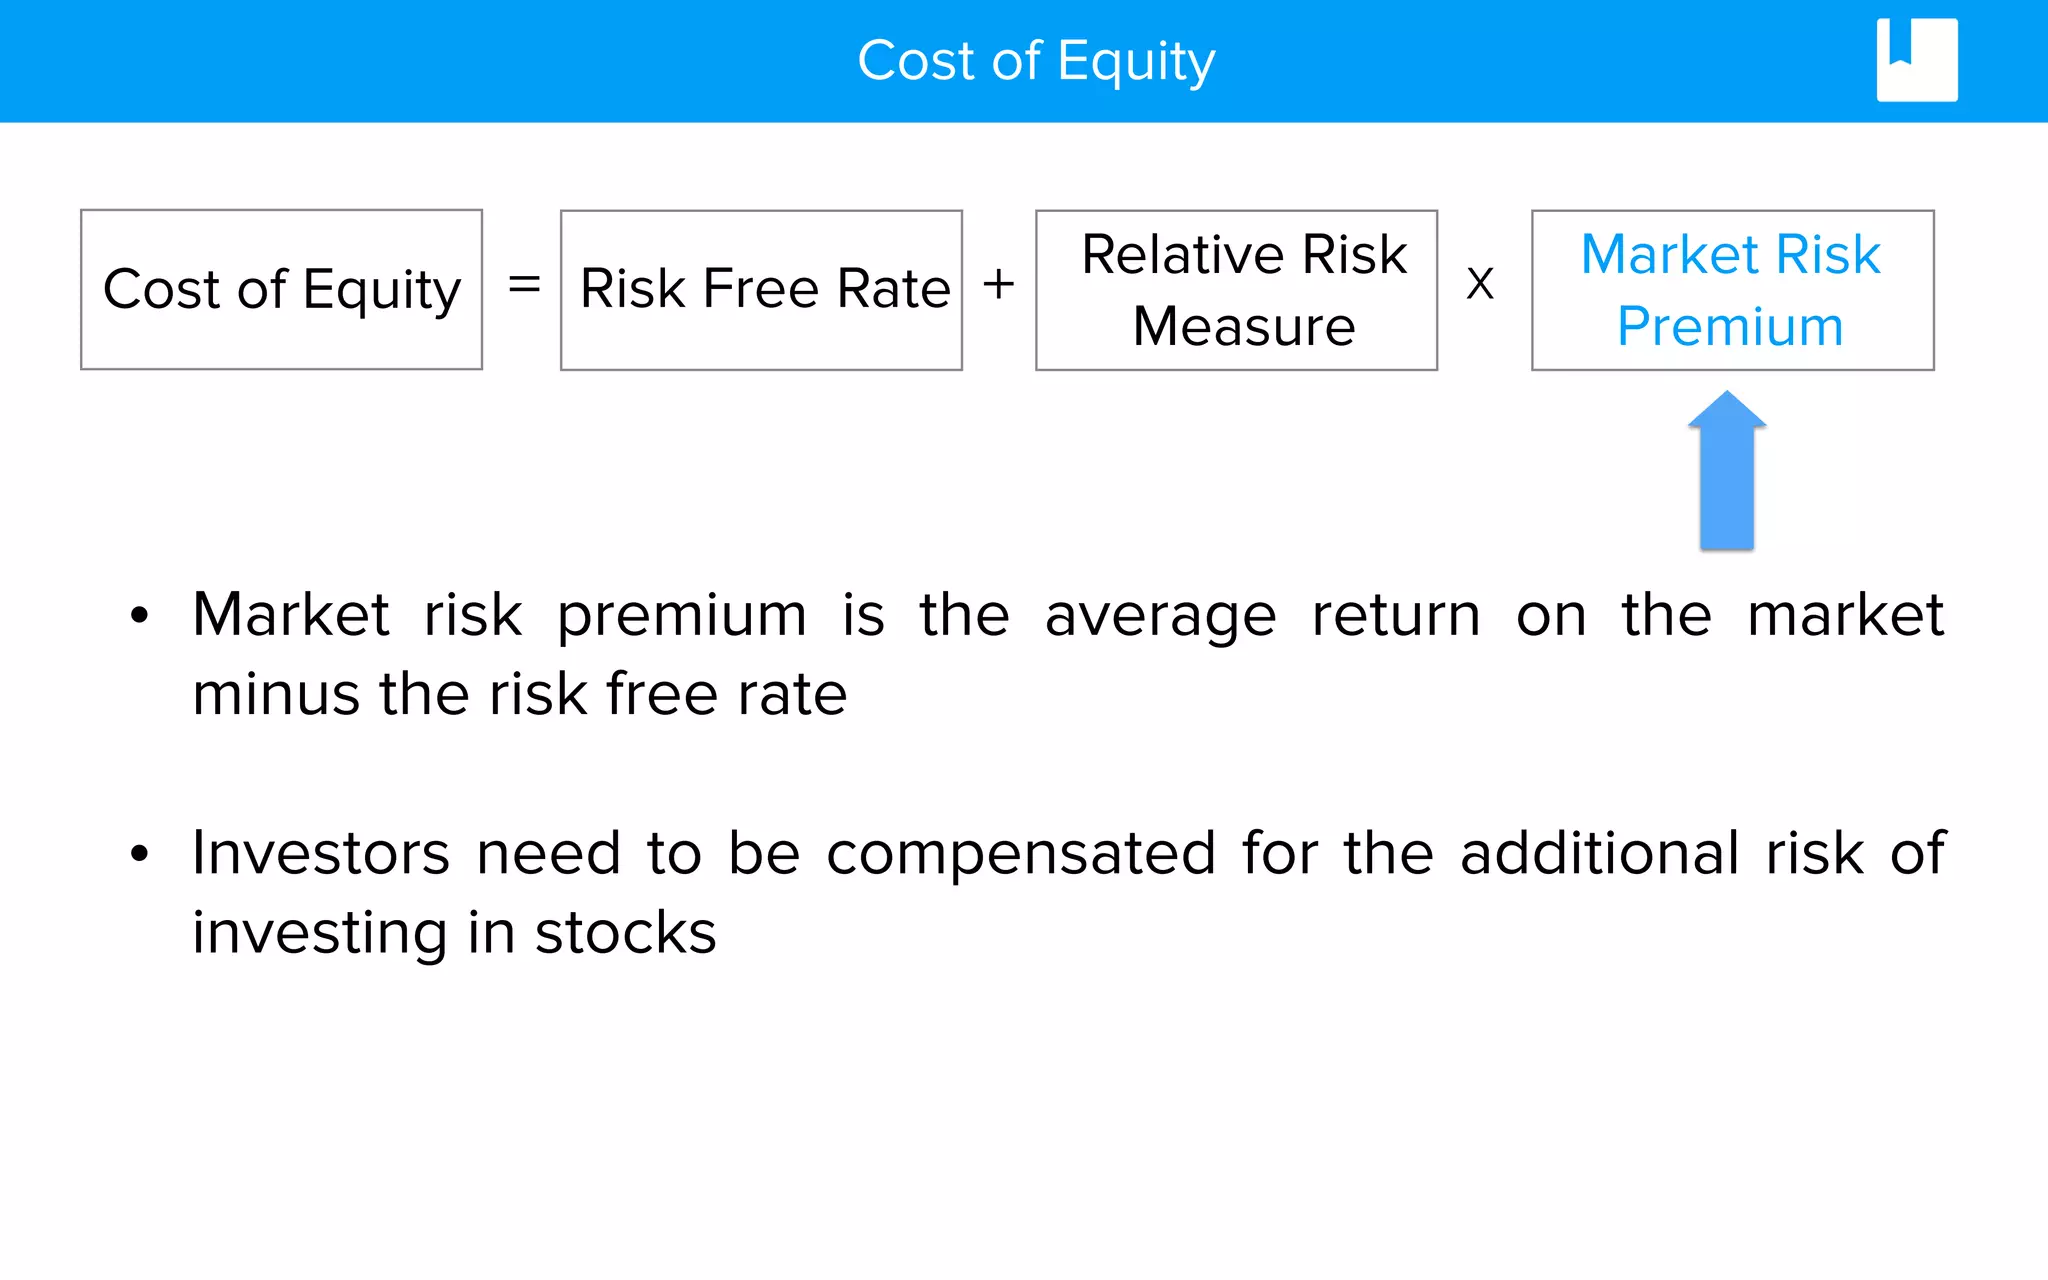
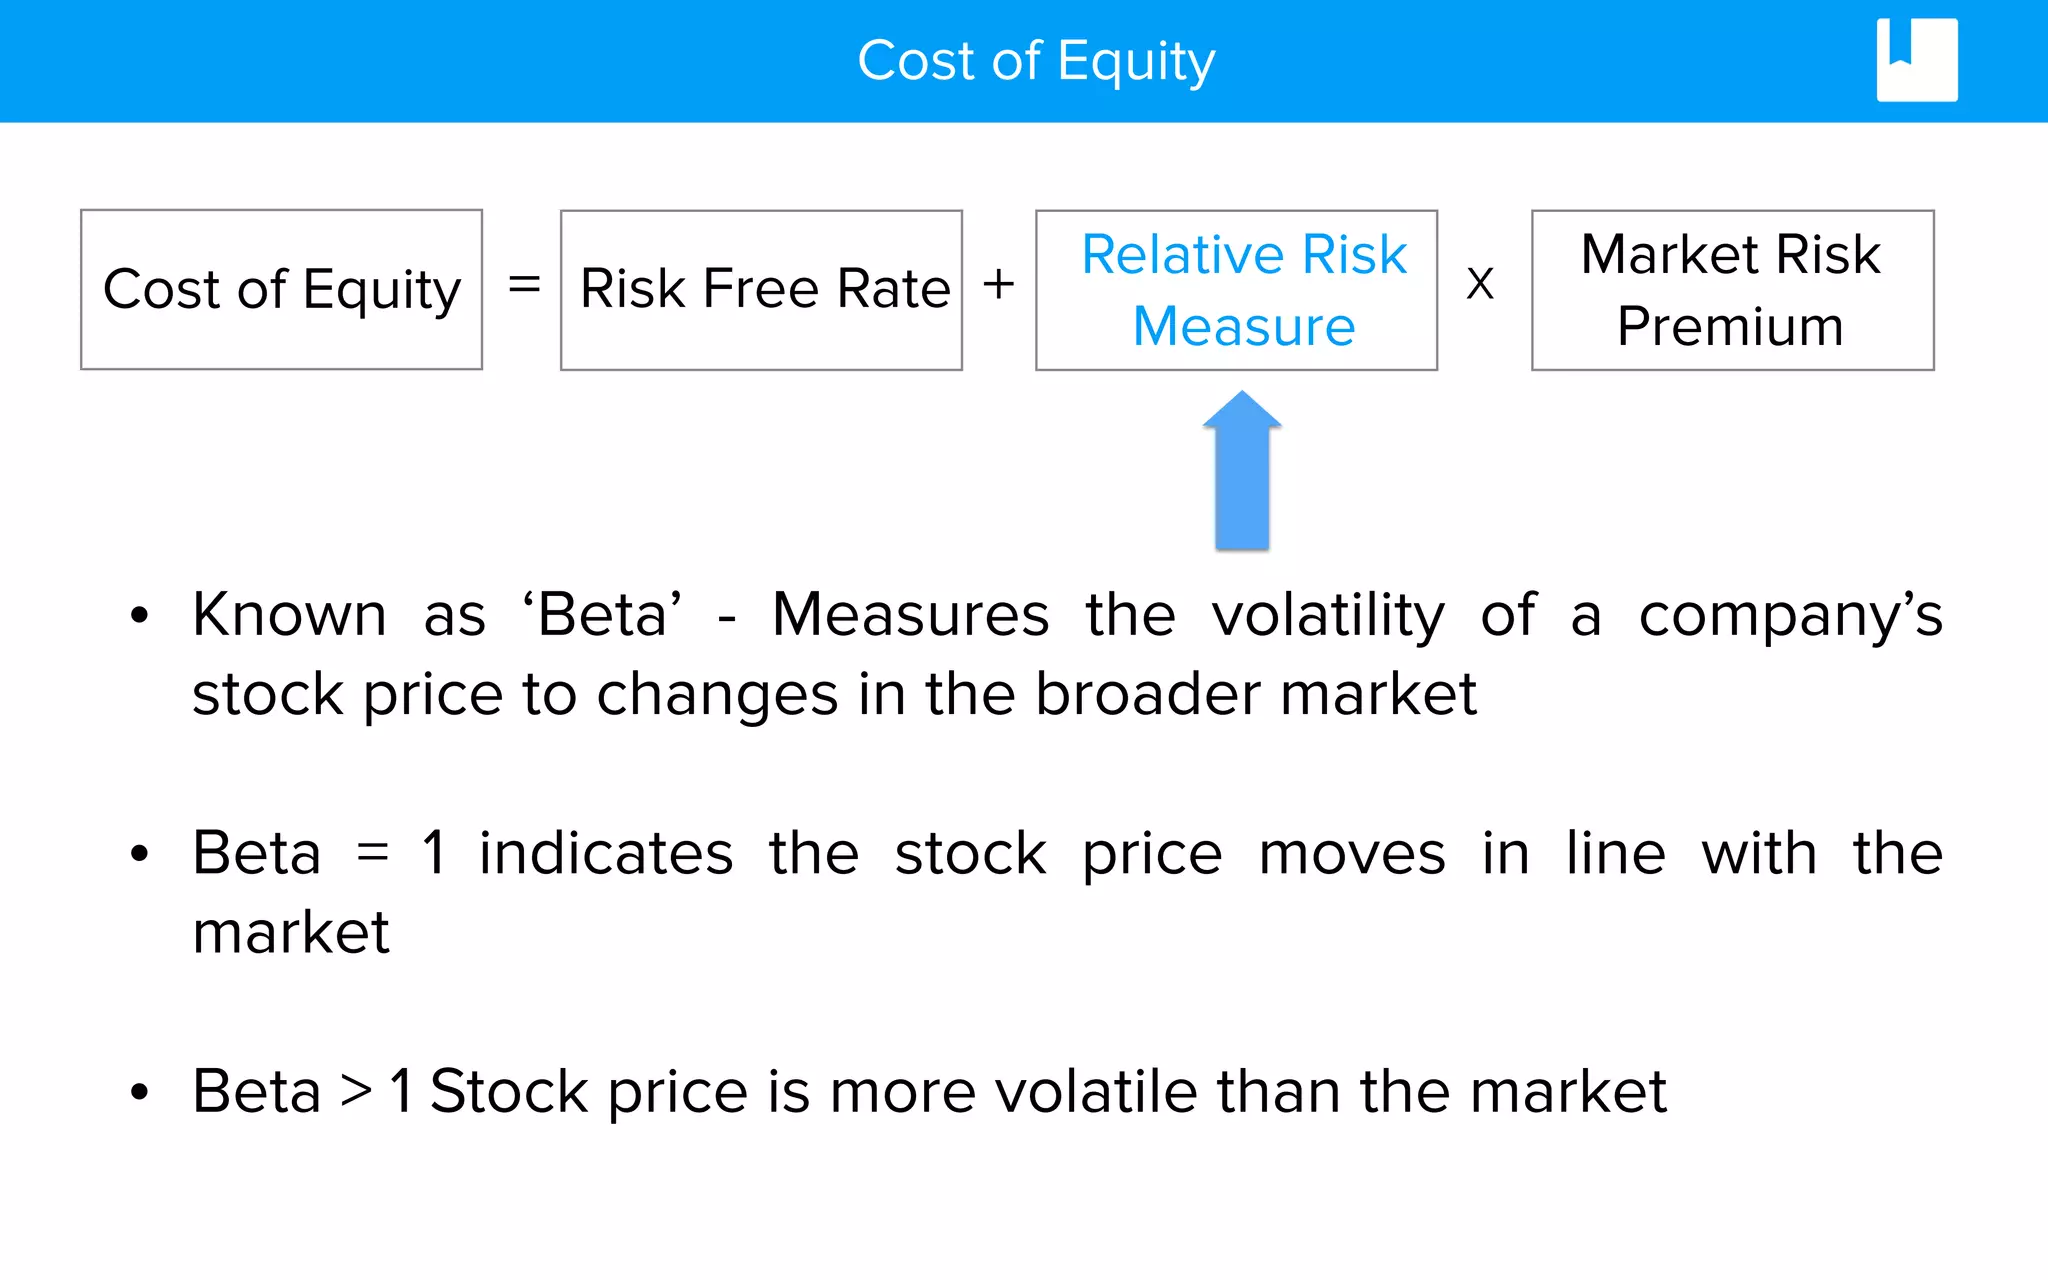
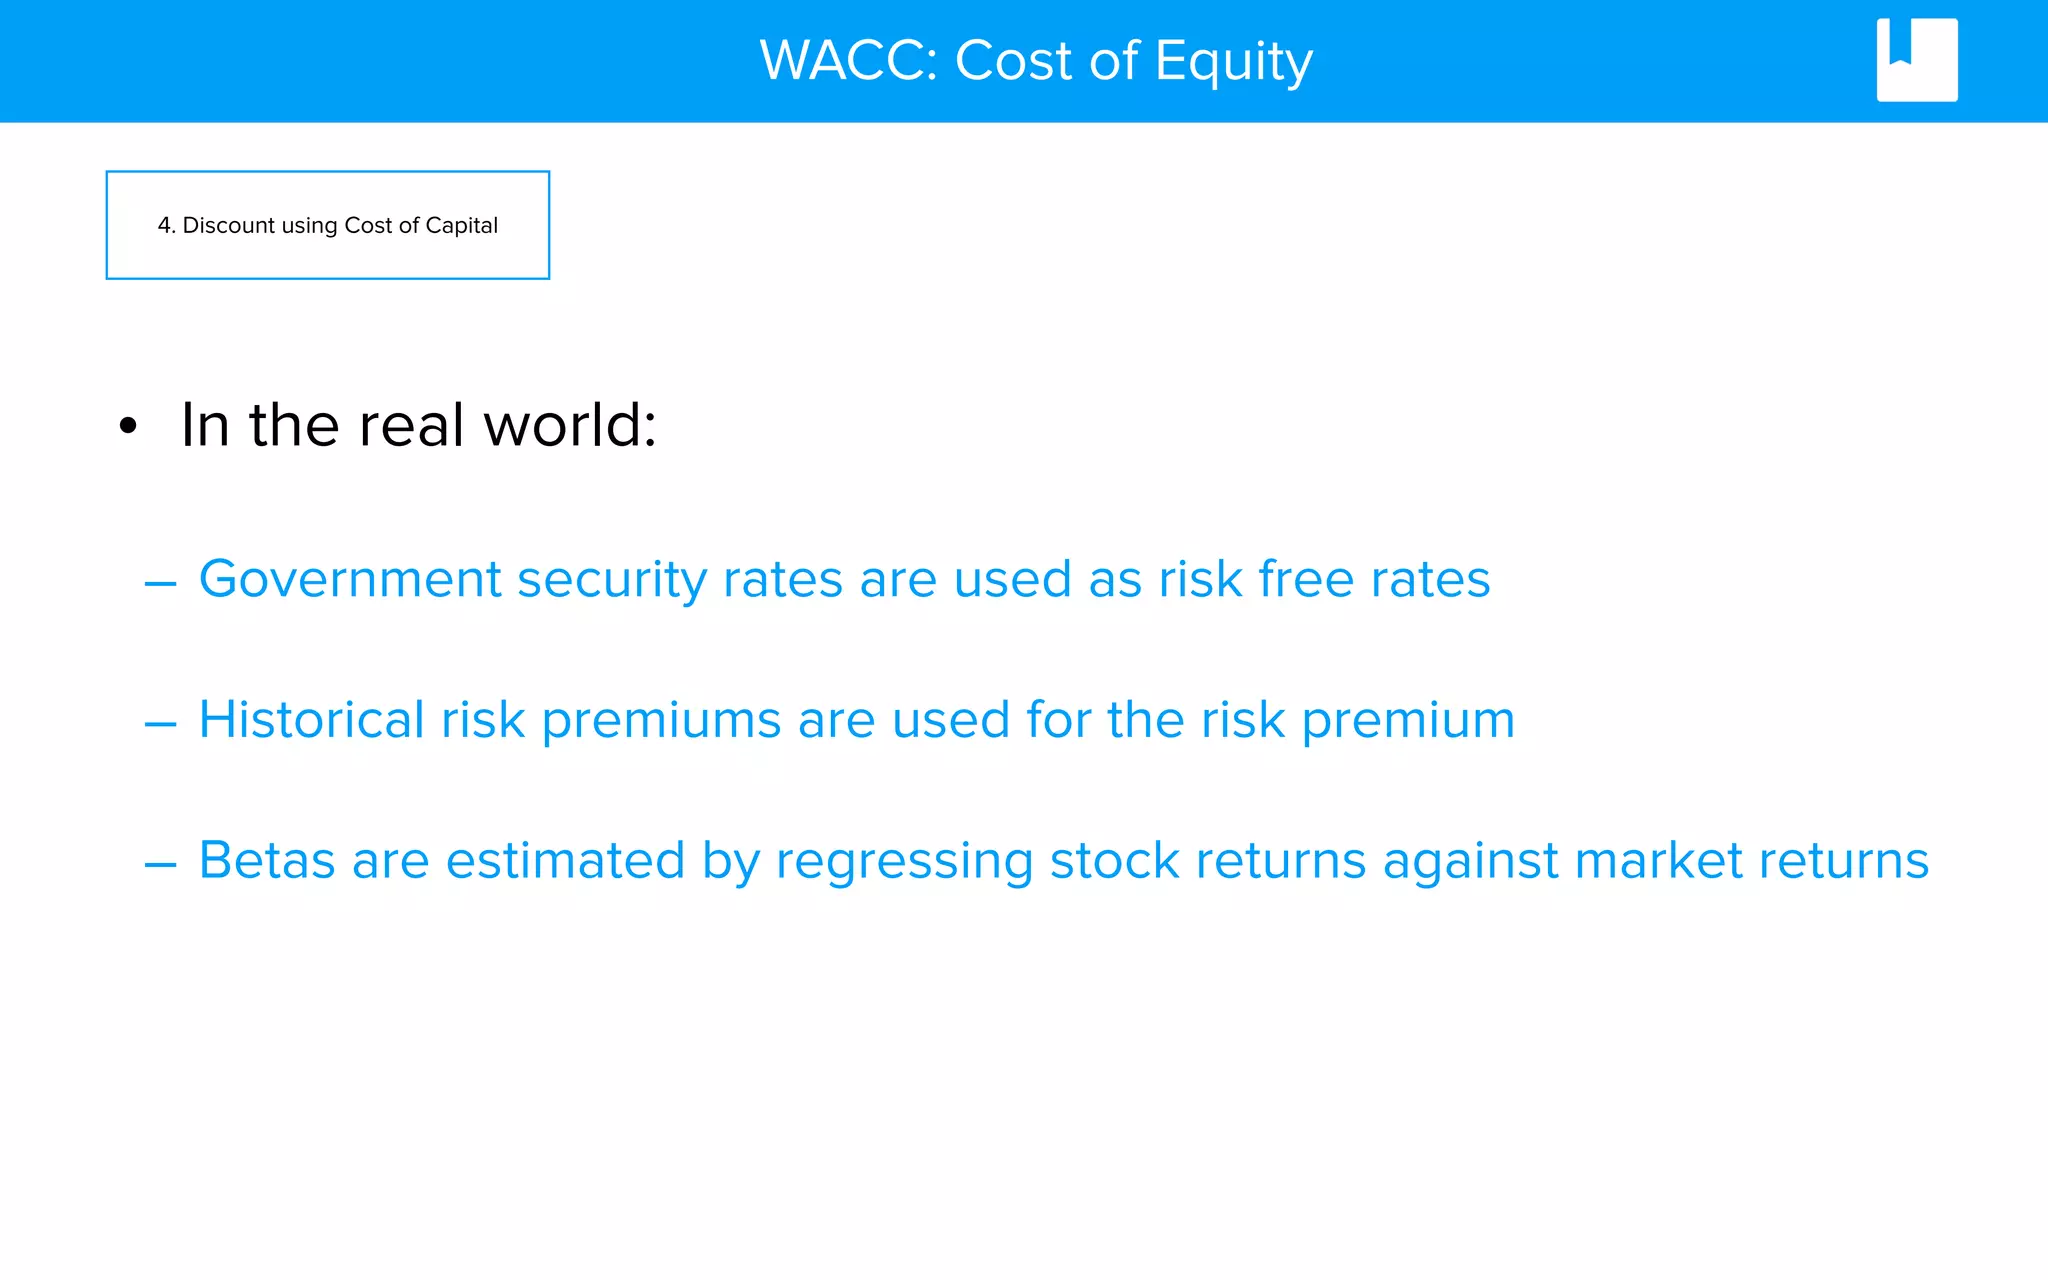
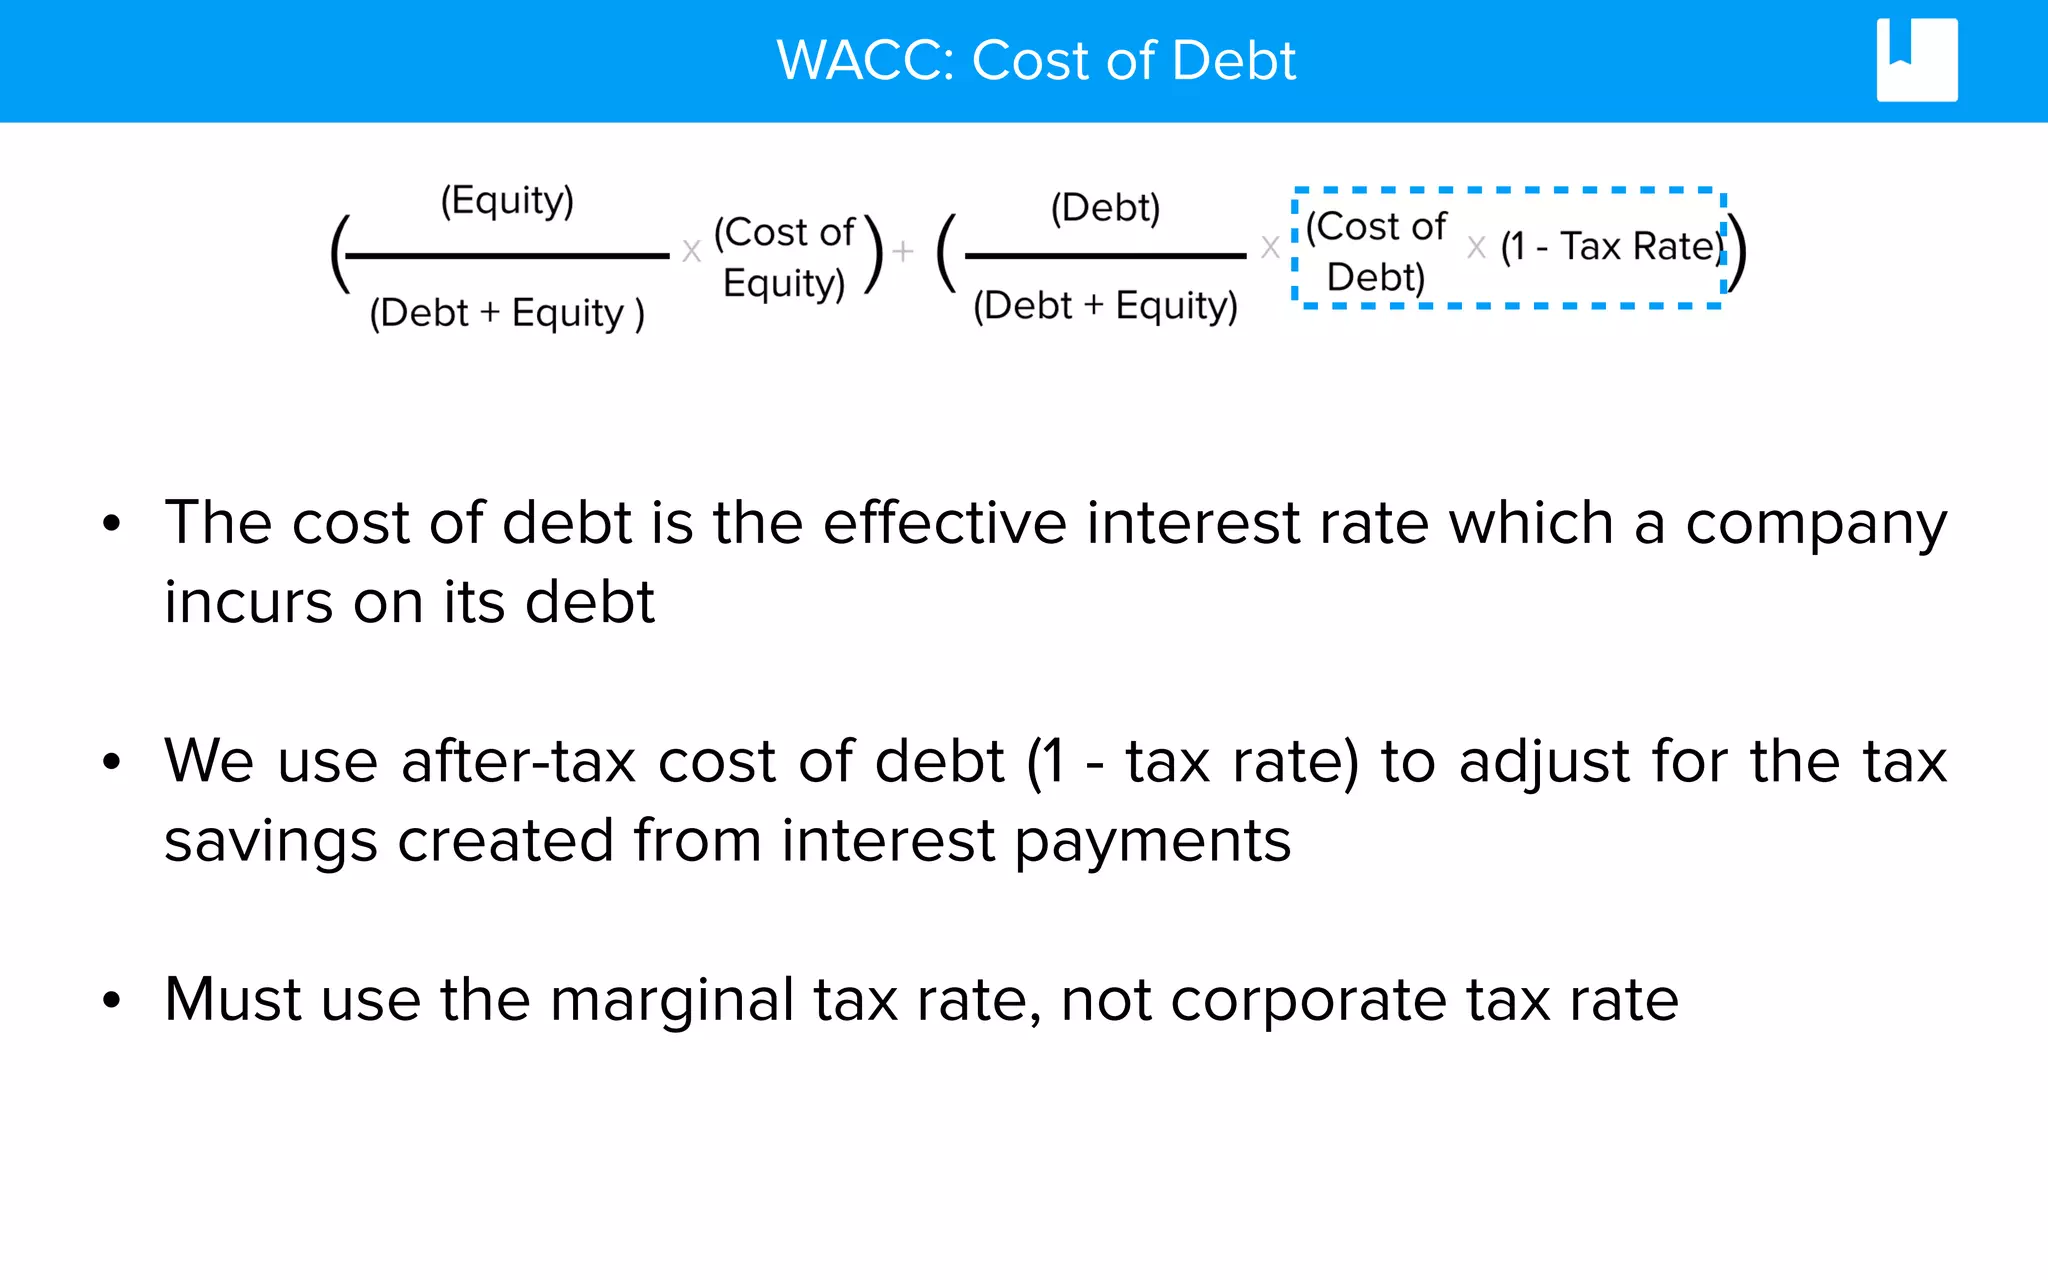
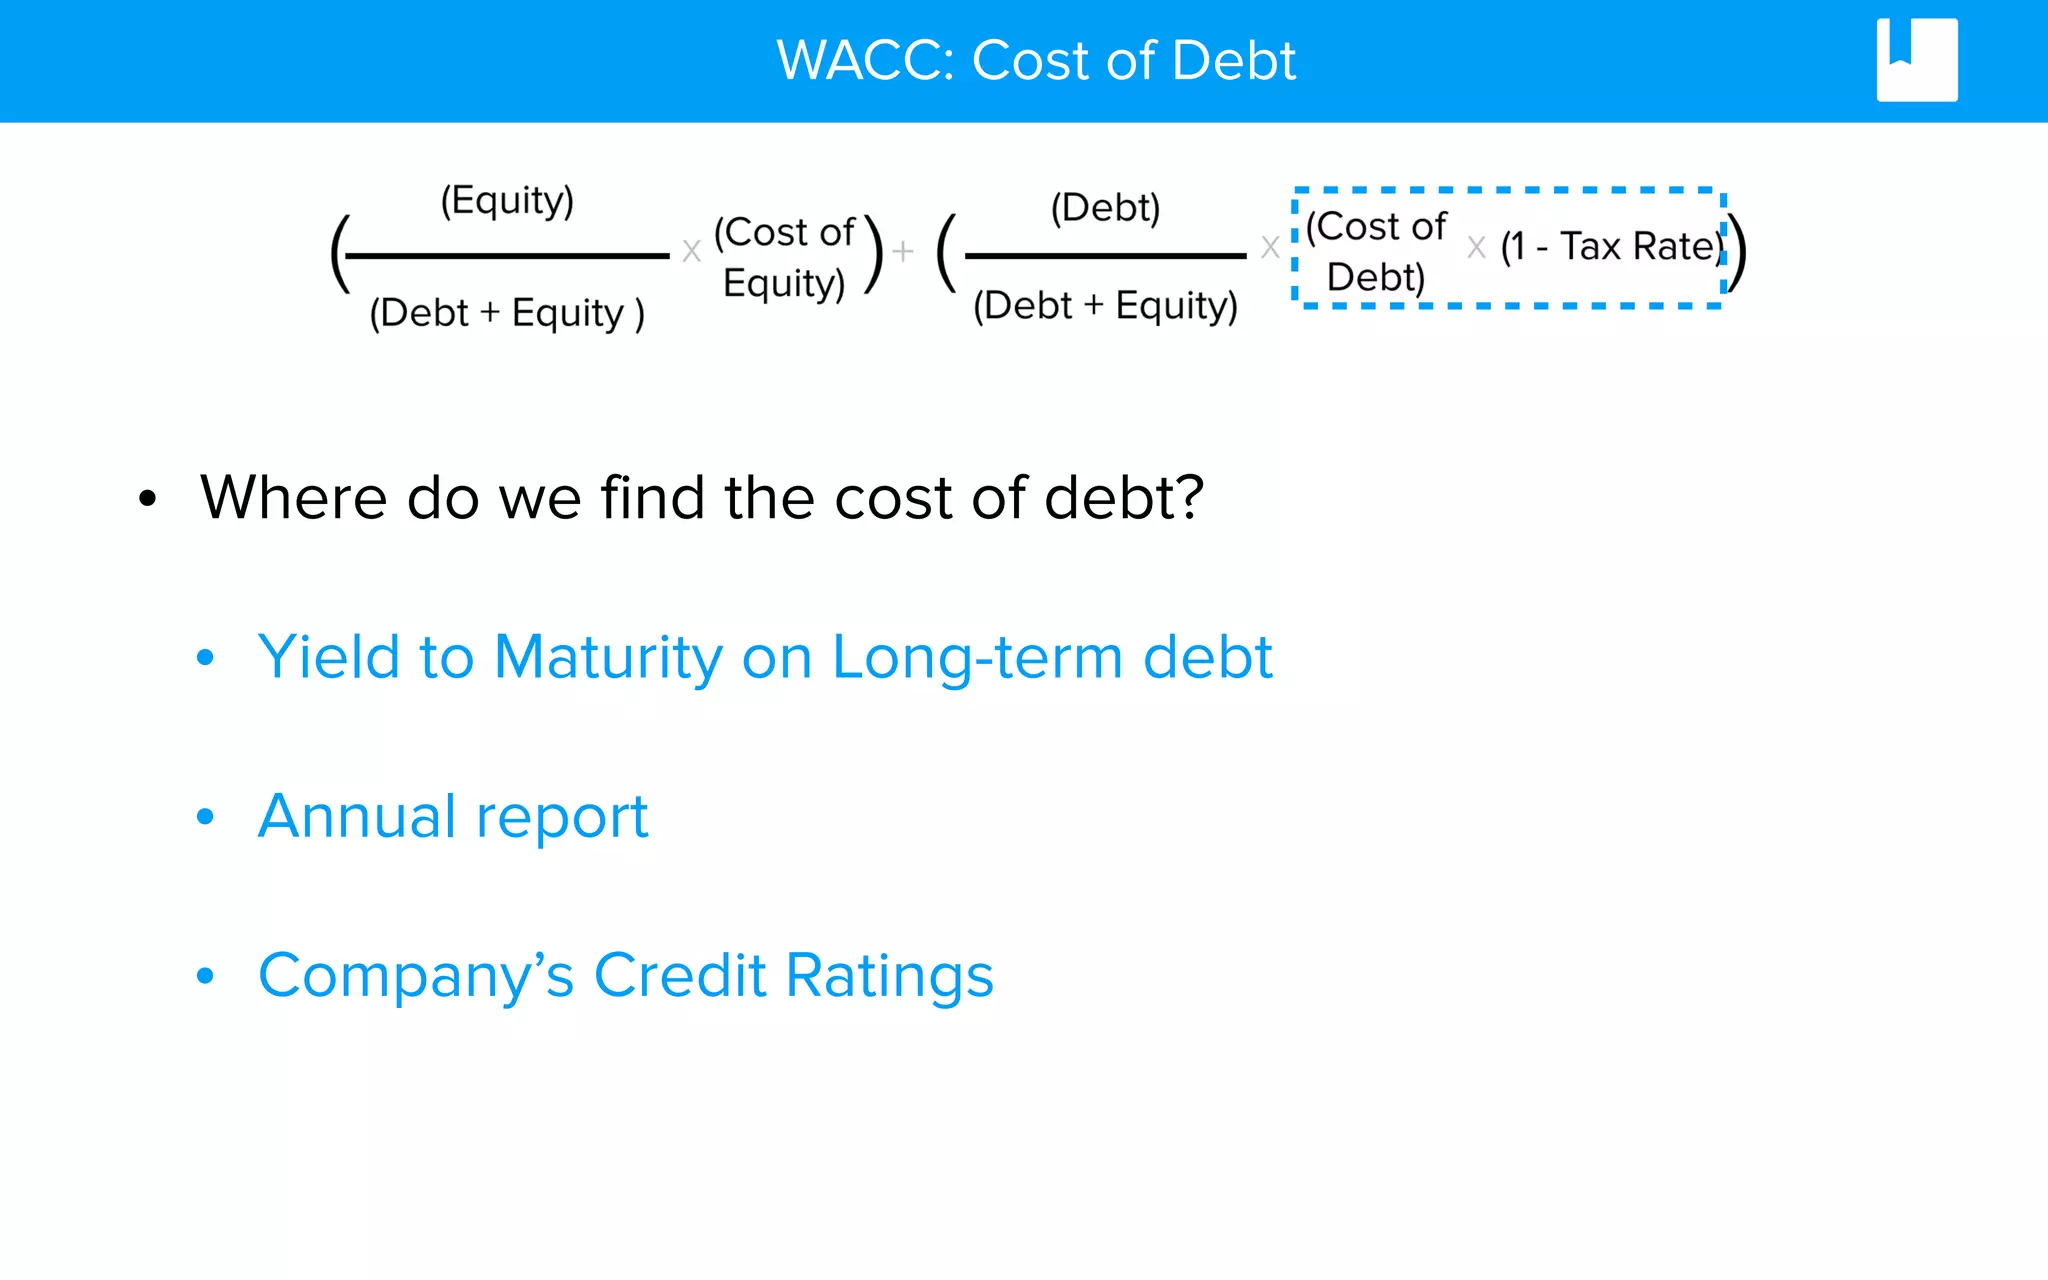
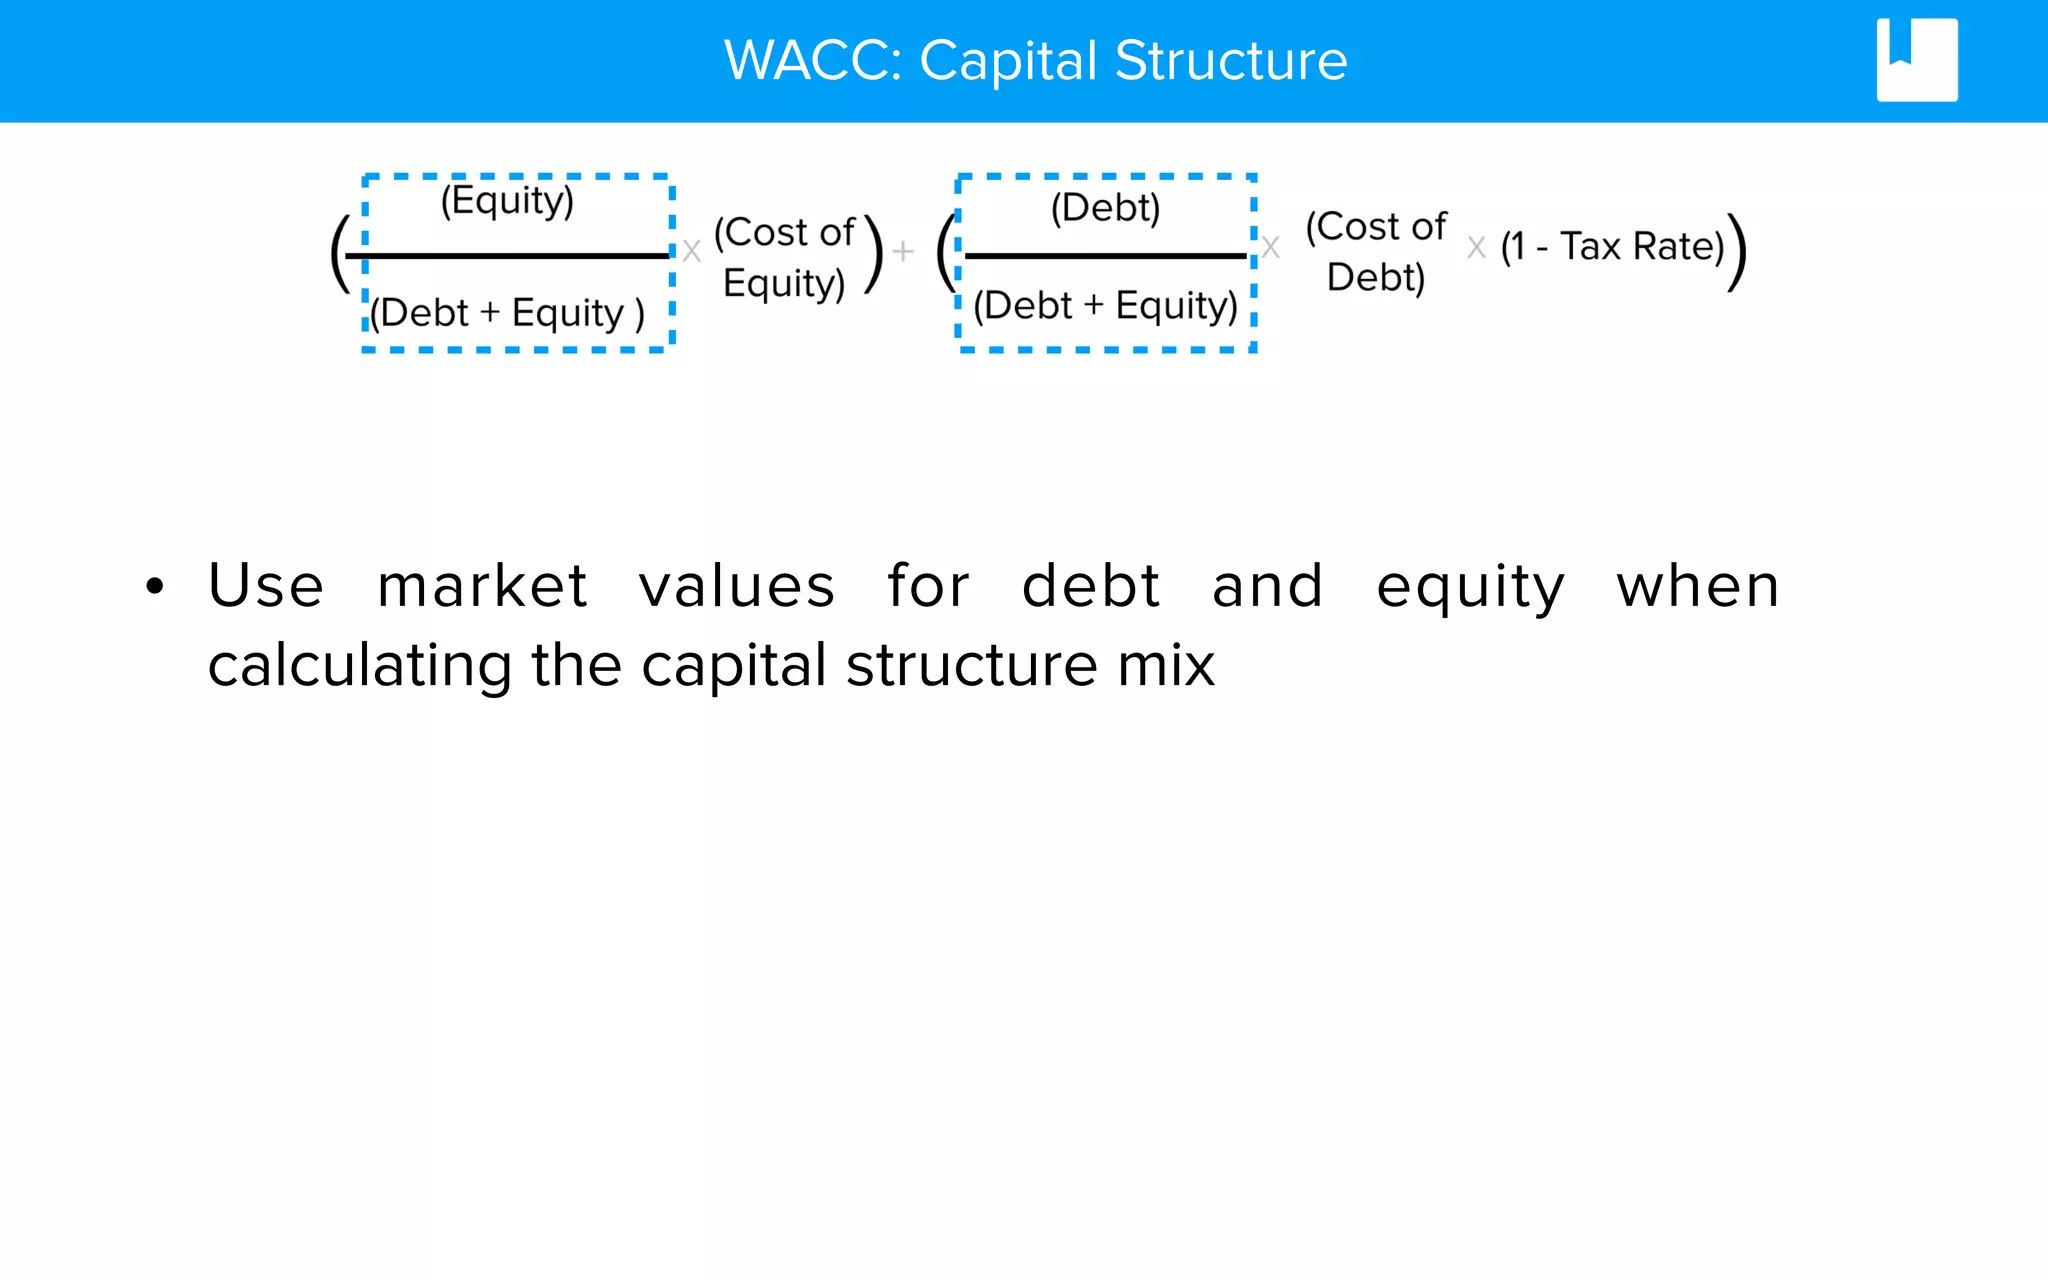
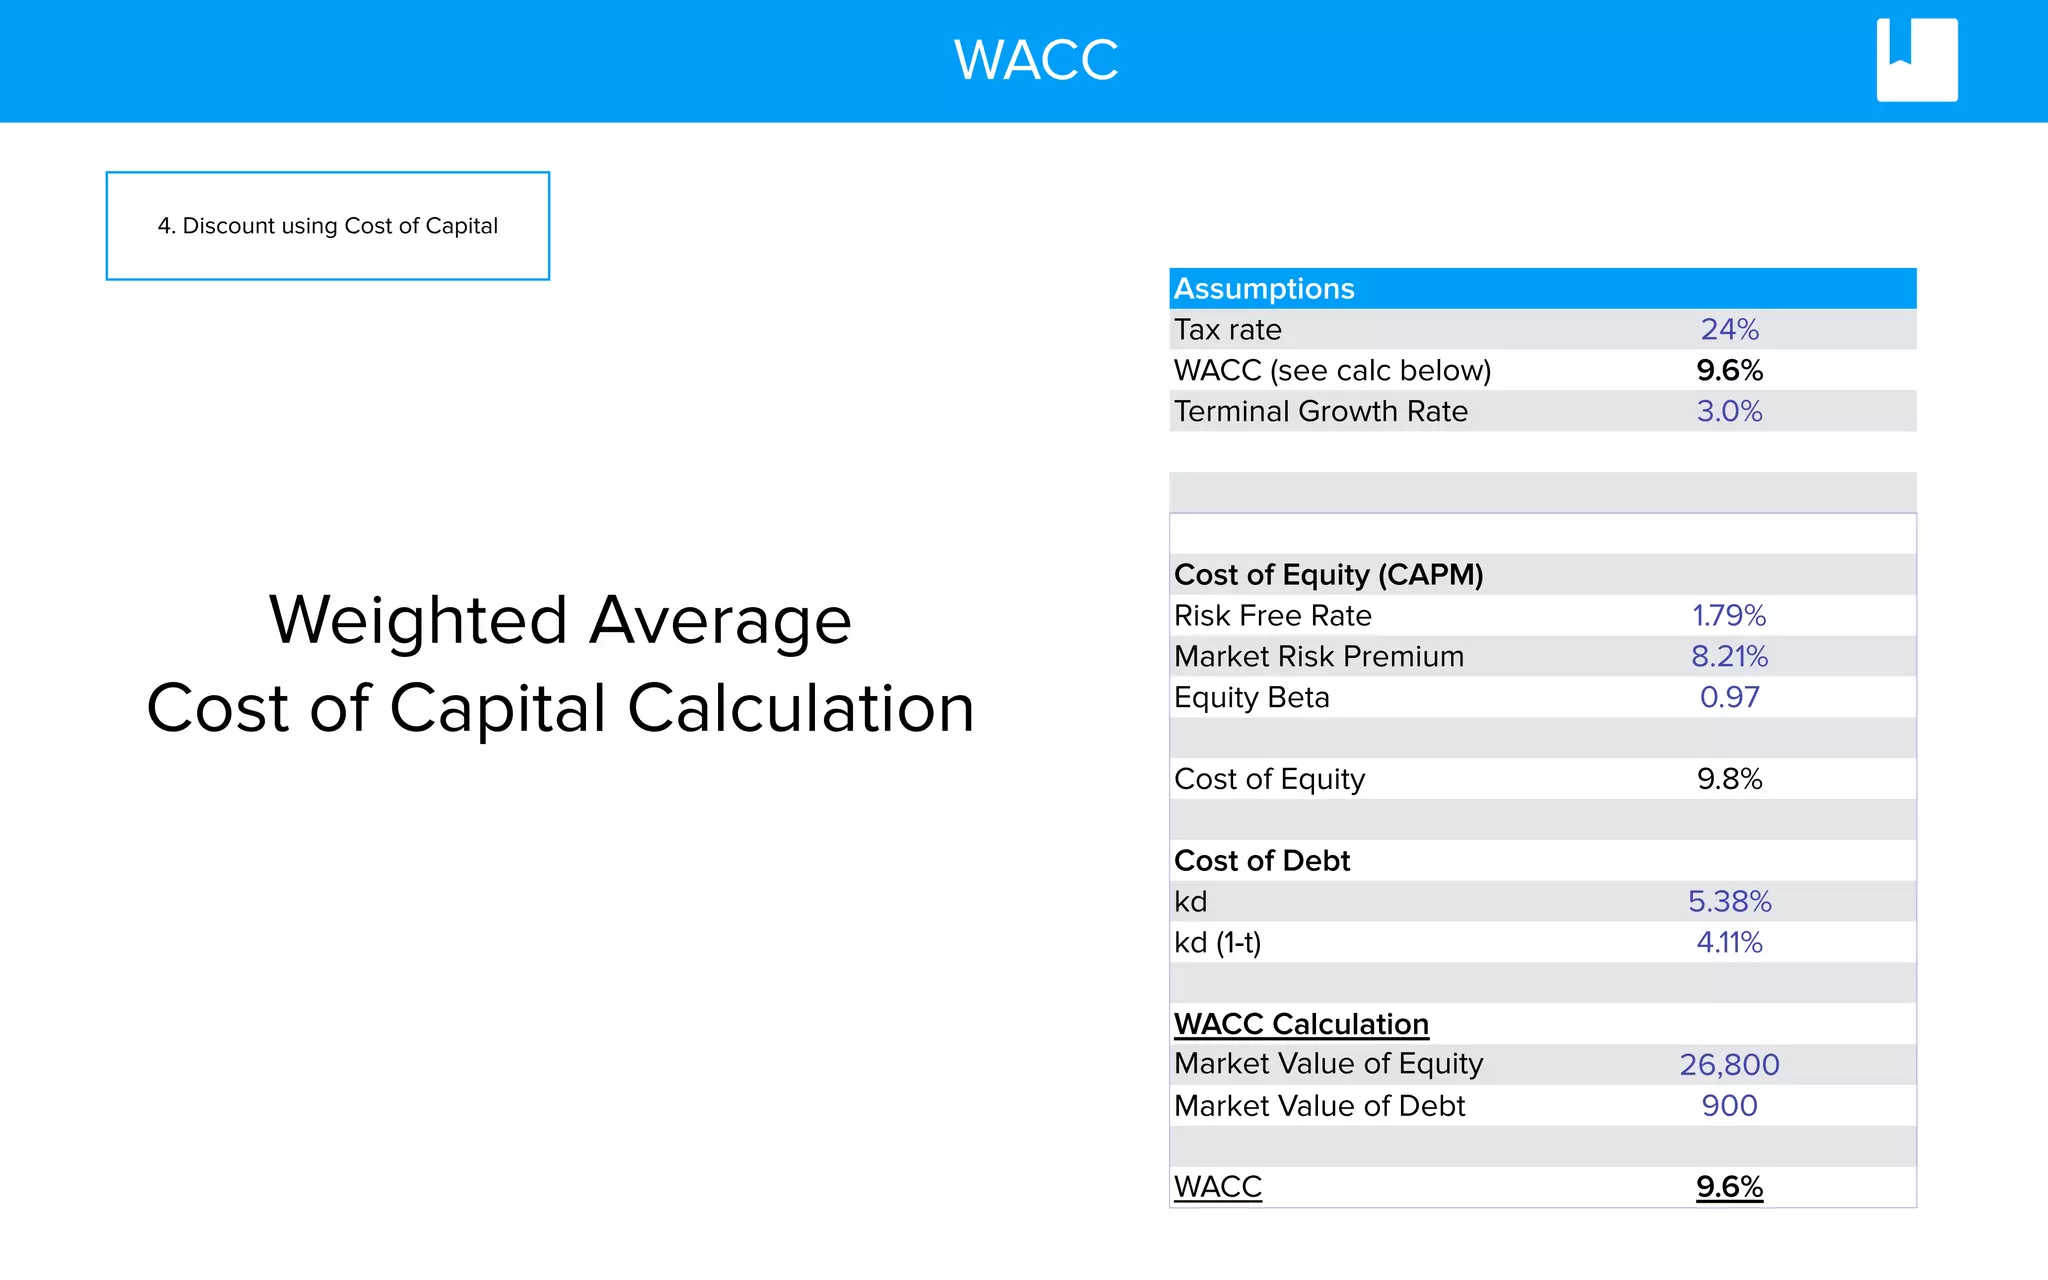
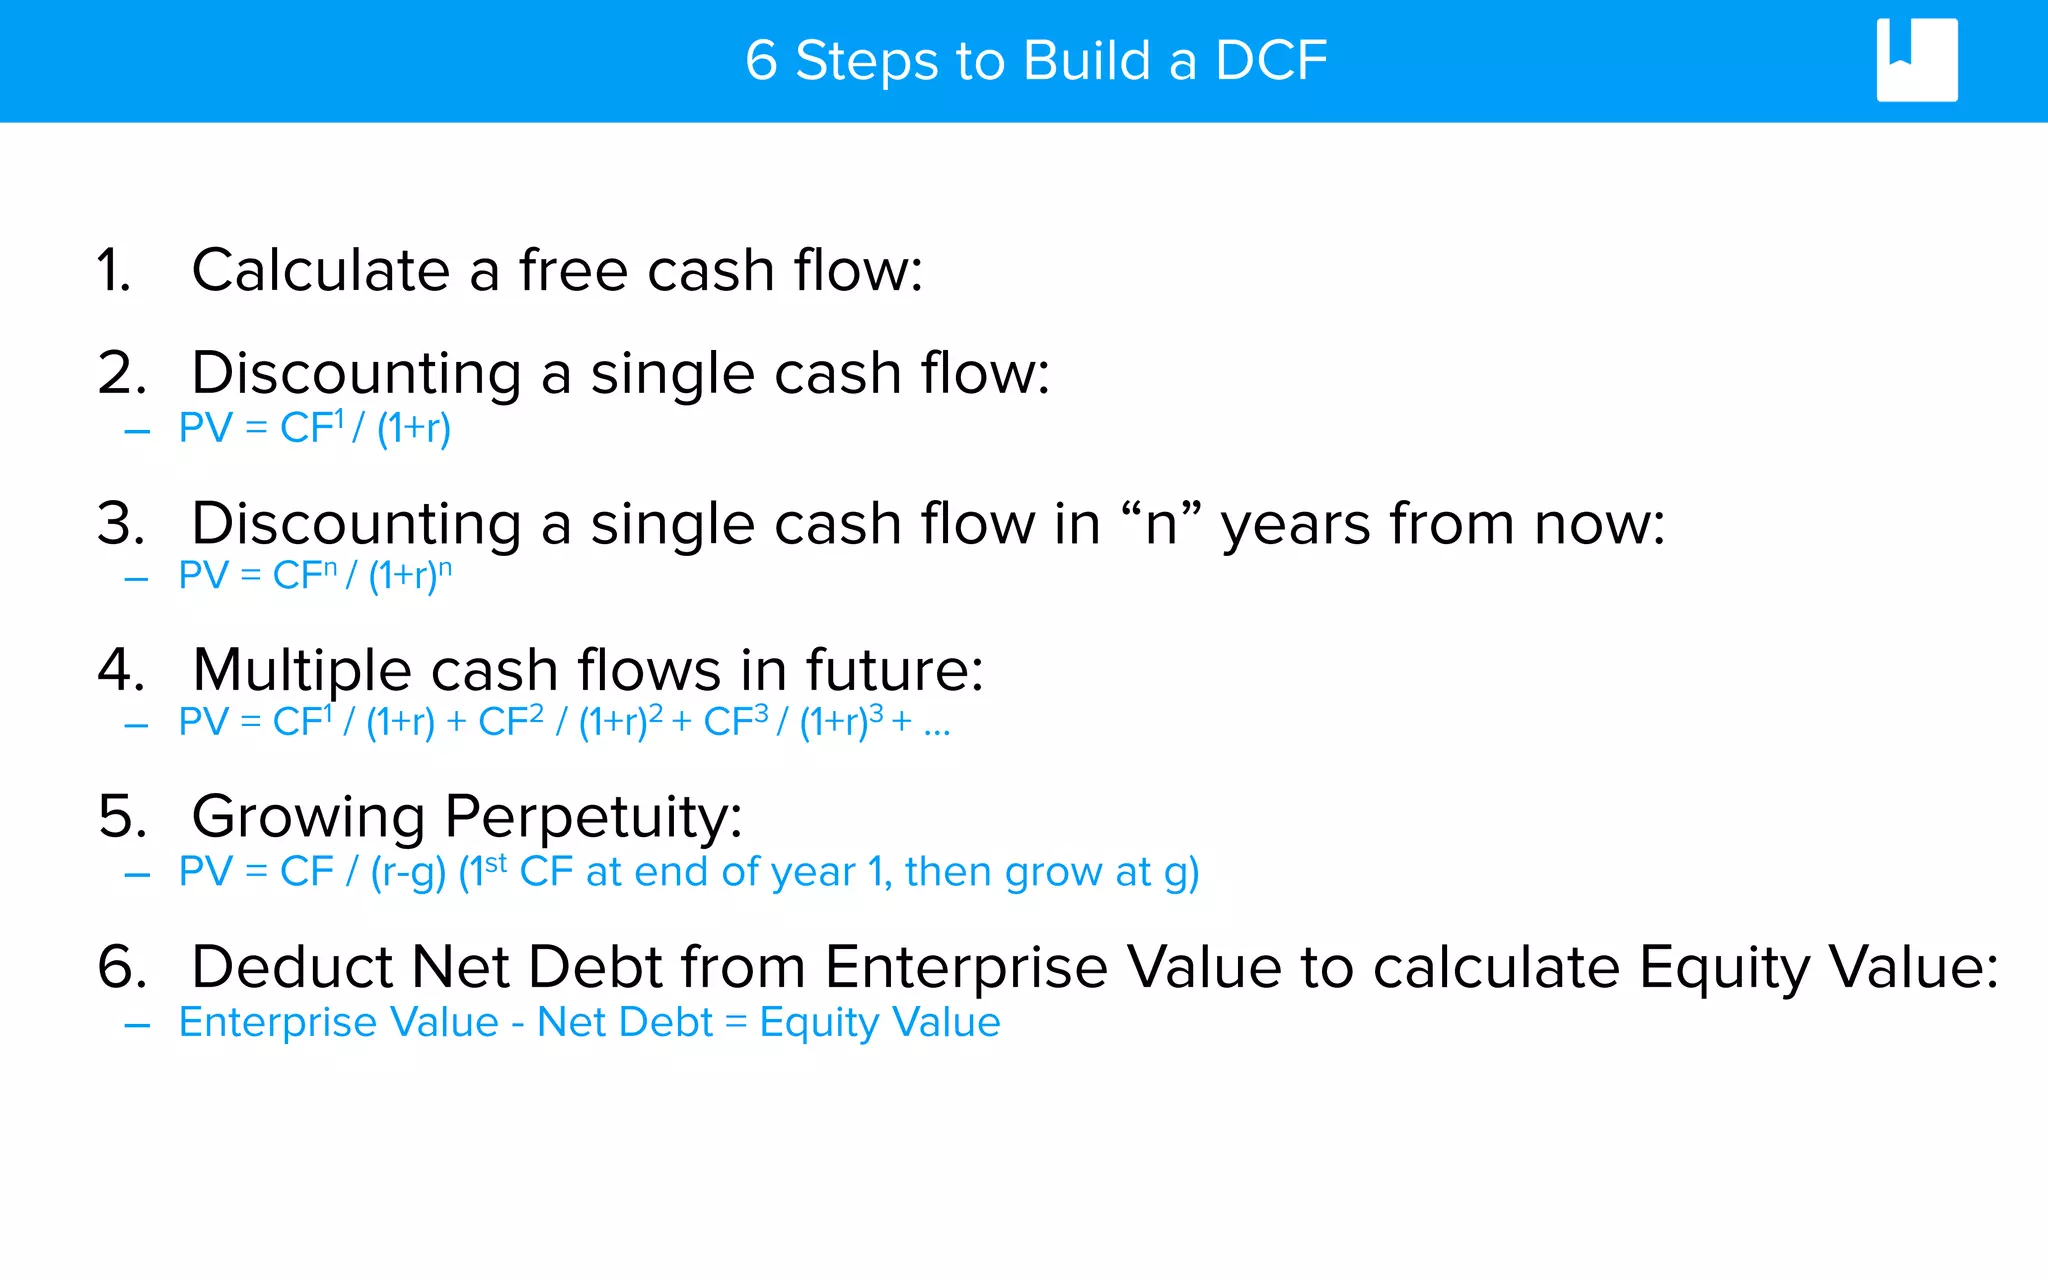
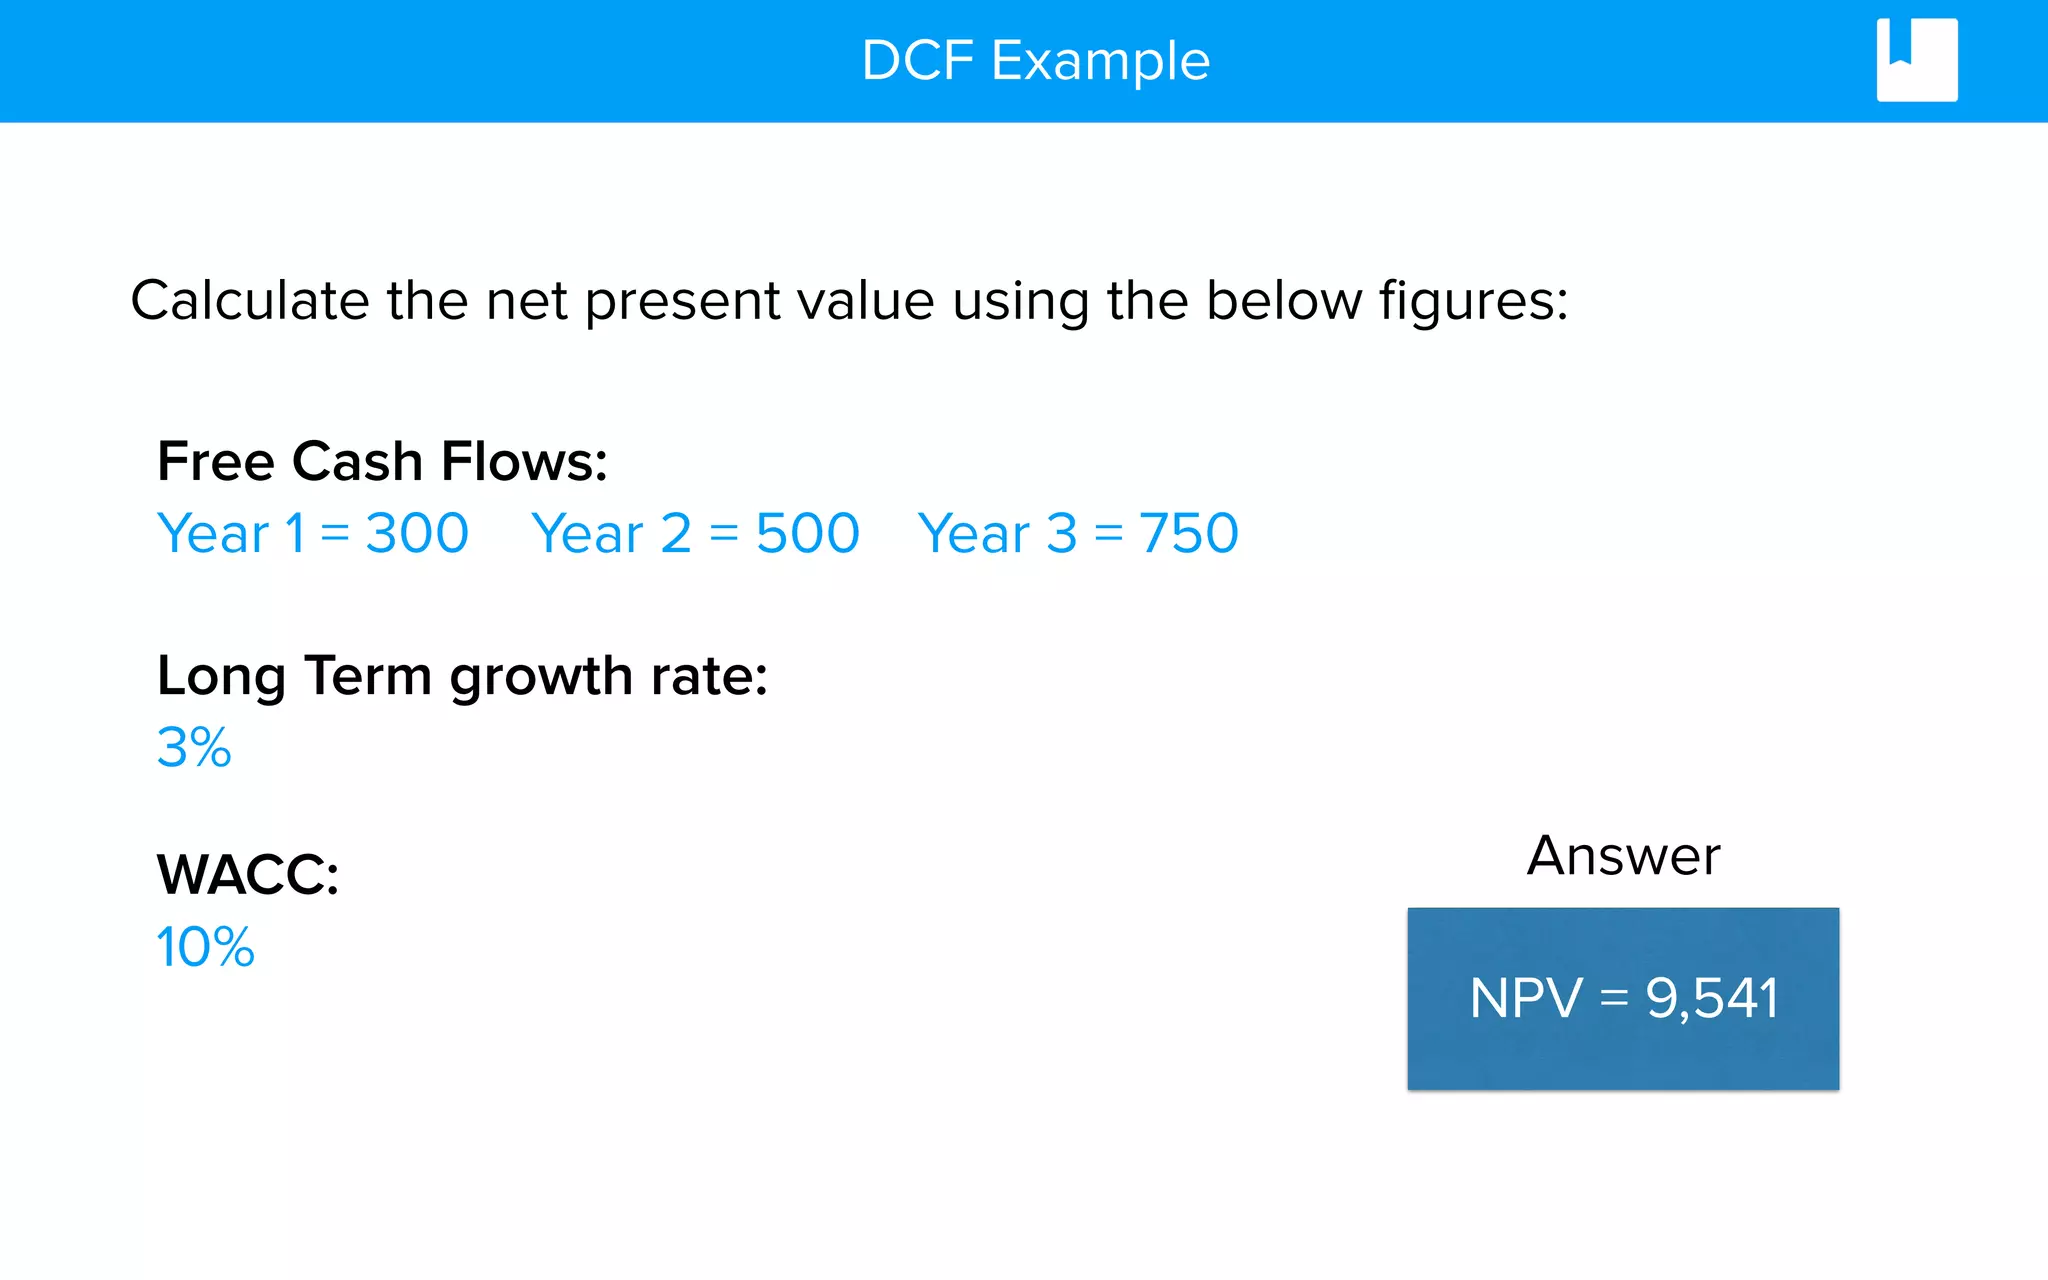
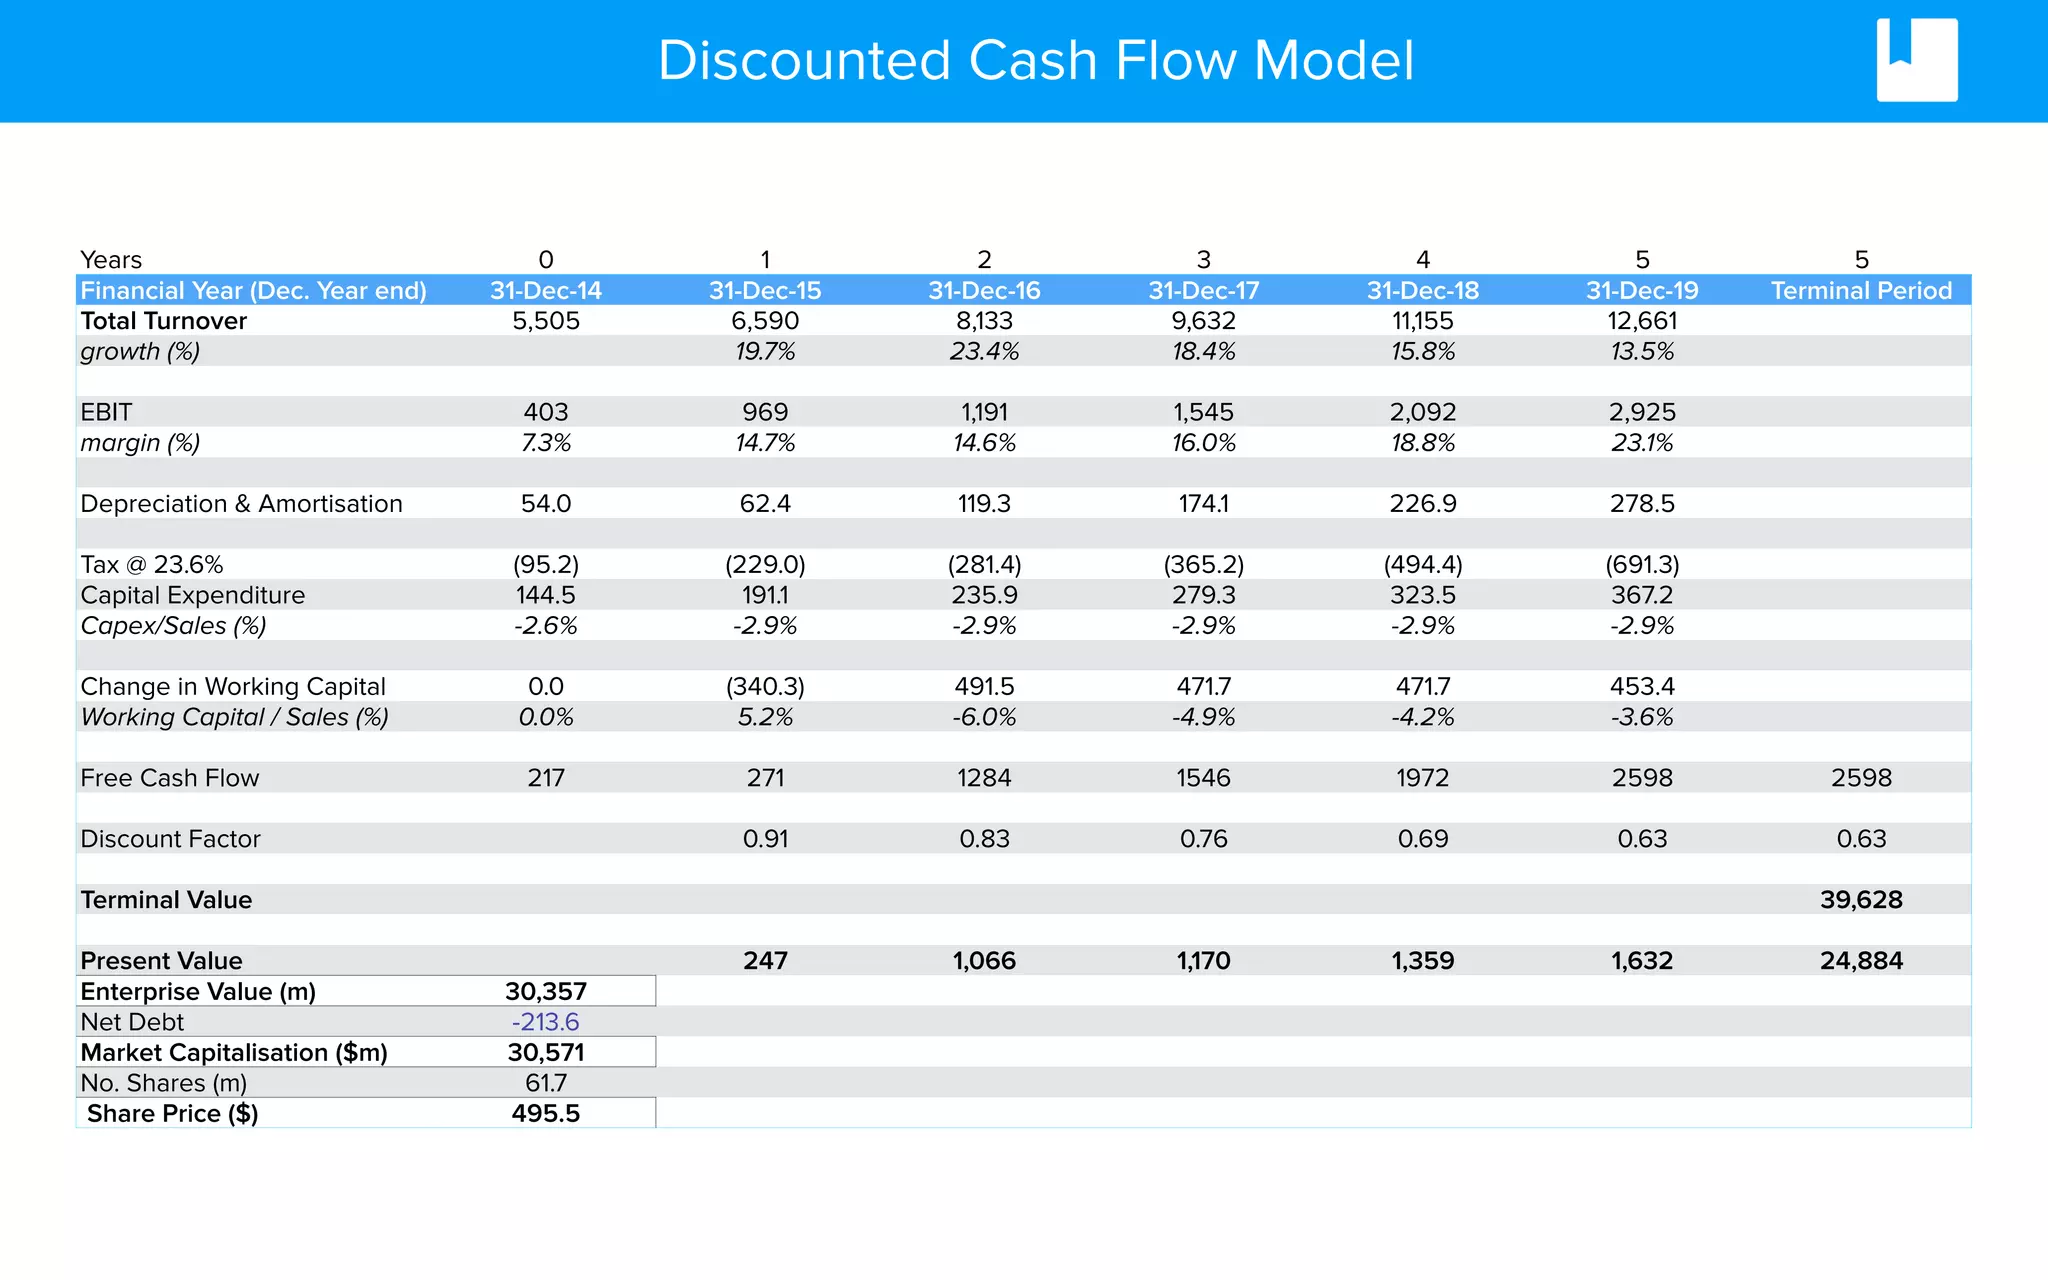
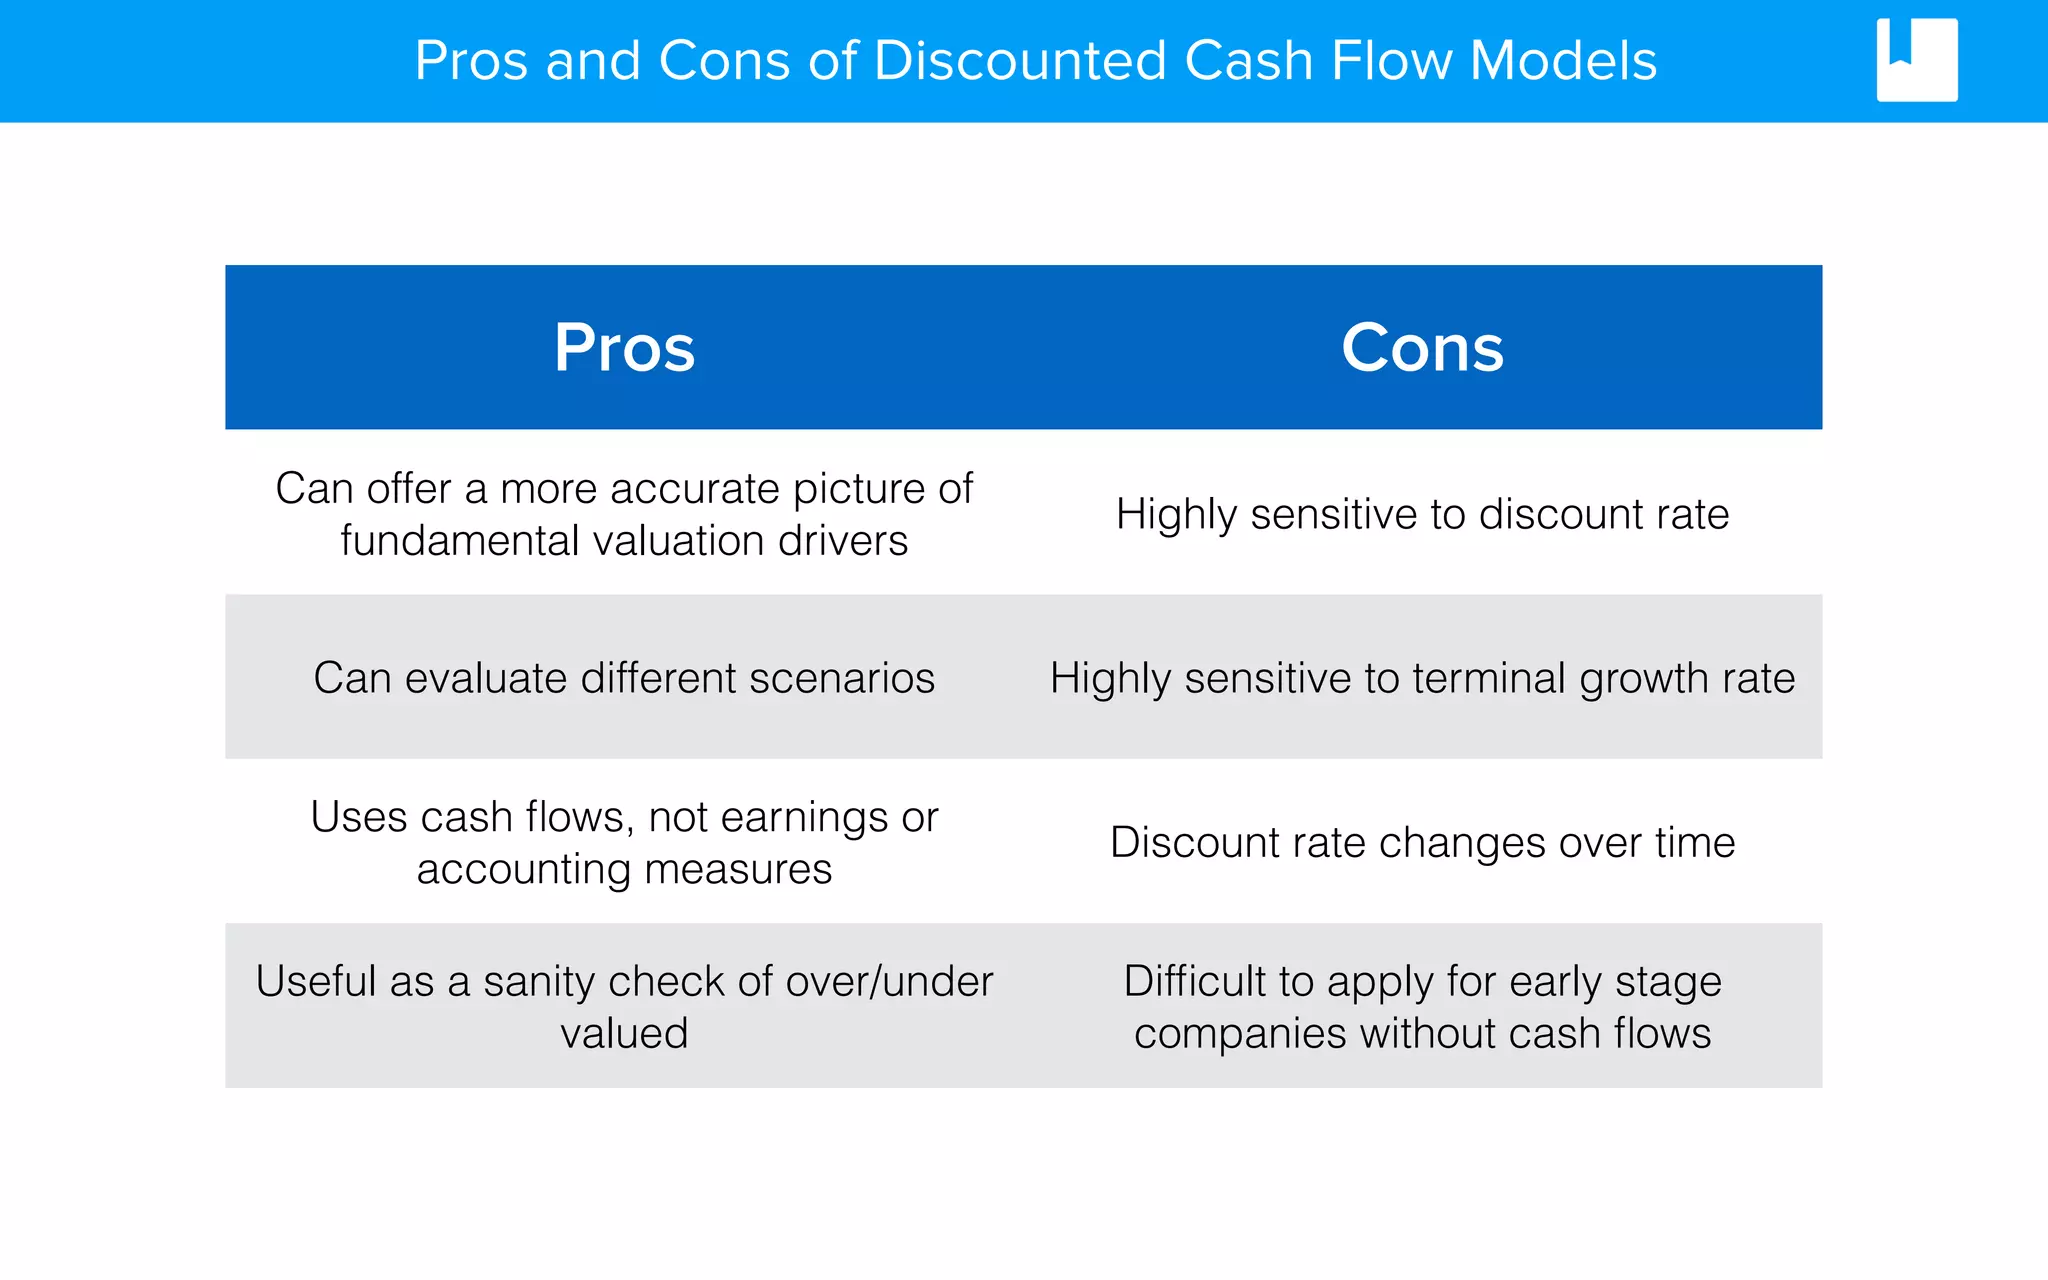
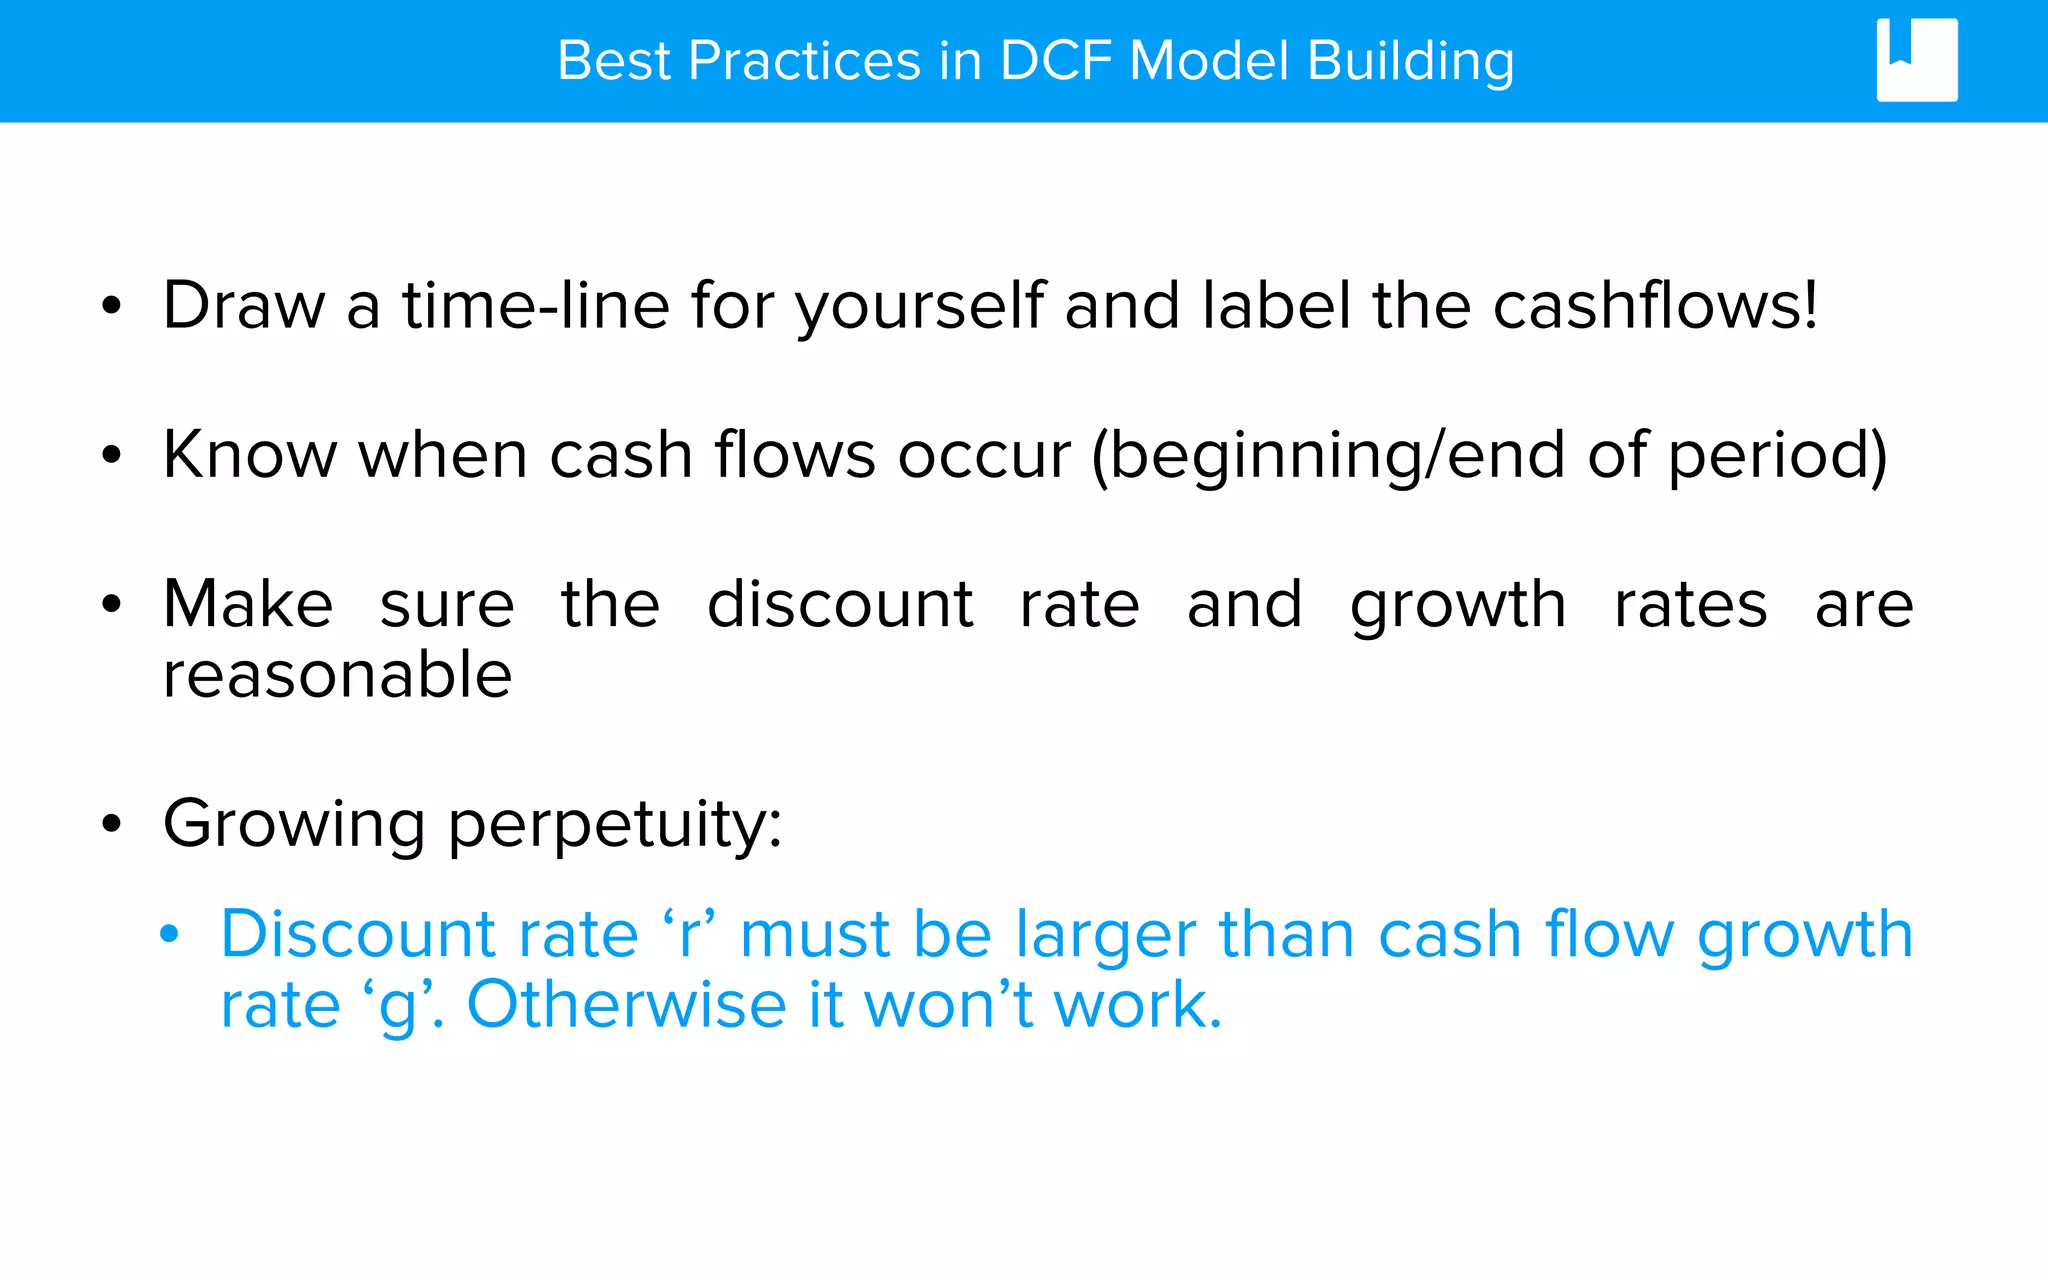
The Discounted Cash Flow Valuation Method
•Steps involved to build a DCF model from scratch
• Pros and Cons of the DCF valuation technique
• Best Practices in Model Building
Learning Outcomes
Discounted Cash Flow (DCF) valuation is a tool for
estimating the value of a company or its shares.
In summary: the expected value of an asset is the
present value of the forecast cash flows of an asset,
using a discount rate adjusted to reflect the risk.
Introduction
Steps to Build a DCF Model
1. Historical Performance
3. Calculate
Terminal Value
4. Discount using
Cost of Capital
2. Forecasting
5. Value the Company
Discounted Cash Flow Model
Years 0 1 2 3 4 5 5
Financial Year (Dec. 31-Dec-14 31-Dec-15 31-Dec-16 31-Dec-17 31-Dec-18 31-Dec-19 Terminal Period
Total Turnover 5,505 6,590 8,133 9,632 11,155 12,661
growth (%) 19.7% 23.4% 18.4% 15.8% 13.5%
EBIT 403 969 1,191 1,545 2,092 2,925
margin (%) 7.3% 14.7% 14.6% 16.0% 18.8% 23.1%
Depreciation &
Amortisation
54.0 62.4 119.3 174.1 226.9 278.5
Tax @ 23.6% (95.2) (229.0) (281.4) (365.2) (494.4) (691.3)
Capital Expenditure 144.5 191.1 235.9 279.3 323.5 367.2
Capex/Sales (%) -2.6% -2.9% -2.9% -2.9% -2.9% -2.9%
Change in Working
Capital
0.0 (340.3) 491.5 471.7 471.7 453.4
Working Capital /
Sales (%)
0.0% 5.2% -6.0% -4.9% -4.2% -3.6%
Free Cash Flow 217 271 1284 1546 1972 2598 2598
Discount Factor 0.91 0.83 0.76 0.69 0.63 0.63
Terminal Value 39,628
Present Value 247 1,066 1,170 1,359 1,632 24,884
Enterprise Value 30,357
Net Debt -213.6
Market 30,571
No. Shares (m) 61.7
Share Price ($) 495.5
Discounted Cash Flow Model
Assumptions
Tax rate 24%
WACC (see calc below) 9.6%
Terminal Growth Rate 3.0%
WACC
Cost of Equity (CAPM)
Risk Free Rate 1.79%
Market Risk Premium 8.21%
Equity Beta 0.97
Cost of Equity 9.8%
Cost of Debt
kd 5.38%
kd (1-t) 4.11%
WACC Calculation
Market Value of Equity
($m)
26,800
Market Value of Debt 900
WACC 9.6%
Weighted Average
Cost of Capital Calculation
Discounting Formula
Forecast Cash Flow
Discount Rate
Expected cash flows to be generated
in future years
Discount rate (%) reflects the risk and
uncertainty of cash flows
Higher discount rate —> Higher uncertainty
Simple Present Values
• Question: “How much would you be willing to pay to purchase
1 share in a company that will pay you a one-time cash flow of
£100 to be paid (with no risk) in one year?” Interest rate = 1.5%
• PV = CF1 / (1+r)
• PV = £100 / (1+0.015)
• PV = £98.52
• The valuation of a company requires discounting the
future ‘free’ cash flows to the present.
• ‘r’ indicates the appropriate cost of capital.
Valuation Using Free Cash Flows
• Free cash flow is the amount of cash that a company has left
over after it has paid all of its expenses, including capital
expenditures.
• Free cash flow is expressed as:
• Cash flow from operations - Capital Expenditures
• Free cash flow to the firm is the cash available to all investors,
both equity and debt holders.
Valuation Using Free Cash Flows
• Free cash flow generated by assets:
– Free Cash Flow = EBIT x (1 - Tax Rate)
» + Depreciation + Amortisation
» +/– Change in Operating Working Capital
» – Capital expenditure
How to Calculate Free Cash Flows
• Calculate the 2015 free cash flow for Wells PLC with the
following forecast figures:
– Operating Income: £200m
– Tax rate: 20%
– Depreciation: £80m
– Capital Expenditure: £40m
– Change in Operating Working Capital: -£15m
Question: How to Calculate Free Cash Flows
Answer: Free Cash Flow = £185m
Future Cash Flow and Risk
• What is the present value of a one-time riskless cash flow of
£100 to be paid in two years (Assume r = 1.5%)?
– Present Value = CF / (1+r)2
– Present Value = £100 / (1+0.015)2 = £97.07
• What if we are not certain that we will receive exactly £100 two
years from now?
Present Value of What Value? Equity or Enterprise?
1. Equity valuation:
– Forecast free cash flows available to equity holders.
– Discount expected cash flows by the cost of equity capital.
2. Enterprise valuation:
– Forecast cash flows available to all providers of capital (debt and equity).
– Discount expected cash flows by weighted average cost of (debt and
equity) capital.
– Calculate equity value by subtracting value of debt.
Historical Performance
• Look at the past
– Select appropriate time frame
– Historical revenue and profit growth
– Trends in gross, operating and profit margins
• Look for growth drivers
– How much is the firm investing in organic and inorganic growth (acquisitions)
– Are these investments making significant returns?
1. Historical Performance
Forecasting Performance
• The value of a business comes from two periods:
– Explicit forecast period
– Terminal value
• To develop forecasts, read industry reports, assess macroeconomic indicators
to determine (i) market demand (ii) investment required to meet that demand
and (iii) its related operating costs.
• Explicit forecast period reflects the time horizon that company can maintain
return on investment from its projects in excess of required return.
2. Forecasting
Multiple Cash Flows
• What if the firm will generate many cash flows at different times in the
future?
• PV = CF1 / (1+r) + CF2 / (1+r)2 + CF3 / (1+r)3 + …
• Example: Calculate the present value of three $10 cash flows paid at
end of year 1, year 2 and year 3. Assume a discount rate of 10%.
• PV = 10 / (1.10) + 10 / (1.10)2 + 10 / (1.10)3
• PV = 9.09 + 8.26 + 7.51 = $24.86
Valuation Formula
Discounting the explicit forecast period and terminal value:
Net Present Value =
FCF1
(1+WACC)1
FCF2
(1+WACC)2
FCFn
(1+WACC)n
TVn
(1+WACC)n
+ … +
Explicit Forecast Period
Terminal
Value
Perpetuity
• What if we received £10 a year forever?
• PV = CF1 / (1+r) + CF2 / (1+r)2 + CF3 / (1+r)3+…
• Formula for a perpetuity: PV = CF / r
• Used for calculating terminal values
Example: Value of Growing Perpetuity
Example:
• Calculate the present value of a cash flow stream that starts at £10 one
year from today, and then grows at a rate of 5% per year thereafter.
Assume a discount rate of 12%.
– PV = CF / (r-g)
– PV = 10 / (0.12-0.05)
– PV = £142.86
Calculate Terminal Value
3. Calculate Terminal Value
FCF x ( 1+g )
WACC - g
Terminal Value =
• Common assumption is a growing perpetuity
(hence the (‘1+g’ and ‘-g’)
FCF - Forecast free cash flow at end of
explicit forecast period
g - steady state growth rate
WACC - Weighted Average Cost of Capital
Calculate Terminal Value
3. Calculate Terminal Value
• Why (1+g)? - we need to discount cash flows which come
in at the end of the year, not the beginning
• How do we determine ‘g’?
• Normally above inflation.
• Lower than the explicit forecast period.
• Cannot exceed its return on equity in the long term.
Analysing ‘r’ - The Cost of Capital
• The cost of capital of a firm is also known as the ‘Weighted
Average Cost of Capital’ or WACC.
• As we know, a company has two sources of funds:
1. Equity
2. Debt
• WACC is the weighted average of the costs of these two
sources of capital.
4. Discount using Cost of Capital
Analysing ‘r’ - The Cost of Capital
• WACC is calculated as follows:
(Cost of
Debt)
x
(Debt)
(Debt + Equity)
+ (
(Equity)
(Debt + Equity )
( (Cost of
Equity)
x ) (1 - Tax Rate)x )
4. Discount using Cost of Capital
Calculating Cost of Equity using CAPM
• Two key applications of the Capital Asset Pricing
Model (CAPM):
1. Measures and quantifies risk
– One stock is riskier than another if it has a higher Beta.
2. Valuation
– Used to measure cost of capital when finding the discount
rate
Cost of Equity
• CAPM: the standard approach to estimating cost of equity:
=Cost of Equity Risk Free Rate + Relative Risk
Measure
x Market Risk
Premium
4. Discount using Cost of Capital
Cost of Equity
• The return on any investment with such low risk that the risk
is considered to not exist.
• Usually the yield on a 10-year government bond.
=Cost of Equity Risk Free Rate + Relative Risk
Measure
x Market Risk
Premium
Cost of Equity
• Market risk premium is the average return on the market
minus the risk free rate
• Investors need to be compensated for the additional risk of
investing in stocks
=Cost of Equity Risk Free Rate + Relative Risk
Measure
x Market Risk
Premium
Cost of Equity
• Known as ‘Beta’ - Measures the volatility of a company’s
stock price to changes in the broader market
• Beta = 1 indicates the stock price moves in line with the
market
• Beta > 1 Stock price is more volatile than the market
=Cost of Equity Risk Free Rate + Relative Risk
Measure
x Market Risk
Premium
Cost of Equity
Question
What does Beta = 0 indicate?
WACC: Cost of Equity
• In the real world:
– Government security rates are used as risk free rates
– Historical risk premiums are used for the risk premium
– Betas are estimated by regressing stock returns against market returns
4. Discount using Cost of Capital
WACC: Cost of Debt
• The cost of debt is the effective interest rate which a company
incurs on its debt
• We use after-tax cost of debt (1 - tax rate) to adjust for the tax
savings created from interest payments
• Must use the marginal tax rate, not corporate tax rate
WACC: Cost of Debt
• Where do we find the cost of debt?
• Yield to Maturity on Long-term debt
• Annual report
• Company’s Credit Ratings
WACC: Capital Structure
• Use market values for debt and equity when
calculating the capital structure mix
WACC
Assumptions
Tax rate 24%
WACC (see calc below) 9.6%
Terminal Growth Rate 3.0%
WACC
Cost of Equity (CAPM)
Risk Free Rate 1.79%
Market Risk Premium 8.21%
Equity Beta 0.97
Cost of Equity 9.8%
Cost of Debt
kd 5.38%
kd (1-t) 4.11%
WACC Calculation
Market Value of Equity
($m)
26,800
Market Value of Debt 900
WACC 9.6%
Weighted Average
Cost of Capital Calculation
4. Discount using Cost of Capital
6 Steps to Build a DCF
1. Calculate a free cash flow:
2. Discounting a single cash flow:
– PV = CF1 / (1+r)
3. Discounting a single cash flow in “n” years from now:
– PV = CFn / (1+r)n
4. Multiple cash flows in future:
– PV = CF1 / (1+r) + CF2 / (1+r)2 + CF3 / (1+r)3 + …
5. Growing Perpetuity:
– PV = CF / (r-g) (1st CF at end of year 1, then grow at g)
6. Deduct Net Debt from Enterprise Value to calculate Equity Value:
– Enterprise Value - Net Debt = Equity Value
DCF Example
Calculate the net present value using the below figures:
Free Cash Flows:
Year 1 = 300 Year 3 = 750Year 2 = 500
Long Term growth rate:
3%
WACC:
10%
NPV = 9,541
Answer
Discounted Cash Flow Model
Years 0 1 2 3 4 5 5
Financial Year (Dec. Year end) 31-Dec-14 31-Dec-15 31-Dec-16 31-Dec-17 31-Dec-18 31-Dec-19 Terminal Period
Total Turnover 5,505 6,590 8,133 9,632 11,155 12,661
growth (%) 19.7% 23.4% 18.4% 15.8% 13.5%
EBIT 403 969 1,191 1,545 2,092 2,925
margin (%) 7.3% 14.7% 14.6% 16.0% 18.8% 23.1%
Depreciation & Amortisation 54.0 62.4 119.3 174.1 226.9 278.5
Tax @ 23.6% (95.2) (229.0) (281.4) (365.2) (494.4) (691.3)
Capital Expenditure 144.5 191.1 235.9 279.3 323.5 367.2
Capex/Sales (%) -2.6% -2.9% -2.9% -2.9% -2.9% -2.9%
Change in Working Capital 0.0 (340.3) 491.5 471.7 471.7 453.4
Working Capital / Sales (%) 0.0% 5.2% -6.0% -4.9% -4.2% -3.6%
Free Cash Flow 217 271 1284 1546 1972 2598 2598
Discount Factor 0.91 0.83 0.76 0.69 0.63 0.63
Terminal Value 39,628
Present Value 247 1,066 1,170 1,359 1,632 24,884
Enterprise Value (m) 30,357
Net Debt -213.6
Market Capitalisation ($m) 30,571
No. Shares (m) 61.7
Share Price ($) 495.5
Pros and Cons of Discounted Cash Flow Models
Pros Cons
Can offer a more accurate picture of
fundamental valuation drivers
Highly sensitive to discount rate
Can evaluate different scenarios Highly sensitive to terminal growth rate
Uses cash flows, not earnings or
accounting measures
Discount rate changes over time
Useful as a sanity check of over/under
valued
Difficult to apply for early stage
companies without cash flows
Best Practices in DCF Model Building
• Draw a time-line for yourself and label the cashflows!
• Know when cash flows occur (beginning/end of period)
• Make sure the discount rate and growth rates are
reasonable
• Growing perpetuity:
• Discount rate ‘r’ must be larger than cash flow growth
rate ‘g’. Otherwise it won’t work.
Recap
• Steps to build a Discounted cash flow model
• Determining the explicit forecast period
• Calculating the terminal value
• How to calculate the discount rate
• Value a company using a DCF Model

BlueBookAcademy.com - Value companies using Discounted Cash Flow Valuation

  • 1.
    The Discounted CashFlow Valuation Method
  • 2.
    •Steps involved tobuild a DCF model from scratch • Pros and Cons of the DCF valuation technique • Best Practices in Model Building Learning Outcomes
  • 3.
    Discounted Cash Flow(DCF) valuation is a tool for estimating the value of a company or its shares. In summary: the expected value of an asset is the present value of the forecast cash flows of an asset, using a discount rate adjusted to reflect the risk. Introduction
  • 4.
    Steps to Builda DCF Model 1. Historical Performance 3. Calculate Terminal Value 4. Discount using Cost of Capital 2. Forecasting 5. Value the Company
  • 5.
    Discounted Cash FlowModel Years 0 1 2 3 4 5 5 Financial Year (Dec. 31-Dec-14 31-Dec-15 31-Dec-16 31-Dec-17 31-Dec-18 31-Dec-19 Terminal Period Total Turnover 5,505 6,590 8,133 9,632 11,155 12,661 growth (%) 19.7% 23.4% 18.4% 15.8% 13.5% EBIT 403 969 1,191 1,545 2,092 2,925 margin (%) 7.3% 14.7% 14.6% 16.0% 18.8% 23.1% Depreciation & Amortisation 54.0 62.4 119.3 174.1 226.9 278.5 Tax @ 23.6% (95.2) (229.0) (281.4) (365.2) (494.4) (691.3) Capital Expenditure 144.5 191.1 235.9 279.3 323.5 367.2 Capex/Sales (%) -2.6% -2.9% -2.9% -2.9% -2.9% -2.9% Change in Working Capital 0.0 (340.3) 491.5 471.7 471.7 453.4 Working Capital / Sales (%) 0.0% 5.2% -6.0% -4.9% -4.2% -3.6% Free Cash Flow 217 271 1284 1546 1972 2598 2598 Discount Factor 0.91 0.83 0.76 0.69 0.63 0.63 Terminal Value 39,628 Present Value 247 1,066 1,170 1,359 1,632 24,884 Enterprise Value 30,357 Net Debt -213.6 Market 30,571 No. Shares (m) 61.7 Share Price ($) 495.5
  • 6.
    Discounted Cash FlowModel Assumptions Tax rate 24% WACC (see calc below) 9.6% Terminal Growth Rate 3.0% WACC Cost of Equity (CAPM) Risk Free Rate 1.79% Market Risk Premium 8.21% Equity Beta 0.97 Cost of Equity 9.8% Cost of Debt kd 5.38% kd (1-t) 4.11% WACC Calculation Market Value of Equity ($m) 26,800 Market Value of Debt 900 WACC 9.6% Weighted Average Cost of Capital Calculation
  • 7.
    Discounting Formula Forecast CashFlow Discount Rate Expected cash flows to be generated in future years Discount rate (%) reflects the risk and uncertainty of cash flows Higher discount rate —> Higher uncertainty
  • 8.
    Simple Present Values •Question: “How much would you be willing to pay to purchase 1 share in a company that will pay you a one-time cash flow of £100 to be paid (with no risk) in one year?” Interest rate = 1.5% • PV = CF1 / (1+r) • PV = £100 / (1+0.015) • PV = £98.52
  • 9.
    • The valuationof a company requires discounting the future ‘free’ cash flows to the present. • ‘r’ indicates the appropriate cost of capital. Valuation Using Free Cash Flows
  • 10.
    • Free cashflow is the amount of cash that a company has left over after it has paid all of its expenses, including capital expenditures. • Free cash flow is expressed as: • Cash flow from operations - Capital Expenditures • Free cash flow to the firm is the cash available to all investors, both equity and debt holders. Valuation Using Free Cash Flows
  • 11.
    • Free cashflow generated by assets: – Free Cash Flow = EBIT x (1 - Tax Rate) » + Depreciation + Amortisation » +/– Change in Operating Working Capital » – Capital expenditure How to Calculate Free Cash Flows
  • 12.
    • Calculate the2015 free cash flow for Wells PLC with the following forecast figures: – Operating Income: £200m – Tax rate: 20% – Depreciation: £80m – Capital Expenditure: £40m – Change in Operating Working Capital: -£15m Question: How to Calculate Free Cash Flows Answer: Free Cash Flow = £185m
  • 13.
    Future Cash Flowand Risk • What is the present value of a one-time riskless cash flow of £100 to be paid in two years (Assume r = 1.5%)? – Present Value = CF / (1+r)2 – Present Value = £100 / (1+0.015)2 = £97.07 • What if we are not certain that we will receive exactly £100 two years from now?
  • 14.
    Present Value ofWhat Value? Equity or Enterprise? 1. Equity valuation: – Forecast free cash flows available to equity holders. – Discount expected cash flows by the cost of equity capital. 2. Enterprise valuation: – Forecast cash flows available to all providers of capital (debt and equity). – Discount expected cash flows by weighted average cost of (debt and equity) capital. – Calculate equity value by subtracting value of debt.
  • 15.
    Historical Performance • Lookat the past – Select appropriate time frame – Historical revenue and profit growth – Trends in gross, operating and profit margins • Look for growth drivers – How much is the firm investing in organic and inorganic growth (acquisitions) – Are these investments making significant returns? 1. Historical Performance
  • 16.
    Forecasting Performance • Thevalue of a business comes from two periods: – Explicit forecast period – Terminal value • To develop forecasts, read industry reports, assess macroeconomic indicators to determine (i) market demand (ii) investment required to meet that demand and (iii) its related operating costs. • Explicit forecast period reflects the time horizon that company can maintain return on investment from its projects in excess of required return. 2. Forecasting
  • 17.
    Multiple Cash Flows •What if the firm will generate many cash flows at different times in the future? • PV = CF1 / (1+r) + CF2 / (1+r)2 + CF3 / (1+r)3 + … • Example: Calculate the present value of three $10 cash flows paid at end of year 1, year 2 and year 3. Assume a discount rate of 10%. • PV = 10 / (1.10) + 10 / (1.10)2 + 10 / (1.10)3 • PV = 9.09 + 8.26 + 7.51 = $24.86
  • 18.
    Valuation Formula Discounting theexplicit forecast period and terminal value: Net Present Value = FCF1 (1+WACC)1 FCF2 (1+WACC)2 FCFn (1+WACC)n TVn (1+WACC)n + … + Explicit Forecast Period Terminal Value
  • 19.
    Perpetuity • What ifwe received £10 a year forever? • PV = CF1 / (1+r) + CF2 / (1+r)2 + CF3 / (1+r)3+… • Formula for a perpetuity: PV = CF / r • Used for calculating terminal values
  • 20.
    Example: Value ofGrowing Perpetuity Example: • Calculate the present value of a cash flow stream that starts at £10 one year from today, and then grows at a rate of 5% per year thereafter. Assume a discount rate of 12%. – PV = CF / (r-g) – PV = 10 / (0.12-0.05) – PV = £142.86
  • 21.
    Calculate Terminal Value 3.Calculate Terminal Value FCF x ( 1+g ) WACC - g Terminal Value = • Common assumption is a growing perpetuity (hence the (‘1+g’ and ‘-g’) FCF - Forecast free cash flow at end of explicit forecast period g - steady state growth rate WACC - Weighted Average Cost of Capital
  • 22.
    Calculate Terminal Value 3.Calculate Terminal Value • Why (1+g)? - we need to discount cash flows which come in at the end of the year, not the beginning • How do we determine ‘g’? • Normally above inflation. • Lower than the explicit forecast period. • Cannot exceed its return on equity in the long term.
  • 23.
    Analysing ‘r’ -The Cost of Capital • The cost of capital of a firm is also known as the ‘Weighted Average Cost of Capital’ or WACC. • As we know, a company has two sources of funds: 1. Equity 2. Debt • WACC is the weighted average of the costs of these two sources of capital. 4. Discount using Cost of Capital
  • 24.
    Analysing ‘r’ -The Cost of Capital • WACC is calculated as follows: (Cost of Debt) x (Debt) (Debt + Equity) + ( (Equity) (Debt + Equity ) ( (Cost of Equity) x ) (1 - Tax Rate)x ) 4. Discount using Cost of Capital
  • 25.
    Calculating Cost ofEquity using CAPM • Two key applications of the Capital Asset Pricing Model (CAPM): 1. Measures and quantifies risk – One stock is riskier than another if it has a higher Beta. 2. Valuation – Used to measure cost of capital when finding the discount rate
  • 26.
    Cost of Equity •CAPM: the standard approach to estimating cost of equity: =Cost of Equity Risk Free Rate + Relative Risk Measure x Market Risk Premium 4. Discount using Cost of Capital
  • 27.
    Cost of Equity •The return on any investment with such low risk that the risk is considered to not exist. • Usually the yield on a 10-year government bond. =Cost of Equity Risk Free Rate + Relative Risk Measure x Market Risk Premium
  • 28.
    Cost of Equity •Market risk premium is the average return on the market minus the risk free rate • Investors need to be compensated for the additional risk of investing in stocks =Cost of Equity Risk Free Rate + Relative Risk Measure x Market Risk Premium
  • 29.
    Cost of Equity •Known as ‘Beta’ - Measures the volatility of a company’s stock price to changes in the broader market • Beta = 1 indicates the stock price moves in line with the market • Beta > 1 Stock price is more volatile than the market =Cost of Equity Risk Free Rate + Relative Risk Measure x Market Risk Premium
  • 30.
    Cost of Equity Question Whatdoes Beta = 0 indicate?
  • 31.
    WACC: Cost ofEquity • In the real world: – Government security rates are used as risk free rates – Historical risk premiums are used for the risk premium – Betas are estimated by regressing stock returns against market returns 4. Discount using Cost of Capital
  • 32.
    WACC: Cost ofDebt • The cost of debt is the effective interest rate which a company incurs on its debt • We use after-tax cost of debt (1 - tax rate) to adjust for the tax savings created from interest payments • Must use the marginal tax rate, not corporate tax rate
  • 33.
    WACC: Cost ofDebt • Where do we find the cost of debt? • Yield to Maturity on Long-term debt • Annual report • Company’s Credit Ratings
  • 34.
    WACC: Capital Structure •Use market values for debt and equity when calculating the capital structure mix
  • 35.
    WACC Assumptions Tax rate 24% WACC(see calc below) 9.6% Terminal Growth Rate 3.0% WACC Cost of Equity (CAPM) Risk Free Rate 1.79% Market Risk Premium 8.21% Equity Beta 0.97 Cost of Equity 9.8% Cost of Debt kd 5.38% kd (1-t) 4.11% WACC Calculation Market Value of Equity ($m) 26,800 Market Value of Debt 900 WACC 9.6% Weighted Average Cost of Capital Calculation 4. Discount using Cost of Capital
  • 36.
    6 Steps toBuild a DCF 1. Calculate a free cash flow: 2. Discounting a single cash flow: – PV = CF1 / (1+r) 3. Discounting a single cash flow in “n” years from now: – PV = CFn / (1+r)n 4. Multiple cash flows in future: – PV = CF1 / (1+r) + CF2 / (1+r)2 + CF3 / (1+r)3 + … 5. Growing Perpetuity: – PV = CF / (r-g) (1st CF at end of year 1, then grow at g) 6. Deduct Net Debt from Enterprise Value to calculate Equity Value: – Enterprise Value - Net Debt = Equity Value
  • 37.
    DCF Example Calculate thenet present value using the below figures: Free Cash Flows: Year 1 = 300 Year 3 = 750Year 2 = 500 Long Term growth rate: 3% WACC: 10% NPV = 9,541 Answer
  • 38.
    Discounted Cash FlowModel Years 0 1 2 3 4 5 5 Financial Year (Dec. Year end) 31-Dec-14 31-Dec-15 31-Dec-16 31-Dec-17 31-Dec-18 31-Dec-19 Terminal Period Total Turnover 5,505 6,590 8,133 9,632 11,155 12,661 growth (%) 19.7% 23.4% 18.4% 15.8% 13.5% EBIT 403 969 1,191 1,545 2,092 2,925 margin (%) 7.3% 14.7% 14.6% 16.0% 18.8% 23.1% Depreciation & Amortisation 54.0 62.4 119.3 174.1 226.9 278.5 Tax @ 23.6% (95.2) (229.0) (281.4) (365.2) (494.4) (691.3) Capital Expenditure 144.5 191.1 235.9 279.3 323.5 367.2 Capex/Sales (%) -2.6% -2.9% -2.9% -2.9% -2.9% -2.9% Change in Working Capital 0.0 (340.3) 491.5 471.7 471.7 453.4 Working Capital / Sales (%) 0.0% 5.2% -6.0% -4.9% -4.2% -3.6% Free Cash Flow 217 271 1284 1546 1972 2598 2598 Discount Factor 0.91 0.83 0.76 0.69 0.63 0.63 Terminal Value 39,628 Present Value 247 1,066 1,170 1,359 1,632 24,884 Enterprise Value (m) 30,357 Net Debt -213.6 Market Capitalisation ($m) 30,571 No. Shares (m) 61.7 Share Price ($) 495.5
  • 39.
    Pros and Consof Discounted Cash Flow Models Pros Cons Can offer a more accurate picture of fundamental valuation drivers Highly sensitive to discount rate Can evaluate different scenarios Highly sensitive to terminal growth rate Uses cash flows, not earnings or accounting measures Discount rate changes over time Useful as a sanity check of over/under valued Difficult to apply for early stage companies without cash flows
  • 40.
    Best Practices inDCF Model Building • Draw a time-line for yourself and label the cashflows! • Know when cash flows occur (beginning/end of period) • Make sure the discount rate and growth rates are reasonable • Growing perpetuity: • Discount rate ‘r’ must be larger than cash flow growth rate ‘g’. Otherwise it won’t work.
  • 41.
    Recap • Steps tobuild a Discounted cash flow model • Determining the explicit forecast period • Calculating the terminal value • How to calculate the discount rate • Value a company using a DCF Model