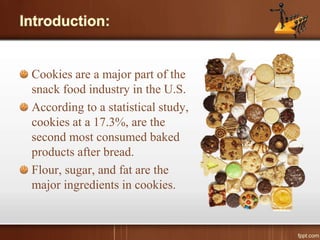
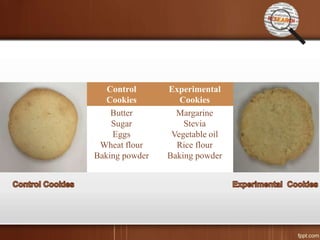
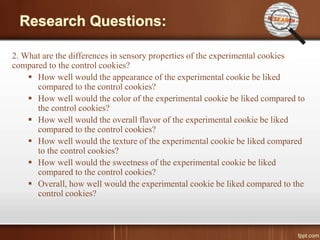
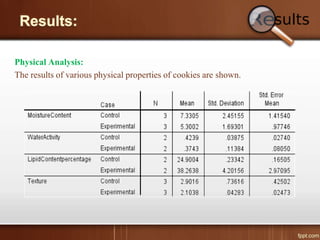
Cookies are a major part of the
snack food industry in the U.S.
According to a statistical study,
cookies at a 17.3%, are the
second most consumed baked
products after bread.
Flour, sugar, and fat are the
major ingredients in cookies.
Approximately 5% of the U.S. is vegetarian (close to 16 million
people) and about half of these vegetarians are vegan.
The vegan diet excludes all meat and animal products.
( Google Trends)
From 1980 through 2014, the number of U.S. adults aged 18 years or older
with diagnosed diabetes has almost quadrupled (from 5.5 million to 21.9
million).
Foods and drinks that use artificial sweeteners can be an option that may
help diabetes patients to curb their cravings for something sweet and
control their glucose level.
Celiac disease affects 1% of healthy, average Americans.
At least 3 million people in our country are living with celiac disease –
97% of them are undiagnosed.
– The untreated disease may cause many health issues, such as bone
fragility, depressed resistance to bacterial and fungal infections, and a
variety of other nutritional, immunological, and inflammatory
comorbidities.
The only existing treatment for celiac
disease is to follow the gluten-free diet.
• Gluten is a protein found in wheat,
barley, and rye.
To develop a new formulation of cookies for vegans suffering
from celiac disease and/or diabetes.
The new product will use:
WHY RICE FLOUR?
RICE FLOUR is one of the most suitable cereals for gluten-free product
formulations.
– Due to soft taste, colorless appearance, hypoallergenic properties, low levels
of sodium and easy digestible carbohydrates.
WHY STEVIA?
STEVIA significantly reduces postprandial glucose levels and postprandial
insulin levels compared to other artificial sweeteners.
– It is generally recognized as safe by the FDA and experts have agreed that it
is safe for use by the public in appropriate amounts.
WHY MARGARINE?
MARGARINE lowers LDL-C level by 11% in adults and 9% in children when
compared to butter and can be consumed by vegans.
WHY VEGETABLE OIL?
VEGETABLE OIL to replace egg for vegans.
Control
Cookies
Experimental
Cookies
Butter
Sugar
Eggs
Wheat flour
Baking powder
Margarine
Stevia
Vegetable oil
Rice flour
Baking powder
1. Experimental cookies would have a similar physical profile
as compared to control cookies.
2. Experimental cookies would have similar acceptance rate as
compared to control cookies.
Objective 1. To create a sugar free vegan rice cookie recipe
– Use rice flour, margarine and stevia instead of wheat flour,
butter and sugar
Objective 2. To measure physical properties
– Measure cookies’ water activity, moisture content, lipid
profile and moisture sorption.
Objective 3. To measure sensory properties
– To evaluate overall acceptance of new cookies for
population.
– Acceptance will be determined based on appearance, color,
overall flavor, texture, sweetness and overall liking.
1. What are the differences in physical properties of the
experimental cookies compared to the control cookies?
 How would the water activity and moisture content of the
experimental cookies compare to the control cookies?
 Would the experimental cookies have better texture properties
than the control cookies?
 Would the experimental cookies have lesser fat content than
the control cookies?
 How would the moisture uptake of experimental cookies
compared to the control cookies?
2. What are the differences in sensory properties of the experimental cookies
compared to the control cookies?
 How well would the appearance of the experimental cookie be liked
compared to the control cookies?
 How well would the color of the experimental cookie be liked compared to
the control cookies?
 How well would the overall flavor of the experimental cookie be liked
compared to the control cookies?
 How well would the texture of the experimental cookie be liked compared
to the control cookies?
 How well would the sweetness of the experimental cookie be liked
compared to the control cookies?
 Overall, how well would the experimental cookie be liked compared to the
control cookies?
Ingredients:
Mix ingredients separately for control cookies and
experimental cookies.
Drop cookie dough on baking pans.
Pre-heat the oven to 350⁰F and bake for 25-30 minutes.
Control group Experimental group
½ cup butter
½ cup sugar
1 egg
1 ½ cup wheat flour
½ tsp baking powder
½ cup margarine
½ cup Stevia
¼ cup vegetable oil
1 ¾ cup rice flour
½ tsp baking powder
Physical Analysis
Characteristic Method
Moisture Content Oven dried at 105⁰C for 24
hours
Water Activity Aqua Lab Water Activity
meter
Texture Hardness by Instron texture
analyzer
Lipid Content Extracted using acetone
Sensory evaluation
Recruited 14 students from UW-Stout.
Appearance, color, overall flavor, texture, sweetness and
overall liking were analyzed on a 9-point hedonic scale.
Statistical analysis- A one-way analysis of variance (ANOVA)
was used to establish the significance of differences among the
mean values at the 0.05 significance. Statistical analysis was
performed with SPSS.
Physical Analysis:
The results of various physical properties of cookies are shown.
0.022
0.388
Results of these studies indicated that there is a significant
difference in the texture between control cookies (M=2.1096,
SD=0.7362) and experimental cookies (M=2.1038, SD=0.0428);
t(4)=1.874, (p=0.022).
Results of these studies indicated that there is no significant
difference (p>0.05) between control cookies and experimental
cookies in terms of moisture content, water activity and lipid
content.
Sensory Analysis:
Control cookies had the highest ratings for all sensory parameters
tested. There were significant differences (P<0.05) to the degree of
which control cookies were better liked than experimental cookies.
This project forms a basis for developing new food products as there
is no significant difference in the physical properties of the cookies
from the statistical analysis.
Making alterations in the proportion and ingredients used can
improve the sensory characteristics of the cookies as the statistical
analysis showed that there is significant difference with respect to
the sensory characteristics between the control and experimental
cookies.
Cookies made from a mixture of fermented pigeon pea flour and
germinated sorghum flour with aspartame at different proportions
gave positive sensory results (Okafor et al., 2015)
Functional and sensory properties of cookies prepared from cassava
and water chestnut flours gave positive results (Bala et al., 2015).
Cookies made from cassava flour and rice flour with honey gave
positive results for physical and sensory properties tested (Adeboye
et al., 2015)
Small sample size of sensory panel
Short time frame
Limited monetary resources
Ingredient proportions were not varied
Unable to include population which are vegan and/or diabetic
and/or suffering from celiac disease as part of the sensory
panel.
Future research can be focused on:
– By altering the ingredients – utilizing different sweeteners
and flours.
– Varying compositions of sweeteners and flours
– Nutritional composition of cookies should be measured to
know the calorie content.
Bala, A., Gul, K., & Riar, C. S. (2015). Functional and sensory properties of
cookies prepared from wheat flour supplemented with cassava and water chestnut flours.
Cogent Food & Agriculture, 1(1), 1-7.
Okafor, G., & Omah, E. (2015). Selected Functional Properties, Proximate
Composition of Flours and Sensory Characteristics of Cookies from Wheat and Millet-Pigeon
Pea Flour Blends. Pakistan J. of Nutrition Pakistan Journal of Nutrition, 14(9), 581-585.
Adeboye, A., S., & Bangbose, A. (2015). Effect of Honey on Selected Physical and
Sensory Properties of Cookies from Cassava-Wheat Composite Flour. J Food Process
Technol Journal of Food Processing & Technology, 6(7), 452-459.
Bakery Products in the United States. (n.d.). Retrieved February 09, 2016, from
http://www.agr.gc.ca/eng/industry-markets-and-trade/statistics-and-market-information/by-
region/united-states/market-intelligence/bakery-products-in-the-united-
states/?id=1410083148478#b
Trauth, E. , (2014) Is 2014 the Year of the Vegan? Retirved from:
http://www.onegreenplanet.org/news/is-2014-the-year-of-the-vegan/
http://www.google.com/trends/explore#q=vegan%2C%20%2Fm%2F07_hy&cmpt=q&tz=Etc
%2FGMT%2B5
Torbica, A., Hadnađev, M., & Hadnađev, T. D. (2012). Rice and buckwheat flour
characterisation and its relation to cookie quality. Food Research International, 48(1), 277-
283.
Anton, S. D., Martin, C. K., Han, H., Coulon, S., Cefalu, W. T., Geiselman, P., &
Williamson, D. A. (2010). Effects of stevia, aspartame, and sucrose on food intake, satiety,
and postprandial glucose and insulin levels. Appetite, 55(1), 37-43.
ADA (2014) What‘s The Deal With Stevia? Low-Calorie Sweeteners. Retrieved
from: http://www.diabetes.org/food-and-fitness/food/what-can-i-eat/understanding-
carbohydrates/artificial-sweeteners/#sthash.m2HQXKA3.dpuf
Centers for Disease Control. (2009). Number (in Millions) of
Civilian/Noninstitutionalized Persons with Diagnosed Diabetes, United States, 1980–2006.
2008. Retrived from: http://www.cdc.gov/diabetes/statistics/prev/national/figadults.htm
Cookies Research Project

Cookies Research Project

  • 2.
    Cookies are amajor part of the snack food industry in the U.S. According to a statistical study, cookies at a 17.3%, are the second most consumed baked products after bread. Flour, sugar, and fat are the major ingredients in cookies.
  • 3.
    Approximately 5% ofthe U.S. is vegetarian (close to 16 million people) and about half of these vegetarians are vegan. The vegan diet excludes all meat and animal products. ( Google Trends)
  • 4.
    From 1980 through2014, the number of U.S. adults aged 18 years or older with diagnosed diabetes has almost quadrupled (from 5.5 million to 21.9 million). Foods and drinks that use artificial sweeteners can be an option that may help diabetes patients to curb their cravings for something sweet and control their glucose level.
  • 5.
    Celiac disease affects1% of healthy, average Americans. At least 3 million people in our country are living with celiac disease – 97% of them are undiagnosed. – The untreated disease may cause many health issues, such as bone fragility, depressed resistance to bacterial and fungal infections, and a variety of other nutritional, immunological, and inflammatory comorbidities. The only existing treatment for celiac disease is to follow the gluten-free diet. • Gluten is a protein found in wheat, barley, and rye.
  • 6.
    To develop anew formulation of cookies for vegans suffering from celiac disease and/or diabetes. The new product will use:
  • 7.
    WHY RICE FLOUR? RICEFLOUR is one of the most suitable cereals for gluten-free product formulations. – Due to soft taste, colorless appearance, hypoallergenic properties, low levels of sodium and easy digestible carbohydrates. WHY STEVIA? STEVIA significantly reduces postprandial glucose levels and postprandial insulin levels compared to other artificial sweeteners. – It is generally recognized as safe by the FDA and experts have agreed that it is safe for use by the public in appropriate amounts. WHY MARGARINE? MARGARINE lowers LDL-C level by 11% in adults and 9% in children when compared to butter and can be consumed by vegans. WHY VEGETABLE OIL? VEGETABLE OIL to replace egg for vegans.
  • 8.
  • 9.
    1. Experimental cookieswould have a similar physical profile as compared to control cookies. 2. Experimental cookies would have similar acceptance rate as compared to control cookies.
  • 10.
    Objective 1. Tocreate a sugar free vegan rice cookie recipe – Use rice flour, margarine and stevia instead of wheat flour, butter and sugar Objective 2. To measure physical properties – Measure cookies’ water activity, moisture content, lipid profile and moisture sorption. Objective 3. To measure sensory properties – To evaluate overall acceptance of new cookies for population. – Acceptance will be determined based on appearance, color, overall flavor, texture, sweetness and overall liking.
  • 11.
    1. What arethe differences in physical properties of the experimental cookies compared to the control cookies?  How would the water activity and moisture content of the experimental cookies compare to the control cookies?  Would the experimental cookies have better texture properties than the control cookies?  Would the experimental cookies have lesser fat content than the control cookies?  How would the moisture uptake of experimental cookies compared to the control cookies?
  • 12.
    2. What arethe differences in sensory properties of the experimental cookies compared to the control cookies?  How well would the appearance of the experimental cookie be liked compared to the control cookies?  How well would the color of the experimental cookie be liked compared to the control cookies?  How well would the overall flavor of the experimental cookie be liked compared to the control cookies?  How well would the texture of the experimental cookie be liked compared to the control cookies?  How well would the sweetness of the experimental cookie be liked compared to the control cookies?  Overall, how well would the experimental cookie be liked compared to the control cookies?
  • 13.
    Ingredients: Mix ingredients separatelyfor control cookies and experimental cookies. Drop cookie dough on baking pans. Pre-heat the oven to 350⁰F and bake for 25-30 minutes. Control group Experimental group ½ cup butter ½ cup sugar 1 egg 1 ½ cup wheat flour ½ tsp baking powder ½ cup margarine ½ cup Stevia ¼ cup vegetable oil 1 ¾ cup rice flour ½ tsp baking powder
  • 14.
    Physical Analysis Characteristic Method MoistureContent Oven dried at 105⁰C for 24 hours Water Activity Aqua Lab Water Activity meter Texture Hardness by Instron texture analyzer Lipid Content Extracted using acetone
  • 15.
    Sensory evaluation Recruited 14students from UW-Stout. Appearance, color, overall flavor, texture, sweetness and overall liking were analyzed on a 9-point hedonic scale. Statistical analysis- A one-way analysis of variance (ANOVA) was used to establish the significance of differences among the mean values at the 0.05 significance. Statistical analysis was performed with SPSS.
  • 16.
    Physical Analysis: The resultsof various physical properties of cookies are shown.
  • 17.
  • 18.
    Results of thesestudies indicated that there is a significant difference in the texture between control cookies (M=2.1096, SD=0.7362) and experimental cookies (M=2.1038, SD=0.0428); t(4)=1.874, (p=0.022). Results of these studies indicated that there is no significant difference (p>0.05) between control cookies and experimental cookies in terms of moisture content, water activity and lipid content.
  • 19.
  • 21.
    Control cookies hadthe highest ratings for all sensory parameters tested. There were significant differences (P<0.05) to the degree of which control cookies were better liked than experimental cookies.
  • 22.
    This project formsa basis for developing new food products as there is no significant difference in the physical properties of the cookies from the statistical analysis. Making alterations in the proportion and ingredients used can improve the sensory characteristics of the cookies as the statistical analysis showed that there is significant difference with respect to the sensory characteristics between the control and experimental cookies. Cookies made from a mixture of fermented pigeon pea flour and germinated sorghum flour with aspartame at different proportions gave positive sensory results (Okafor et al., 2015)
  • 23.
    Functional and sensoryproperties of cookies prepared from cassava and water chestnut flours gave positive results (Bala et al., 2015). Cookies made from cassava flour and rice flour with honey gave positive results for physical and sensory properties tested (Adeboye et al., 2015)
  • 24.
    Small sample sizeof sensory panel Short time frame Limited monetary resources Ingredient proportions were not varied Unable to include population which are vegan and/or diabetic and/or suffering from celiac disease as part of the sensory panel.
  • 25.
    Future research canbe focused on: – By altering the ingredients – utilizing different sweeteners and flours. – Varying compositions of sweeteners and flours – Nutritional composition of cookies should be measured to know the calorie content.
  • 26.
    Bala, A., Gul,K., & Riar, C. S. (2015). Functional and sensory properties of cookies prepared from wheat flour supplemented with cassava and water chestnut flours. Cogent Food & Agriculture, 1(1), 1-7. Okafor, G., & Omah, E. (2015). Selected Functional Properties, Proximate Composition of Flours and Sensory Characteristics of Cookies from Wheat and Millet-Pigeon Pea Flour Blends. Pakistan J. of Nutrition Pakistan Journal of Nutrition, 14(9), 581-585. Adeboye, A., S., & Bangbose, A. (2015). Effect of Honey on Selected Physical and Sensory Properties of Cookies from Cassava-Wheat Composite Flour. J Food Process Technol Journal of Food Processing & Technology, 6(7), 452-459. Bakery Products in the United States. (n.d.). Retrieved February 09, 2016, from http://www.agr.gc.ca/eng/industry-markets-and-trade/statistics-and-market-information/by- region/united-states/market-intelligence/bakery-products-in-the-united- states/?id=1410083148478#b Trauth, E. , (2014) Is 2014 the Year of the Vegan? Retirved from: http://www.onegreenplanet.org/news/is-2014-the-year-of-the-vegan/ http://www.google.com/trends/explore#q=vegan%2C%20%2Fm%2F07_hy&cmpt=q&tz=Etc %2FGMT%2B5
  • 27.
    Torbica, A., Hadnađev,M., & Hadnađev, T. D. (2012). Rice and buckwheat flour characterisation and its relation to cookie quality. Food Research International, 48(1), 277- 283. Anton, S. D., Martin, C. K., Han, H., Coulon, S., Cefalu, W. T., Geiselman, P., & Williamson, D. A. (2010). Effects of stevia, aspartame, and sucrose on food intake, satiety, and postprandial glucose and insulin levels. Appetite, 55(1), 37-43. ADA (2014) What‘s The Deal With Stevia? Low-Calorie Sweeteners. Retrieved from: http://www.diabetes.org/food-and-fitness/food/what-can-i-eat/understanding- carbohydrates/artificial-sweeteners/#sthash.m2HQXKA3.dpuf Centers for Disease Control. (2009). Number (in Millions) of Civilian/Noninstitutionalized Persons with Diagnosed Diabetes, United States, 1980–2006. 2008. Retrived from: http://www.cdc.gov/diabetes/statistics/prev/national/figadults.htm

Editor's Notes

  • #3 Bakery Products in the United States. (n.d.). Retrieved February 09, 2016, from http://www.agr.gc.ca/eng/industry-markets-and-trade/statistics-and-market-information/by-region/united-states/market-intelligence/bakery-products-in-the-united-states/?id=1410083148478#b
  • #4 Trauth, E. , (2014) Is 2014 the Year of the Vegan? Retirved from: http://www.onegreenplanet.org/news/is-2014-the-year-of-the-vegan/ http://www.google.com/trends/explore#q=vegan%2C%20%2Fm%2F07_hy&cmpt=q&tz=Etc%2FGMT%2B5
  • #5 Centers for Disease Control. (2009). Number (in Millions) of Civilian/Noninstitutionalized Persons with Diagnosed Diabetes, United States, 1980–2006. 2008. Retrived from: http://www.cdc.gov/diabetes/statistics/prev/national/figadults.htm
  • #6 The university of Chicago celiac disease center. (n.d.) Celiac Disease Facts and Figures. Retrieved from: http://www.uchospitals.edu/pdf/uch_007937.pdf
  • #8 Torbica, A., Hadnađev, M., & Hadnađev, T. D. (2012). Rice and buckwheat flour characterisation and its relation to cookie quality. Food Research International, 48(1), 277-283. Anton, S. D., Martin, C. K., Han, H., Coulon, S., Cefalu, W. T., Geiselman, P., & Williamson, D. A. (2010). Effects of stevia, aspartame, and sucrose on food intake, satiety, and postprandial glucose and insulin levels. Appetite, 55(1), 37-43. ADA (2014) What‘s The Deal With Stevia? Low-Calorie Sweeteners. Retrieved from: http://www.diabetes.org/food-and-fitness/food/what-can-i-eat/understanding-carbohydrates/artificial-sweeteners/#sthash.m2HQXKA3.dpuf