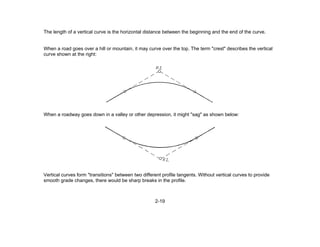
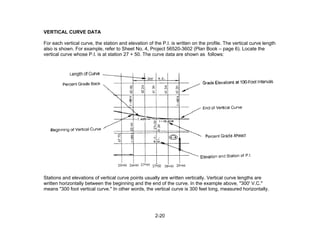
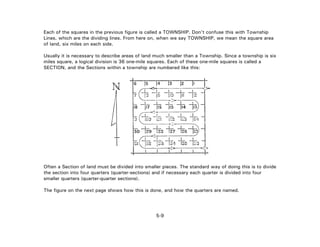
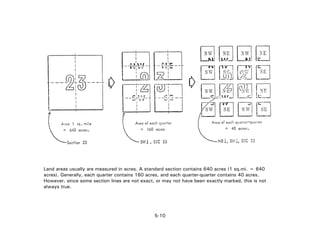
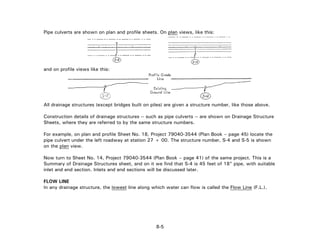
This document provides an overview of how to read and interpret transportation construction plans. It introduces the basic components and types of plan sheets, including:
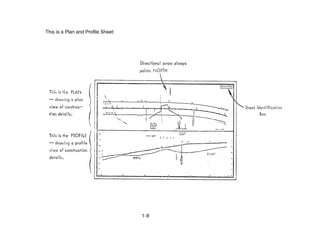
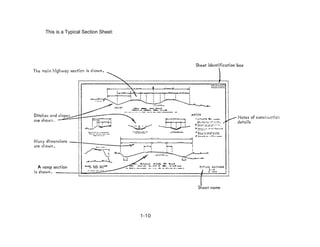
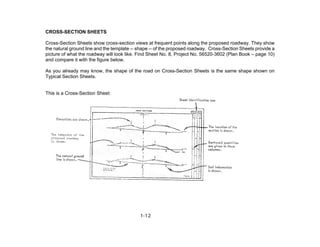
1) Plan and profile sheets, typical section sheets, cross-section sheets, and roadway and traffic design standards that show various views of the proposed construction.
2) A key sheet that identifies the project location and provides an index of all plan sheets.
3) Summary sheets that list quantities of materials and work items.
It also explains common plan features like title blocks, sheet numbers, scales, and standard symbols and abbreviations used to convey information on the plans. The document serves as an introductory guide for understanding the essential elements and organization of