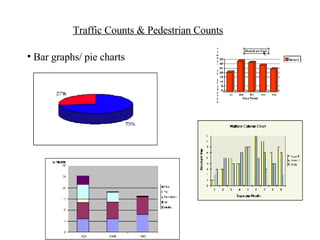
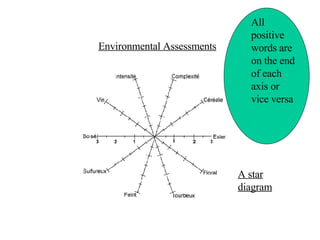
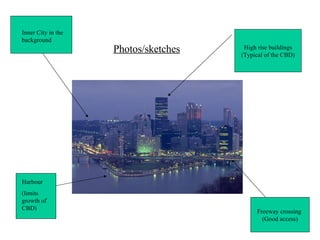
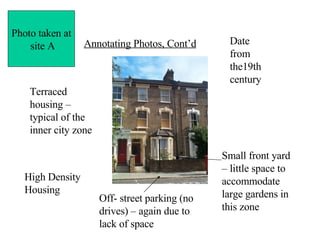
This document provides guidance on presenting results in an effective way for coursework. It recommends using visual presentations such as bar graphs, pie charts, line graphs, photos, maps, and star diagrams to display data in an easy to understand manner. The examiners will look for good presentation, appropriate and complex visualization techniques being used, and some incorporation of information and communication technology.