Downloaded 257 times
![97
Davies, B. and Parket, C. (1997), Writing the doctoral dissertation: a systematic
approach, Barron’s Educational Series.
Denscombe, Martyn (2003) The Good Research Guide: For Small Scale Social
Research Projects. United Kingdom, Open University Press
Drew, J.H. (1991), ‘A Multistage model of customer assessments of service quality and
value’. Journal of Consumer Research, Vol. 17, 375-84.
Duncan, E. and Elliot, G. (2002), ‘Customer service quality and financial performance
among Australian retail financial institution’. Journal of Financial Services Marketing, 7
(1), 25-41.
Dutta, A. and Sridhar, V. (2003), ‘Modelling Growth of Cellular Services in India: A
Systems Dynamics Approach’ [papers presented at proceeding of the 36th
Hawaii
International Conference on system sciences, 2003]. Hawaii.
Ezenezi, R.E. (2011), Impact of Cellphone Techonology User, p58. United States,
Xlibris Corporation.
Fill, C. (2005), Marketing Communications: engagement, strategies and practices (4th
edn.), p612. England, Prentice Hall.
Fornell, C. (1992), ‘A National Customer Satisfaction Barometer: The Swedish
Experience’. Journal of Marketing, Vol. 56, 6-21.
Frangos, C.C. (2009), Proceedings of the 2nd
international conference: qualitative and
quantitative methodologies in economic and administrative sciences, p165. Greece,
Athens.
Garbarino, Ellen, and Johnson, Mark (1999) “The Different Roles of Satisfaction, Trust
and Commitment in Customer Relationships” Journal of Marketing, Vol. 63 (April), 70-
87.
Gershon, R.A. (2009), Telecommunications and Business Strategy, p109. New York,
Routledge.
Gillham, B., (2000), Developing a Questionnaire. London, Continuum Books.
Gronhaug, K., & Gilly, M. C. (1991), ‘A transaction cost approach to customer
dissatisfaction and complaint actions’. Journal of Economic Psychology, Vol. 12, 165-
183.](https://image.slidesharecdn.com/10f98fd7-b7e1-4751-b444-b06f6133fce4-150405161600-conversion-gate01/85/Consumers-switching-behaviour-97-320.jpg)

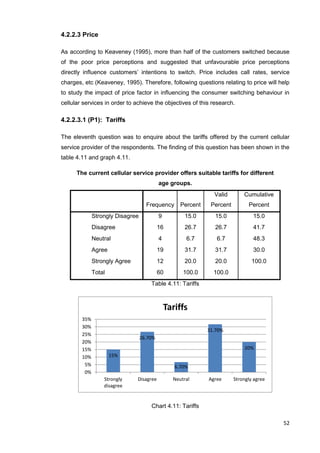
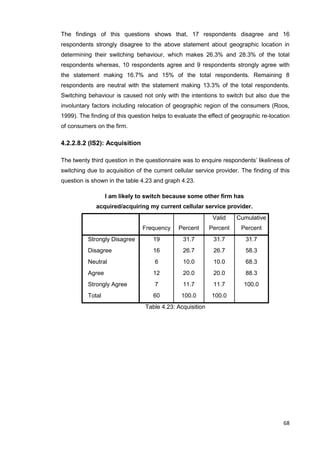
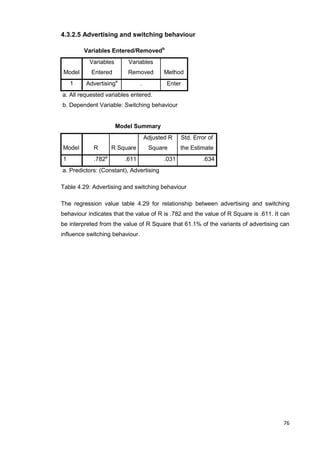
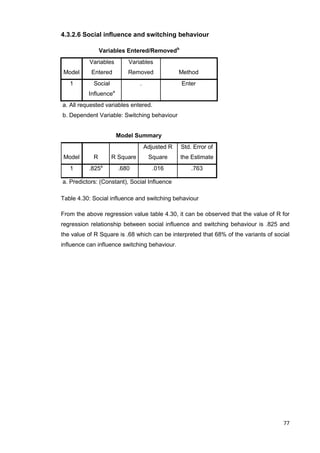
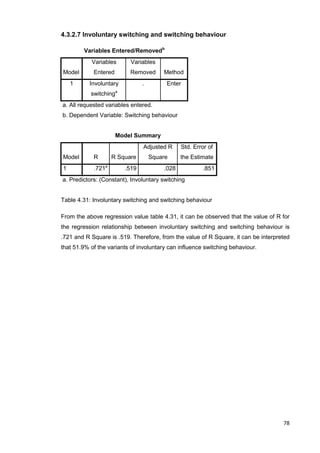
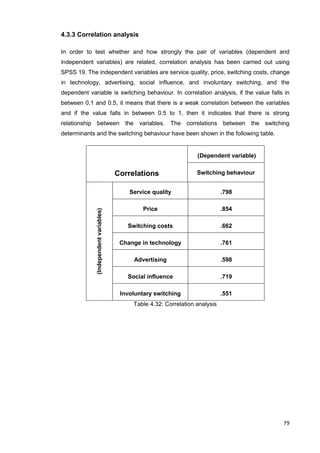
This document discusses factors that influence consumer switching behavior between cellular service providers in India. It begins with an introduction to the growth of the cellular industry and importance of understanding consumer behavior. The literature review discusses key theories of consumer switching behavior, including factors like service quality, price, switching costs, technology changes, advertising, and social influences. Hypotheses are developed based on these switching determinants. The document outlines the research methodology, which will involve a quantitative survey in Bangalore to understand the likelihood of young consumers to switch providers and their perceptions of different switching factors. Findings will be analyzed using statistical tests and to evaluate the hypotheses.


