Download to read offline
![30 Management&Marketing, volume X, issue 1/2012
CR= (∑ Standardized loadings) √ ⁄ [(∑ Standardized loadings) √ + ∑ (measurement
indicator error)]
AVE = ∑ (Standardized loadings√) ⁄ [∑ (Standardized loadings√) + ∑ (measurement indicator
error)]
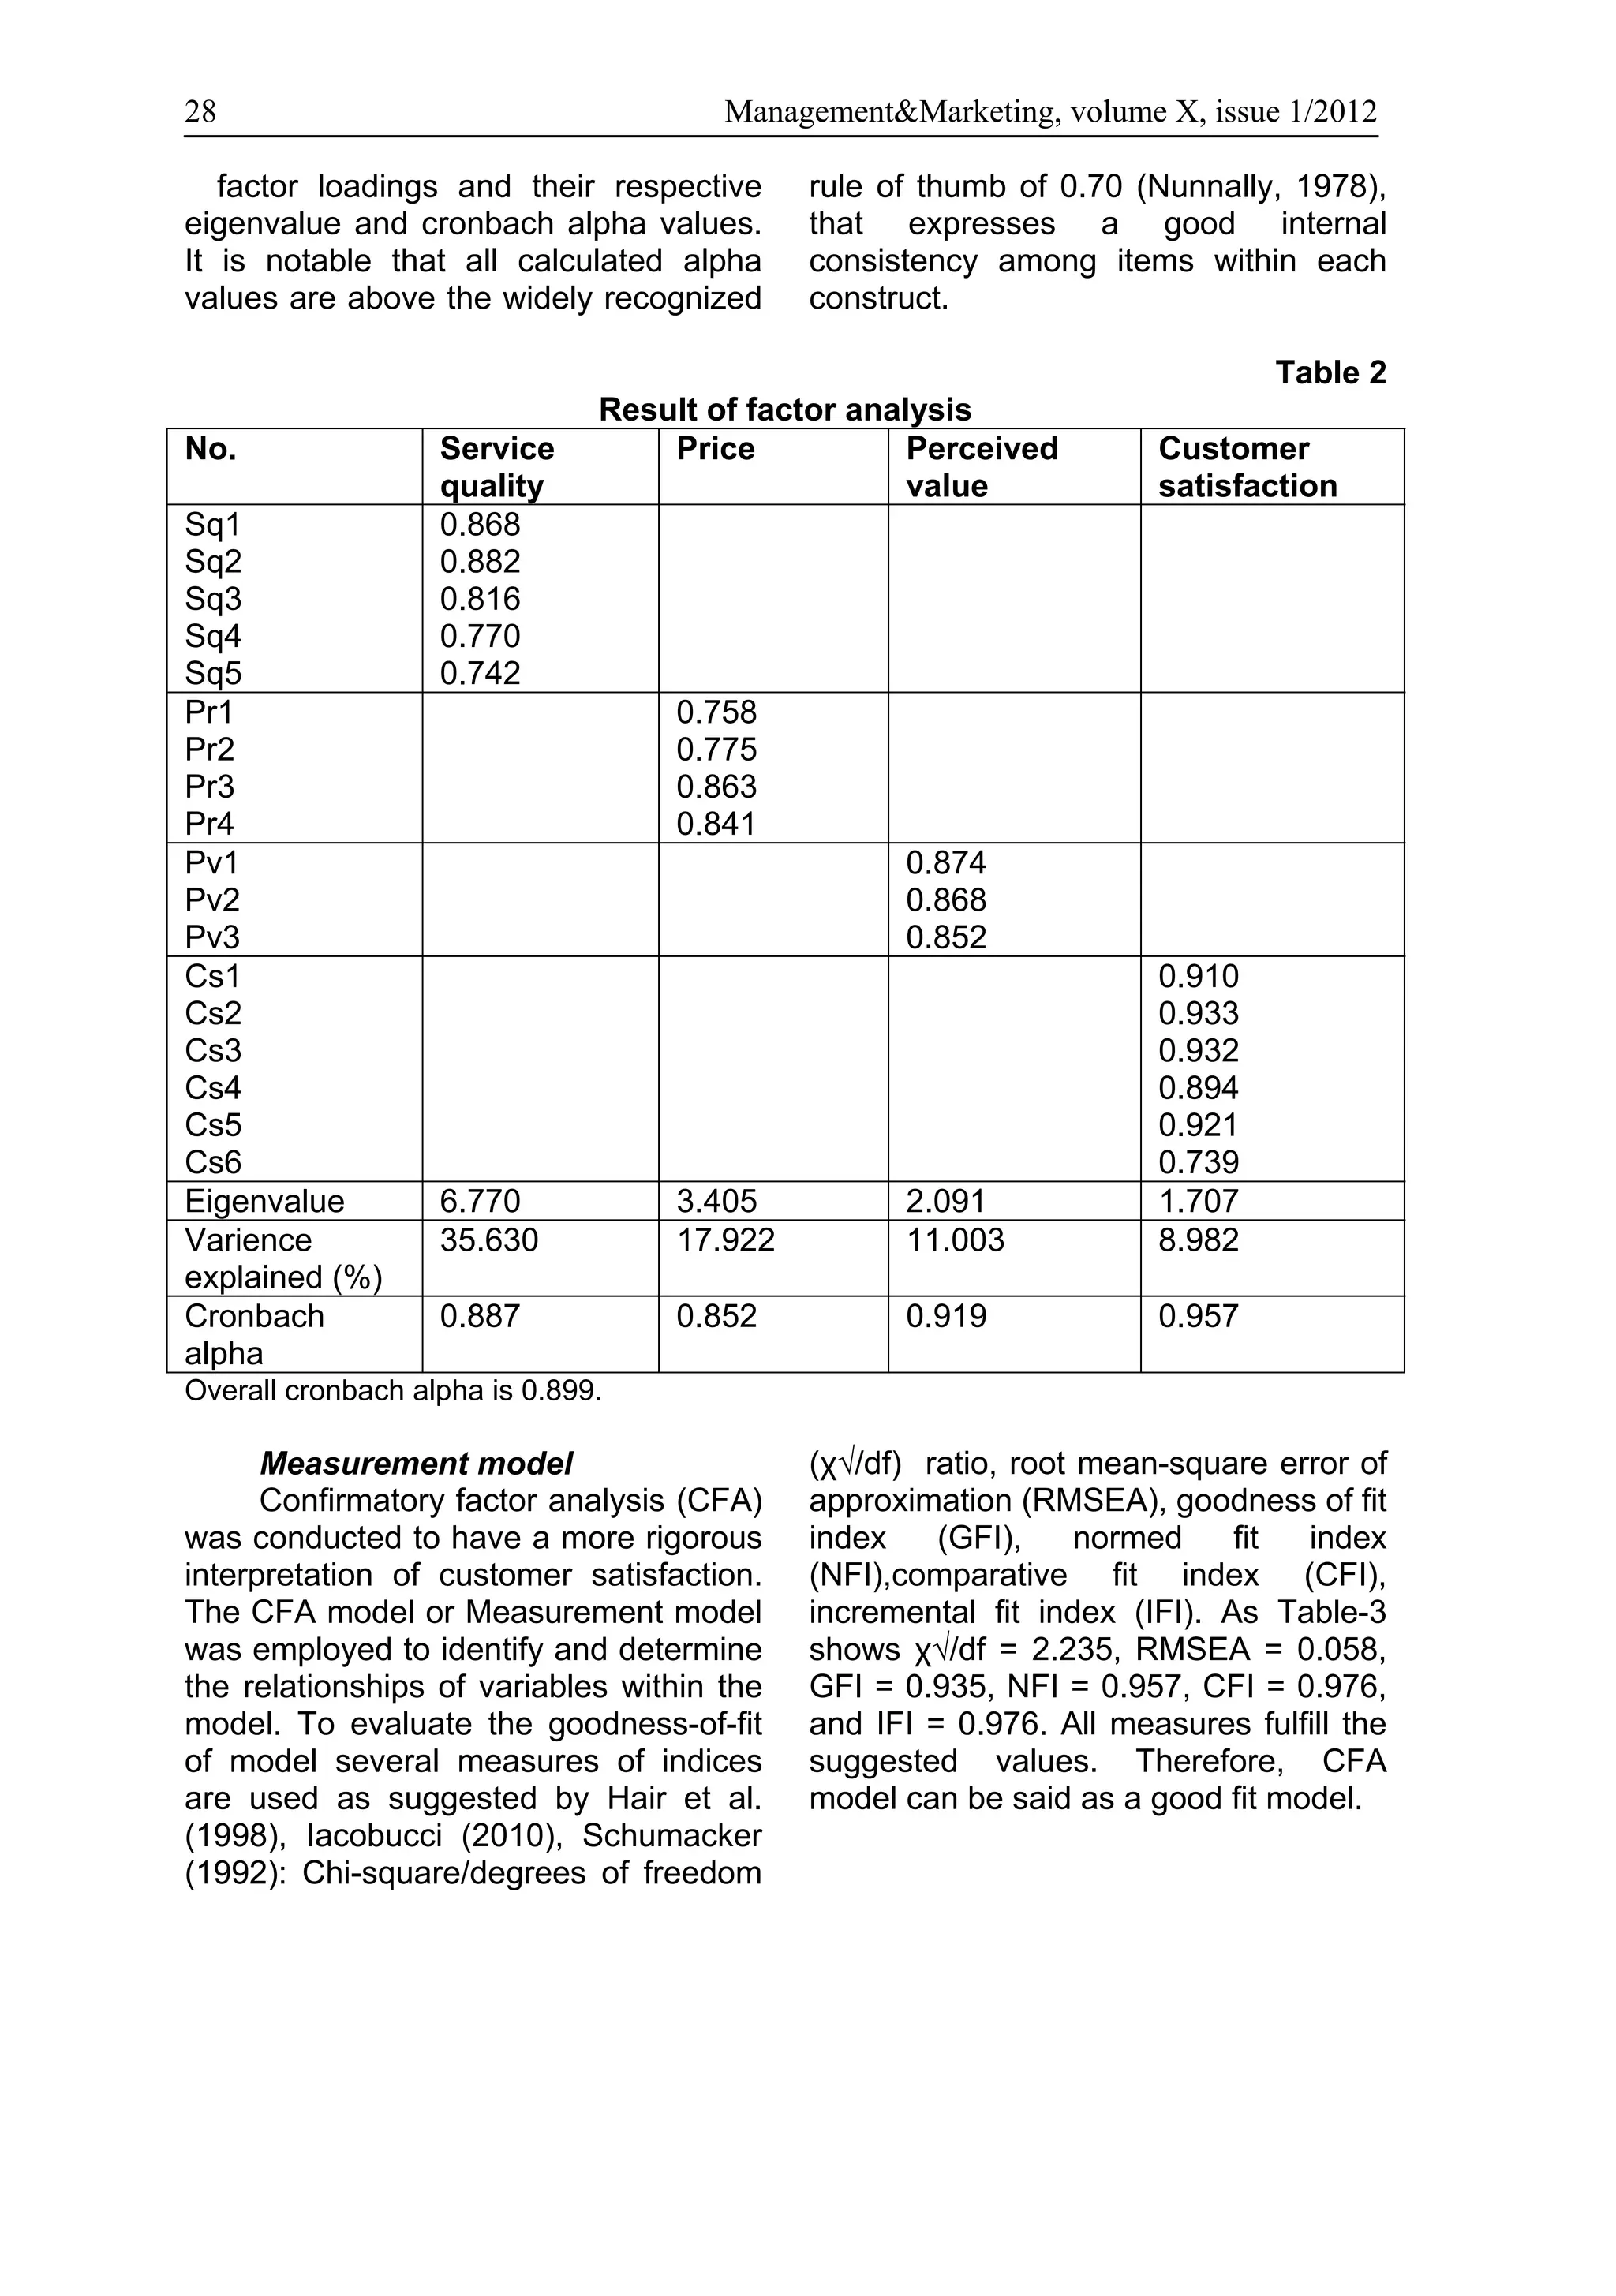
After being assured that a scale items offer good measures to their
instrument provides necessary levels of respective latent construct because of
reliability, this study stepped to scale all t-statistics values are statistically
validity. Under construct validity significant at 0.01 level and confirmed
convergent validity and discriminant convergent validity of the constructs.
validity were tested in this study. The Average variance extracted (AVE) is
degree to which dimensional measures also used to assess discriminant validity
of the same concept are correlated is (Fornell and Larcker, 1981). The role of
assessed by convergent validity. To thumb is that the average variance
assess convergent validity average extracted (AVE) values should be
variance extracted (AVE) is used greater than corresponding squired
(Fornell and Larcker, 1981; Hair et al., inter-construct correlation estimates
1998). Representation of latent (SIC) in the model. Table-5 shows the
constructs by items is truly denoted as average variance extracted (AVE)
higher as the average variance estimates in the diagonal values and
extracted is higher. For latent construct corresponding squired inter-construct
the average variance extracted (AVE) correlation estimates (SIC) values,
should be more than 0.50 (Hair et al., supportive evidence for discriminant
1998). Table-4 shows the average validity. For example, (Table-5) average
variance extracted (AVE) values for variance extracted (AVE) estimate for
constructs ranged from 0.61 to 0.80 price was 0.57 and corresponding
exceeded the threshold value 0.50, squired inter-construct correlation
supportive evidence for convergent estimates (SIC) values were 0.09, and
validity. Moreover, in a CFA setting, t- 0.06 for perceived value and customer
statistics related to factor loadings is satisfaction respectively, an indication of
assessed to measure convergent discriminant validity.
validity (Rao and Troshani, 2007). All
Table 5
Squared correlations between constructs
Service Price Perceived Customer
quality value satisfaction
Service quality 0.61*
Price 0.11 0.57*
Perceived 0.12 0.09 0.80*
value
Customer 0.04 0.06 0.20 0.78*
satisfaction
*Diagonal elements are average variance extracted (AVE)
Structural model (Hair et al., 1998; Iacobucci, 2010;
Table-3 shows the common Schumacker, 1992) the evidence of a
model-fit indices, recommended values good model fit was revealed. Given the
and results of the test of structural good fit of the model, the estimated path
model fitness. As shown in Table-3, coefficients of the structural model were
comparison of all fit indices with their then examined to evaluate the
corresponding recommended values hypotheses.](https://image.slidesharecdn.com/215112fff-130318042247-phpapp01/75/2-15-1_12_fff-11-2048.jpg)

This document discusses a survey research study on customer satisfaction with mobile phone services in Bangladesh. The study explored factors influencing customer satisfaction, such as service quality and price. Data was collected through questionnaires and analyzed using factor analysis and structural equation modeling. The results showed that service quality and fair price indirectly influence customer satisfaction through perceived value. Perceived value mediates the relationship between quality, price fairness, and satisfaction. Fair price was also found to directly impact customer satisfaction, but service quality did not have a direct effect. The study provides implications for mobile phone operators to enhance customer satisfaction by focusing on meeting customer expectations.