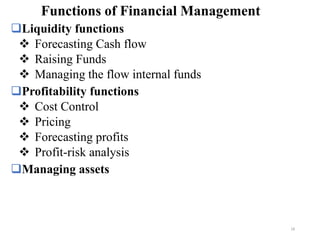
Debre Birhan university
Institute of technology
Department of Construction Technology and
Management
Financial Management in Construction
By: Yibeltal Alamirew (MSc. PE)
0
CHAPTER 1: Introduction
An Overview of Financial Management
❑Capital Requirement of a Firm
❑Fields of Finance
❑Forms of business organization
❑Goals of Financial Management
❑Functions of Financial Management
❑Organization of Finance Functions
1
❑ FM is the planning for, acquiring and
Utilizing of funds in order to maximize the
efficiency and value of the firm.
❑ It involves
⚫Forecasting & Planning
⚫Major investment and financing decisions
⚫Coordination and Control
⚫Risk Management
What is Financial Management all about?
2
❑ No matter what the nature the proposed business is and
how it is organized, one has to address the following
questions.
➢ What capital investment should be made? That is what kind
of material and equipment should be purchased, or building
to be rented, etc.
➢ How and where the money to pay for the proposed capital
investment will be raised?
➢ How the day-to-day financial activities are handled like
collecting the receivables and paying the suppliers?
Cont’d
3
It has now broaden to deal with issues like:
➢ Which new proposals for employing capital should be accepted
by the firm?
➢ What steps can be taken to increase the value of the firm’s
common stock?
➢ How much working capital will be needed to support and
expand the company’s operation?
➢ Where should the firm go to raise the short and long-term
capital demand and how much will it cost?
➢ Should a firm declare a cash dividend on its common stock and
if so, how much a dividend should be declared?
Cont’d
4
Cont’d
❑ The term finance can be defined as the
management of the flows of money or its
equivalent through an organization, whether it is a
for or not-for profit firms, corporation or non-
corporate business, or government agency.
❑ Finance concerns itself with the actual flow of
money as well as any claims against money.
The flow of fund is a continuous process 5
Dividends
Outside Investment
Investment
Loan Payment Loan
Payment for
Material
Purchase
of Assets
Sale
of Assets
Payment
of Expenses
Collections
Net
Credit
Sales
Net
Cash
Sales
Stockholders’
(Equity)
Other Corporations,
Businesses and Agencies
Creditors
(Debt)
CASH
Raw
Materials
Fixed
Assets
Personal Expenses
Wages, Benefits
& Operating Exp.
Accounts
Receivables
Work in
Process
Product
Inventories
Labor
Expense
Sales
Expense
Depreciation
Cash Flow in a Firm
6
Cash flow of contractors towards project
participants
Contractor
Financial
Institutions
Sub
Contractor
Supplier’s
Credit
Head office
finance
(Own
reserve)
Project
owner -
Payments
Construction
Plant
Products
Sales
Equipment
and Form &
False Works
Rent
➢ Financial demand for Tendering
➢ Financial demand for Contracting
➢ Financial demand for Inputs (Resources)
➢ Financial demand for Supervision
➢ Financial demand for Payment Processing
Major financial demand required for Construction
works include:
❑ The project finance problem is to obtain funds to bridge the
time between making expenditures and obtaining revenues.
The Financing Problem
Sources of Finance to Contractors
❑ Internal
❖ Cash flow from operations
❖ Sale of assets
❑ External
❖ owners (equity)
❖ creditors (debt)
❑ Debt Security
➢ It arises when a firm borrows money from creditors.
The firm incurs liability to repay the amount of money
borrowed in some future maturity date
❑ Equity Securities
➢ It represents ownership claim in the firm. People who
purchase equity securities are entitled to rights and
conditions that are different from those of firm’s
creditors
Debt vs. Equity Financial Securities
10
11
Fields of
finance
Fund owned by Fund collected
through
Use of fund
Public Finance Federal, State and Local
Government
Revenue from
taxes and
levies, Loan ,
Grant etc
To accomplish Social and
Economic objectives.
Perform non-profit
oriented corporations.
Finance Securities Individuals, Institutional
investors
Purchase and sale
of stocks and
bonds.
Means of raising finance
for institutional
investors. Means of
achieving profit for
individuals.
International
Finance
Individuals, businesses
and governments
involved in
international
transactions
Through
International
transactions
Means of collecting
foreign currency.
Institutional
Finance
Banks, Insurance
companies, and
pension funds and
credit unions.
Individual savers Finance function of the
economy through
capital formation.
2. Fields of Finance
❑Sole proprietorship
❑Partnership
I. General Partnership
II. Limited Partnership
❑Corporation
I. Subsidiary
II. Affiliate
III. Division
❑Joint Venture
Alternative Forms of Business Organization
13
❑ Advantages:
➢ Ease of formation
➢ Subject to few regulations
➢ No corporate income taxes
❑ Disadvantages:
➢ Limited life
➢ Unlimited liability
➢ Difficult to raise capital
Sole Proprietorship
❑ A general partnership has roughly the same advantages
and disadvantages as a sole proprietorship.
14
❑ Advantages:
➢ Unlimited life
➢ Easy transfer of ownership
➢ Limited liability
➢ Ease of raising capital
❑ Disadvantages:
➢ Double taxation
➢ Cost of set-up and report filing
Double Taxation of Corporate Profits/Income
Assume Corporate and Individual Tax = 50%
Earnings Before Taxes $100 EBT
($50) Corporate Tax
Net Income After Tax $50 NIAT (Profits)
Assume 100% Div. Payout $50 Dividend income
($25) Personal Income
$25 After-tax Income
Corporation
15
❑ A joint venture is a partnership agreement in which two
or more individual- or group-run businesses join
together to carry out a single business project sharing
the initial investment & risks.
In the Ethiopian Code:
“A joint venture is an agreement between partners on terms
mutually agreed and is a subject to the general principles of
law relating to the partnerships.”
Joint Venture
16
❑Profit Maximization:
➢ It is vague
➢ It leaves consideration of timing and duration
undefined
➢ It overlooks future aspects
❑ Wealth Maximization:
➢ Avoid high level of risk
➢ Pay consistent dividend
➢ Seek growth in Sales
➢ Maintain market Price of Stocks
Goals of Financial Management
17
❑Liquidity functions
❖ Forecasting Cash flow
❖ Raising Funds
❖ Managing the flow internal funds
❑Profitability functions
❖ Cost Control
❖ Pricing
❖ Forecasting profits
❖ Profit-risk analysis
❑Managing assets
Functions of Financial Management
18
❑Most firms designate three major financial positions
▪ Chief Financial Officer (CFO)
▪ Treasurer
➢ Managing cash flows
➢ Forecasting financial need
➢ Relations with FI
▪ Controller
➢ Financial accounting, internal auditing, taxation,
payroll functions
Organization of Finance Function
19
CFO
Treasurer Controlle
r
Cash
Manager
Credit
Manager
Financial
Accounting
Manager
Management
Accounting
Manager
Capital
Budgeting
Manager
Fund Raising
Manager
Portfolio
Manager
Tax
Manager
Data
Processing
Manager
Internal
Auditor 20
❑ Short-term financing
❑ Medium-term financing
❑ Long-term financing
CHAPTER 2: Financing Decisions
Short, medium, and long term financing
❑ Short-term financing usually includes loans that mature within
a year or less.
❑ Short-term finance
➢Used to raise temporary funds to cover seasonal or cyclic
business peak or special funding needs involving a short
time frame.
➢Are self-liquidating.
❑ Goals of short-term financing:
➢ Finance inventories during a production/ construction
period. Short-term financing allows the firm to match its
funds against its needs over an annual, seasonal or other
cyclical period.
➢ To achieve low-cost financing. The interest-free sources
provide low-cost financing for the firm by reducing its
borrowing need from interest-bearing sources
1. Short Term Financing
Source of Short-term financing
I. Unsecured Interest-Free Sources
➢ Accounts Payable
➢ Accruals
➢ Advance Payments
➢ Advance for purchase of materials/ material on site
II. Unsecured Interest-bearing Sources
❑ Self-Liquidating Bank Loans
➢ Single payment note
➢ Unsecured overdraft facility/ Line of Credit
➢ Revolving credit agreement
❑ Non Bank Short-term sources
➢ Commercial Paper/ Bond (Treasury bond)
➢ Private Loans
Source of Short-term financing (cont’d)
III. Secured Short-term Sources
❑ A secured loan occurs when the borrower pledges a
specific asset, collateral, to back a loan.
❑ Collateral may be in the form of:
➢ Warehouse receipt loan
➢ Receivables
✓ Pledging of accounts receivable
✓ Factoring receivables
❑ Intermediate-term financing usually includes loans with
maturity greater than 1 year & less than 5 to 7 years.
❑ Intermediate-term finance categories
➢ Revolving Credit Agreement
➢ Term Loan
➢ Lease
❑ Intermediate-term financing institutions
➢ Commercial Bank Loans
➢ Insurance Companies
➢ Pension Funds
➢ Equipment Manufacturers
2. Intermediate-Term Financing
❑ Long-term financing usually refers to the borrowing of
money for a long period of time in order to invest in fixed
assets relatively permanent in nature with long life.
❑ The Two Common sources
I. Debt: Sources can be classified into two
➢ Term loans
➢ Bonds
II. Equity: Ownership money acquired through the sale of
common stocks, preferred stock and retained earnings.
3. Long-Term Financing
❑ Debt investors are entitled to a contractual set of cash
flows (interest and principal) whereas equity investors
have a claim of residual cash flows of the firm after it has
satisfied all other claims and liabilities
❑ Interest paid to debt investors represents a tax-deductible
expense whereas dividend paid to equity investors has to
come out of profit after tax.
❑ Debt has a fixed maturity whereas equity ordinarily has
infinite life.
❑ Equity investors enjoy the prerogative to control the
affairs of the firm whereas debt investors play a passive
role. However, they often impose certain restrictions on
the way the firm is run to protect their interests.
Equity vs. Debt
1. Common Stock
❑ Represents ownership capital as equity shareholders
collectively own the company.
➢ Bear risks of ownership
➢ Liable only to the amount of capital
❑ Rights and Position of Equity shareholders
➢ Right to income
➢ Right to control
➢ Pre-emptive right
➢ Right to Liquidation
Equity Capital
2. Preferred Stock
❑ Represents hybrid form of financing.
❑ Resembles Equity in the following ways
➢ Dividend is payable only out of distributable profits
➢ Preference dividend is not an obligatory payment
➢ Preference dividend is not a tax-deductible payment
➢ It is an expensive source of financing
❑ Resembles Debt in the following ways
➢ No right to vote
➢ Claims come before common stock
Equity Capital (Cont’d)
3. Retained Earnings
❑ Represents the only internal source of financing for
expansion and growth
❑ Advantages to the firm:
➢ Retained earnings are readily available: Low cost
➢ No dilution of control when the firm relies on retained
earnings
❑ Disadvantages to the firm:
➢ Limited
➢ High opportunity cost
Equity Capital (Cont’d)
1. Term Loans
❑ Represents a source of finance which is generally payable in 5
to 10 years.
❑ Used for acquisition of fixed assets and working capital margin
❑ Advantages:
➢ No dilution of control, debt owners do not interfere with the
firm
➢ Defaulting in case of decline goes to the debtors
➢ Issue costs of debt are significantly lower than those on equity
and preferred stock
Disadvantages:
• Debt financing entails fixed interest and principal
repayment obligation
Long-term Debt
2. Bonds
❑ Issue a bond with the promise of paying the investor
(Bond holding firm) a designated interest on his money at
certain scheduled intervals of time
❑ Term Bonds
❑ Serial Bonds
❑ Mortgage Bonds
❑ Debenture
❑ Callable bonds
Long-term Debt (Cont’d)
Collects and processes
financial information
Reports
information
to decision
makers
Managers
(internal)
Investors and
Creditors
(external)
Chapter 3
Firms Financial Operations
❑ The Accounting System
The Accounting System
Accounting System
Financial Accounting
System
Periodic financial
statements and related
disclosures
Managerial Accounting
System
Detailed plans and
continuous performance
reports
External Decision Makers
Investors, creditors,
suppliers, customers, etc.
Internal Decision Makers
Managers throughout the
organization
1. The Basic Financial Statements
Income Statement
Balance Sheet
Statement of Cash Flows
Statement of Retained Earnings
❑ Financial statements summarize the financial activities of
the business.
❑ Financial statements paint a picture of the transactions that
flow through the business.
The System
ASSETS
• Current
(Short-term)
• Fixed
(long-term)
• Other
LIABILITIES
• Current
• Long-term)
Shareholder’s
EQUITY
Debt
Stock
Sell Equity
Issue Debt
<Buy Assets>
<Buy Inventory>
Make Sales!
<Pay Costs>
<Pay Taxes>
Cash Flow
Balance Sheet Capital Supplied
3
4
Retain profits or
“repay” debt-holders
(with interest) and
stockholders (with
dividends)
Reta
in
Retu
rn
2 1
<Pay Interest>
<Pay Dividends>
❑ To inform the following parties of the financial
performance and position of the entity:
1)Management – for reviewing their performance during the
reporting period
2)Shareholders – for assessing the worth of their
investments and reviewing the effectiveness of the
Management
3)Investors – for judging the worth of the entity before
deciding to invest
4)Suppliers and Lenders – for judging the creditworthiness
of the entity before deciding to extend credit
5)Government – for calculating the amount of tax to be
collected
Purpose of Financial Statements
Let’s look at
Addis-Matador
CORP.’s
financial
statements.
Assets
❑ Current assets:
➢ Cash & securities
➢ Receivables
➢ Inventories
❑ Fixed assets:
➢ Tangible assets
➢ Intangible assets
Liabilities and Equity
❑ Current liabilities:
➢ Payables
➢ Short-term debt
❑ Long-term liabilities
❑ Shareholders' equity
1) Balance Sheet
Owns Owes
Addis-Matador CORP.
Balance Sheet
At December 31, 2006
(in thousands of dollars)
Assets
Cash 4,895
$
Accounts receivable 5,714
Inventories 8,517
Plant and equipment 7,154
Land 981
Total assets 27,261
$
Liabilities and Stockholders' Equity
Liabilities
Accounts payable 7,156
$
Notes payable 9,000
Total liabilities 16,156
$
Stockholders' Equity
Contributed capital 2,000
$
Retained earnings 9,105
Total stockholders' equity 11,105
Total liabilities and stockholders' equity 27,261
$
1. Name of entity
2. Title of statement
3. Specific date
4. Unit of measure
The
Balance
Sheet
reports the
financial
position of
an entity at
a particular
point in
time.
The Balance Sheet
Basic Accounting Equation
Assets = Liabilities + Stockholders’ Equity
Addis-Matador CORP.
Balance Sheet
At December 31, 2006
(in thousands of dollars)
Assets
Cash 4,895
$
Accounts receivable 5,714
Inventories 8,517
Plant and equipment 7,154
Land 981
Total assets 27,261
$
Liabilities and Stockholders' Equity
Liabilities
Accounts payable 7,156
$
Notes payable 9,000
Total liabilities 16,156
$
Stockholders' Equity
Contributed capital 2,000
$
Retained earnings 9,105
Total stockholders' equity 11,105
Total liabilities and stockholders' equity 27,261
$
Assets are
listed by their
ease of
conversion into
cash.
Cash
Amount of cash in the company’s bank
accounts.
Accounts
receivable
Amounts owed by customers from prior
sales.
Inventories
Parts and completed but unsold
products.
Plant and
equipment
Factories and production machinery.
Land Land on which factories are built.
Assets are
economic
resources
owned by the
business as a
result of past
transactions.
Addis-Matador CORP.
Balance Sheet
At December 31, 2006
(in thousands of dollars)
Assets
Cash 4,895
$
Accounts receivable 5,714
Inventories 8,517
Plant and equipment 7,154
Land 981
Total assets 27,261
$
Liabilities and Stockholders' Equity
Liabilities
Accounts payable 7,156
$
Notes payable 9,000
Total liabilities 16,156
$
Stockholders' Equity
Contributed capital 2,000
$
Retained earnings 9,105
Total stockholders' equity 11,105
Total liabilities and stockholders' equity 27,261
$
Liabilities are
debts or
obligations of
the business
that result from
past
transactions.
Accounts
payable
Amounts owed to suppliers for prior
purchases.
Notes
payable
Amounts owed on written debt
contracts.
Addis-Matador CORP.
Balance Sheet
At December 31, 2006
(in thousands of dollars)
Assets
Cash 4,895
$
Accounts receivable 5,714
Inventories 8,517
Plant and equipment 7,154
Land 981
Total assets 27,261
$
Liabilities and Stockholders' Equity
Liabilities
Accounts payable 7,156
$
Notes payable 9,000
Total liabilities 16,156
$
Stockholders' Equity
Contributed capital 2,000
$
Retained earnings 9,105
Total stockholders' equity 11,105
Total liabilities and stockholders' equity 27,261
$
Contributed
capital
Amounts invested in the business by
stockholders.
Retained
earnings
Past earnings not distributed to
stockholders.
Equity is the
amount of
financing
provided by
owners of the
business and
earnings.
Addis-Matador CORP.
Balance Sheet
At December 31, 2006
(in thousands of dollars)
Assets
Cash 4,895
$
Accounts receivable 5,714
Inventories 8,517
Plant and equipment 7,154
Land 981
Total assets 27,261
$
Liabilities and Stockholders' Equity
Liabilities
Accounts payable 7,156
$
Notes payable 9,000
Total liabilities 16,156
$
Stockholders' Equity
Contributed capital 2,000
$
Retained earnings 9,105
Total stockholders' equity 11,105
Total liabilities and stockholders' equity 27,261
$
Use $ on the
first item in a
group
and on the
group total.
Assets = Liabilities + Stockholders’ Equity
Addis-Matador CORP.
Income Statement
For the Year Ended December 31, 2006
(in thousands of dollars)
Revenues
Sales revenue 37,436
$
Expenses
Cost of goods sold 26,980
$
Selling, general and administrative 3,624
Research and development 1,982
Interest expense 450
Total expenses 33,036
Pretax income 4,400
$
Income tax expense 1,100
Net income 3,300
$
1. Name of entity
2. Title of statement
3. Specific date (Unlike the balance sheet, this
statement covers a specified period of time.)
4. Unit of measure
Addis-Matador CORP.
Income Statement
For the Year Ended December 31, 2006
(in thousands of dollars)
Revenues
Sales revenue 37,436
$
Expenses
Cost of goods sold 26,980
$
Selling, general and administrative 3,624
Research and development 1,982
Interest expense 450
Total expenses 33,036
Pretax income 4,400
$
Income tax expense 1,100
Net income 3,300
$
The Income Statement reports the
revenues less expenses of the
accounting period.
Addis-Matador CORP.
Income Statement
For the Year Ended December 31, 2006
(in thousands of dollars)
Revenues
Sales revenue 37,436
$
Expenses
Cost of goods sold 26,980
$
Selling, general and administrative 3,624
Research and development 1,982
Interest expense 450
Total expenses 33,036
Pretax income 4,400
$
Income tax expense 1,100
Net income 3,300
$
Revenues are earnings from the sale of goods
or services to customers.
Revenue is recognized in the period in which
goods and services are sold, not necessarily
the period in which cash is received.
Revenues
June 2006
Cash from sale
collected on June 10th.
X
May 2006
$1,000 sale made
on May 25th.
X
When will the revenue from this transaction be recognized?
Earnings from the sale of goods or services.
Revenue
May 2006
$1,000 revenue
recognized in May
June 2006
When will the revenue from this transaction be recognized?
Earnings from the sale of goods or services.
Addis-Matador CORP.
Income Statement
For the Year Ended December 31, 2006
(in thousands of dollars)
Revenues
Sales revenue 37,436
$
Expenses
Cost of goods sold 26,980
$
Selling, general and administrative 3,624
Research and development 1,982
Interest expense 450
Total expenses 33,036
Pretax income 4,400
$
Income tax expense 1,100
Net income 3,300
$
Expenses are the dollar amount of resources used
up by the entity to earn revenues during a period.
An expense is recognized in the period in which
goods and services are used, not necessarily
the period in which cash is paid.
Addis-Matador CORP.
Income Statement
For the Year Ended December 31, 2006
(in thousands of dollars)
Revenues
Sales revenue 37,436
$
Expenses
Cost of goods sold 26,980
$
Selling, general and administrative 3,624
Research and development 1,982
Interest expense 450
Total expenses 33,036
Pretax income 4,400
$
Income tax expense 1,100
Net income 3,300
$
Cost of
goods sold
The cost to produce products sold this
period. Production costs: direct costs
Selling,
general and
administrative
Operating expenses not directly related
to production.
Research and
development
Expenses incurred to develop new
products.
Interest
expense
The cost of using borrowed funds.
Income tax
expense
Income taxes on current period’s pretax
income.
Expenses
May 2006 June 2006
May 11 paid $75 cash
for newspaper ad.
X
Ad appears
on June 8th.
X
The dollar amount of resources used up by the
entity to earn revenues during a period.
When will the expense for this
transaction be recognized?
Expenses
May 2006 June 2006
Advertising expense
recorded in June.
The dollar amount of resources used
up by the entity to earn revenues
during a period.
When will the expense for this
transaction be recognized?
Addis-Matador CORP.
Income Statement
For the Year Ended December 31, 2006
(in thousands of dollars)
Revenues
Sales revenue 37,436
$
Expenses
Cost of goods sold 26,980
$
Selling, general and administrative 3,624
Research and development 1,982
Interest expense 450
Total expenses 33,036
Pretax income 4,400
$
Income tax expense 1,100
Net income 3,300
$
If expenses exceed revenues,
we report net loss.
Addis-Matador CORP.
Statement of Retained Earnings
For the Year Ended December 31, 2006
(in thousands of dollars)
Retained earnings, January 1, 2006 6,805
$
Net income for 2003 3,300
Dividends for 2003 (1,000)
Retained earnings, December 31, 2006 9,105
$
1. Name of entity
2. Title of statement
3. Specific date (Like the income statement, this
statement covers a specified period of time.)
4. Unit of measure
Addis-Matador CORP.
Statement of Retained Earnings
For the Year Ended December 31, 2006
(in thousands of dollars)
Retained earnings, January 1, 2006 6,805
$
Net income for 2006 3,300
Dividends for 2006 (1,000)
Retained earnings, December 31, 2006 9,105
$
The Statement of Retained Earnings reports the way
that net income and the distribution of dividends affect
the financial position of the company during a period.
Statement of Cash Flows
Because
revenues reported
do not always equal
cash collected. . .
. . . and expenses
reported do not
always equal
cash paid . . .
net income is
usually not equal
to the change
in cash for
the period.
Addis-Matador CORP.
Statement of Cash Flows
For the Year Ended December 31, 2006
(in thousands of dollars)
Cash flows from operating activities:
Cash collected from customers 33,563
$
Cash paid to suppliers and employees (30,854)
Cash paid for interest (450)
Cash paid for taxes (1,190)
Net cash flow from operating activities 1,069
$
Cash flow from investing activities:
Cash paid to purchase equipment (1,625)
$
Net cash flow from investing activities (1,625)
Cash flow from financing activities:
Cash received from bank loan 1,400
$
Cash paid for dividends (1,000)
Net cash flow from financing activities 400
Net decrease in cash during the year (156)
$
Cash at beginning of the year 5,051
Cash at end of the year 4,895
$
1. Name of entity
2. Title of statement
3. Specific date (Like the income statement and
statement of retained earnings, this
statement covers a specified period of time.)
4. Unit of measure
Addis-Matador CORP.
Statement of Cash Flows
For the Year Ended December 31, 2006
(in thousands of dollars)
Cash flows from operating activities:
Cash collected from customers 33,563
$
Cash paid to suppliers and employees (30,854)
Cash paid for interest (450)
Cash paid for taxes (1,190)
Net cash flow from operating activities 1,069
$
Cash flow from investing activities:
Cash paid to purchase equipment (1,625)
$
Net cash flow from investing activities (1,625)
Cash flow from financing activities:
Cash received from bank loan 1,400
$
Cash paid for dividends (1,000)
Net cash flow from financing activities 400
Net decrease in cash during the year (156)
$
Cash at beginning of the year 5,051
Cash at end of the year 4,895
$
The Statement of Cash Flows reports the inflows
and outflows of cash during the period in the
categories of operating, investing, and financing.
Sell Equity
Issue Debt
<Buy Assets>
<Buy Inventory>
Make Sales!
<Pay Costs>
<Pay Taxes>
“Natural”
Cash Flows
<Pay Interest>
<Pay Dividends>
Sell Equity
Issue Debt
<Pay Dividends>
<Buy Assets>
Make Sales!
<Buy Inventory>
<Pay Costs>
<Pay Taxes>
<Pay Interest>
Cash flow statement
Classifications
Financing
Investing
Operating
=NET CASH FLOW
Addis-Matador CORP.
Statement of Cash Flows
For the Year Ended December 31, 2006
(in thousands of dollars)
Cash flows from operating activities:
Cash collected from customers 33,563
$
Cash paid to suppliers and employees (30,854)
Cash paid for interest (450)
Cash paid for taxes (1,190)
Net cash flow from operating activities 1,069
$
Cash flow from investing activities:
Cash paid to purchase equipment (1,625)
$
Net cash flow from investing activities (1,625)
Cash flow from financing activities:
Cash received from bank loan 1,400
$
Cash paid for dividends (1,000)
Net cash flow from financing activities 400
Net decrease in cash during the year (156)
$
Cash at beginning of the year 5,051
Cash flows directly related to
earning income are shown in the
operating section.
Addis-Matador CORP.
Statement of Cash Flows
For the Year Ended December 31, 2006
(in thousands of dollars)
Cash flows from operating activities:
Cash collected from customers 33,563
$
Cash paid to suppliers and employees (30,854)
Cash paid for interest (450)
Cash paid for taxes (1,190)
Net cash flow from operating activities 1,069
$
Cash flow from investing activities:
Cash paid to purchase equipment (1,625)
$
Net cash flow from investing activities (1,625)
Cash flow from financing activities:
Cash received from bank loan 1,400
$
Cash paid for dividends (1,000)
Net cash flow from financing activities 400
Net decrease in cash during the year (156)
$
Cash at beginning of the year 5,051
Cash at end of the year 4,895
$
Cash flows related to the
acquisition or sale of productive
assets are shown in the
investing section.
Addis-Matador CORP.
Statement of Cash Flows
For the Year Ended December 31, 2006
(in thousands of dollars)
Cash flows from operating activities:
Cash collected from customers 33,563
$
Cash paid to suppliers and employees (30,854)
Cash paid for interest (450)
Cash paid for taxes (1,190)
Net cash flow from operating activities 1,069
$
Cash flow from investing activities:
Cash paid to purchase equipment (1,625)
$
Net cash flow from investing activities (1,625)
Cash flow from financing activities:
Cash received from bank loan 1,400
$
Cash paid for dividends (1,000)
Net cash flow from financing activities 400
Net decrease in cash during the year (156)
$
Cash at beginning of the year 5,051
Cash at end of the year 4,895
$
Cash flows from or to investors
or creditors are shown in the
financing section.
Addis-Matador CORP.
Statement of Cash Flows
For the Year Ended December 31, 2006
(in thousands of dollars)
Cash flows from operating activities:
Cash collected from customers 33,563
$
Cash paid to suppliers and employees (30,854)
Cash paid for interest (450)
Cash paid for taxes (1,190)
Net cash flow from operating activities 1,069
$
Cash flow from investing activities:
Cash paid to purchase equipment (1,625)
$
Net cash flow from investing activities (1,625)
Cash flow from financing activities:
Cash received from bank loan 1,400
$
Cash paid for dividends (1,000)
Net cash flow from financing activities 400
Net decrease in cash during the year (156)
$
Cash at beginning of the year 5,051
Cash at end of the year 4,895
$
The statement ends with a
reconciliation of Cash.
Relationship Among the Financial Statements
Addis-Matador CORP.
Income Statement
For the Year Ended December 31, 2006
(in thousands of dollars)
Revenues
Sales revenue 37,436
$
Expenses
Cost of goods sold 26,980
$
Selling, general and administrative 3,624
Research and development 1,982
Interest expense 450
Total expenses 33,036
Pretax income 4,400
$
Income tax expense 1,100
Net income 3,300
$ Addis-Matador CORP.
Statement of Retained Earnings
For the Year Ended December 31, 2006
(in thousands of dollars)
Retained earnings, January 1, 2006 6,805
$
Net income for 2006 3,300
Dividends for 2006 (1,000)
Retained earnings, December 31, 2006 9,105
$
Net income from the
income statement
increases ending
retained earnings on the
statement of retained
earnings.
Relationship Among the Financial Statements
Addis-Matador CORP.
Statement of Retained Earnings
For the Year Ended December 31, 2006
(in thousands of dollars)
Retained earnings, January 1, 2003 6,805
$
Net income for 2003 3,300
Dividends for 2003 (1,000)
Retained earnings, December 31, 2003 9,105
$
Ending retained earnings
from the statement of
retained earnings is one
of the components of
stockholders’ equity on
the balance sheet.
Addis-Matador CORP.
Balance Sheet
At December 31, 2006
(in thousands of dollars)
Assets
Cash 4,895
$
Accounts receivable 5,714
Inventories 8,517
Plant and equipment 7,154
Land 981
Total assets 27,261
$
Liabilities and Stockholders' Equity
Liabilities
Accounts payable 7,156
$
Notes payable 9,000
Total liabilities 16,156
$
Stockholders' Equity
Contributed capital 2,000
$
Retained earnings 9,105
Total stockholders' equity 11,105
Total liabilities and stockholders' equity 27,261
$
Relationship among the Financial Statements
The change in cash on the statement of cash flows added to the
beginning of the year balance in cash equals the ending balance in
cash on the balance sheet.
Addis-Matador CORP.
Balance Sheet
At December 31, 2006
(in thousands of dollars)
Assets
Cash 4,895
$
Accounts receivable 5,714
Inventories 8,517
Plant and equipment 7,154
Land 981
Total assets 27,261
$
Liabilities and Stockholders' Equity
Liabilities
Accounts payable 7,156
$
Notes payable 9,000
Total liabilities 16,156
$
Stockholders' Equity
Contributed capital 2,000
$
Retained earnings 9,105
Total stockholders' equity 11,105
Total liabilities and stockholders' equity 27,261
$
Addis-Matador CORP.
Statement of Cash Flows
For the Year Ended December 31, 2006
(in thousands of dollars)
Cash flows from operating activities:
Cash collected from customers 33,563
$
Cash paid to suppliers and employees (30,854)
Cash paid for interest (450)
Cash paid for taxes (1,190)
Net cash flow from operating activities 1,069
$
Cash flow from investing activities:
Cash paid to purchase equipment (1,625)
$
Net cash flow from investing activities (1,625)
Cash flow from financing activities:
Cash received from bank loan 1,400
$
Cash paid for dividends (1,000)
Net cash flow from financing activities 400
Net decrease in cash during the year (156)
$
Cash at beginning of the year 5,051
Cash at end of the year 4,895
$
2. Financial Analysis
❑ Assessment of the firm’s past, present and future financial
conditions
❑ Done to find firm’s financial strengths and weaknesses
❑ Primary Tools:
➢ Financial Statements
➢ Comparison of financial ratios to past, industry, sector
and all firms.
1. Common Size Financial Statements
❑ Each component of the statement is represented in terms
of percentages.
➢ Income statement: Each item is calculated as a percent
of net sales
➢ Balance sheet: Each item is calculated as a percent of
assets or total liabilities and stockholder’s equity.
Financial Analysis (Cont’d)
2. Comparative (Common-Base year) Financial Statements
➢ Financial information reported side by side in vertical columns
to see relationship and trends between years.
➢ Trend Analysis
➢ Horizontal analysis shows birr and percent changes from year
to year.
3. All Financial Statement ratios should be compared to:
❑ Should analyze ratios based upon standards of comparison
such as
I. Industry ratios and standards
II. Similar businesses in the same industry (competition)
III. Past performance ratios.
IV. Prior years operating results
Ratio Analysis
❑ Liquidity: Can we make required payments?
❑ Debt management: Right mix of debt and equity?
❑ Asset management: Right amount of assets vs. sales?
❑ Profitability: Do sales prices exceed unit costs, and are
sales high enough as reflected in PM, ROE, and ROA?
a) Liquidity Ratios
❑ An asset that can be converted to cash quickly without
having to reduce asset’s price very much.
❑ Current Ratio:
s
liabilitie
Current
assets
Current
ratio
Current =
❑ Quick or Acid Test Ratio: Is calculated by deducting
inventory from current assets as a proportion of current
liabilities
s
liabilitie
Current
s
Inventorie
-
assets
Current
ratio
Quick =
b) Leverage Ratios
❑ Debt Ratio
The ratio of total debts to total assets: measures the
percentage of funds provided by creditors
Assets
Total
Debt
Total
Ratio
Debt =
❑ Times-Interest-Earned (TIE) Ratio
The ratio of earnings before interest and taxes (EBIT) to
interest charges; a measure of the firm’s ability to meet its
annual interest payments.
charges
Interest
EBIT
ratio
coverage
Interest =
c) Profitability Ratios
❑ A group of ratios that show the combined effects of
liquidity, asset management, and debt on operating results.
❑ Gross profit margin
This ratio shows the margin left after meeting production
costs. It measures the efficiency of production and pricing.
Income
profit
Gross
margin
profit
Gross =
❑ Return on Capital Employed
A measure of how efficiently the capital is employed. A key indicator of
profitability of a firm. Firms that are efficiently using their assets have a
relatively high return. Less efficient firms have a lower return.
Assets
Current
profit
Net
employed
capital
on
Return =
Profitability Ratios (cont’d)
❑ Return on Equity
Profit indicator to shareholders. The ratio indicates the degree to
which the firm is able to convert equity to generate net profit
that eventually can be claimed by shareholders
equity
Total
profit
Net
equity
on
Return =
d) Asset Management Ratios (Turnover)
❑ The asset management ratios measures how effectively the
firm is managing its assets
❑ Inventory turnover ratio
This ratio is calculated by dividing sales by inventories
s
Inventorie
Sales
ratio
turnover
Inventory =
Asset Management Ratios (Cont’d)
Assets
Total
Sales
ratio
over
Asset turn
Total =
❑ Total Asset turnover ratio
Measures how efficiently assets are employed
❑ Fixed Asset turnover ratio
Measures how efficiently fixed assets are employed
assets
fixed
Net
Sales
ratio
over
Asset turn
Fixe =
Investment Decisions
Chapter 4
Chapter Summary
1. Discuss the time value of money and standard
calculations showing the relationship b/n PV and FV.
2. Discuss different methodologies of economic analysis for
investment appraisal.
3. Discuss how to budget capital on contract investment and
how to establish ROCE and Mark-up in corporate budget
planning.
4. Identify the different systems of control levels to monitor
capital allocated for investment.
Introduction
❑ Investment is decision making process by which firms
evaluate the purchase of fixed assets
❑ Investment policy is the firm’s formal planning process
❑ Significance of investment:
➢ substantial expenditure
➢ long time period
➢ sales forecasts
➢ investment appraisal
➢ planning horizon
❑ Investor prefer to receive payment of a fixed amount of
money today, rather than an equal amount in the future.
Why?
➢ People prefer current consumption to future
➢ To account for opportunity cost (to the least the interest
payment)
4.1. The time value of money
CF0 CF1 CF3
CF2
0 1 2 3
I%
❖ Show the timing of cash flows.
❖ Tick marks occur at the end of periods, so Time 0 is today;
Time 1 is the end of the first period (year, month, etc.) or
the beginning of the second period.
4.1. The time value of money (cont.…)
General Assumption:
❑ Cash Flows (CFs) occur at the END of the period, unless
stated otherwise.
❑ Payments (PMTs) occur at the END of the period (ordinary
annuity), unless stated otherwise.
CFs can either be:
I. Lump Sum (Birr1000 to be received in 1 year or 5 years,
or Birr1000 invested today), or
II. Recurring CFs (non-constant CFs), e.g. B100 in YR1,
B200 in YR 2, B300 in YR3) or
III. PMTs (constant CFs, e.g. B100 per year for 3 years).
❑ Financial investments involve cash flows occurring at
different points in the time series.
❑ Cash flows have to be brought to the same point
1. Present and future value of a single amount
A. Simple interest: no interest is earned on the interest.
❑ Interest is accounted only for the principal
4.1. The time value of money (cont.…)
FVn= PV (1+nr)
Where,
PV= is the value at time=0
FV= is the value at time=n
r=is the rate at which the amount will be compounded
each period
n= is the number of periods
B. Compound interest: interest payment is reinvested.
FV = PV (1+r)n
Where,
PV= is the value at time=0
FV= is the value at time=n
r=is the rate at which the amount will be compounded each
period
n= is the number of periods
4.1. The time value of money (cont.…)
Relationship b/n PV and FV
PV
Simple Interest
Comp. Interest
Period
FV
4.1. The time value of money (cont.…)
2. Present Value of uneven series
• Present value of uneven cash flow stream
r = discount rate
CF0 A1 A3
A2
0 1 2 3
I%
(1+r)1
An
PVn = A1
+
(1+r)1
A2
+
(1+r)2
….+
(1+r)n
4.1. The time value of money (cont.…)
3. Present Value of Annuity
❑ Constant cash flow at regular interval of time.
CF0 A A
A
0 1 2 3
I%
1
r
(1 - )
PVn = A( )
1
(1+r)n
4. Future Value of Annuity
FVn = A( )
(1+r)n - 1
r
4.1. The time value of money (cont.…)
4.2 Investment Appraisal
❑Investment proposals are evaluated from different
dimensions:
➢ Economic evaluation
➢ Social benefit
➢ Environmental impact
➢ Consistent with local and nation development plan
➢ Others….
❑Topic focus: Economic evaluation for investment
appraisal
❑ Important investment evaluation methods:
1. payback period
2. Net Present Value (NPV)
3. Internal Rate of Return (IRR)
4. Cost-Benefit Analysis
5. Cost-effective Analysis
6. Multi-criteria Analysis
7. Liner programming
8. Dynamic Programming
4.2 Investment Appraisal (cont…)
❑ Payback period is the expected number of years required
to recover the original investment.
❑ It measures risk, not return.
❑ The shorter the payback period, the more desirable will be
the project
❑ First the maximum acceptable payback period (nmax) is
specified against which the calculated payback period (n)
is compared.
4.2 Investment Appraisal (cont…)
❑ Standard method for the financial appraisal of long-term
projects
❑ Used for capital budgeting, and widely throughout
economics, it measures the excess or shortfall of cash
flows, in present value (PV) terms, once financing charges
are met.
❑ Indicator of how much value an investment or project
adds to the value of the firm.
4.2.2 The Net Present Value (NPV)
4.2 Investment Appraisal (cont…)
• NPV is calculated as:
4.2.2 NPV (cont…)
NPV = Σ Bt (1 + r)-t - Σ Ct (1 + r)-t
Where, Bt = Benefit or return at the end of year t
Ct = Cost outlay or investment at the end of year t
r = required return (discount rate)
t = time of the cash outlay
n = total time of the project
t=1
n
t=1
n
4.2 Investment Appraisal (cont…)
•In financial theory, if there is a choice between two mutually
exclusive alternatives, the one yielding the higher NPV should be
selected
•The rate used to discount future cash flows to their present
values is a key variable of this process
•Most firms have a well defined policy regarding their capital
structure, so the weighted average cost of capital (after tax) is
used as the discount rate
•Another method is to use a variable discount rate with higher
rates applied to cash flows occurring further along the time span,
(reflecting the yield curve premium for long-term debt).
4.2.2 NPV (cont…)
4.2 Investment Appraisal (cont…)
•It is appropriate to use higher discount rates to
adjust for risk for riskier projects
•If a project offers a high risk, the reqiured return
on the project will also be high.
4.2.2 NPV (cont…)
Degree of Risk
Expected
Return
4.2 Investment Appraisal (cont…)
• Procedure for analysis using NPV
1. Find the present value of each cash flow, including
both inflows and outflows, discounted at the
projects cost of capital
2. Sum this discounted cash flows: NPV
3. Evaluate based on the value of 2 above
4.2.2 NPV (cont…)
0 1 2 3
−100.00 10 60 80
9.09
49.59
60.11
NPV = 18.79
4.2 Investment Appraisal (cont…)
If… It means... Then...
NPV > 0
the investment
would add value
to the firm
The project may be accepted
NPV < 0
the investment
would subtract
value from the
firm
The project should be rejected
NPV = 0
the investment
would neither
gain nor lose
value for the
firm
We should be indifferent in the
decision whether to accept or reject
the project. This project adds no
monetary value. Decision should be
based on other criteria, e.g. strategic
positioning or other factors not
explicitly included in the calculation.
4.2.2 NPV (cont…)
4.2 Investment Appraisal (cont…)
•Is the discount rate that equates the present value
of the project’s expected cash inflow’s to the
present value of the project’s costs.
PVinfows = PVinvestment costs
IRR is a rate that brings NPV=0
4.2.3 Internal Rate of Return (IRR)
0 1 2 3
−100.00 10 60 80
100.00
NPV = 0
4.2 Investment Appraisal (cont…)
•The use of the IRR always leads to the selection of the same project,
•project selection using the NPV method depends on the discount
rate chosen,
•NPV and IRR could result in different selections
Comparing NPV and IRR
4.2 Investment Appraisal (cont…)
•It is similar to NPV in the way one compares the value added.
•Compares the value added per the cost incurred and used to
evaluate projects of different sizes.
4.2.4 The Cost Benefit Ratio (CBR)


=
−
=
−
+
+
= n
t
t
n
t
t
r
C
r
B
CBR
1
1
1
1
)
1
(
)
1
(
4.2 Investment Appraisal (cont…)
Cash Flow Forecasting
• The most important, but also the most difficult,
step in capital budgeting is estimating projects’
cash flows
• The investment outlays and the annual net cash
inflows after a project goes into operations
• Relevant Cash flows
The specific cash flows that should be considered in a capital
budgeting decisions. Rules:
1. Capital budgeting decisions must be based on cash
flows, not accounting income.
2. Only incremental cash flows are relevant. Costs that
occur iff we accept the project.
4.2 Investment Appraisal (cont…)
Cash Flow Forecasting
• Annuity
• Constant stream of payments
• Lease, rent, etc
• Random
• Construction business for contractors is expected to
be increasing
• Individual contract amount takes the form of the S-
curve
The Cash flows typically include the following items:
1. Initial investment outlay
2. Operating cash flows over the project’s life
3. Terminal year cash flows
4.2 Investment Appraisal (cont…)
Cash flows of a construction company occur as a result
of the contractual and credit arrangements existing on
a series of contracts within any trading period.
Sources of finance on contracts:
 Internal Source
- generated from the companies operation
- most of they are locked up b/c:
→ Stage payment
→ Disagreement
 External Sources
- from lenders based on interest
4.3 Capital Budgeting on Contract investment
The two parameters that affect a construction company’s profitability:
1. The company's ROCE
2. The mark-up on contract costs to achieve the desired ROCE
To determine firm’s mark-up target, it is required establish:
i) Return on Capital Employed (ROCE)
Represents return anticipated by the company in relation with the total
capital employed.
• Successful measurement of profitability
• Starting parameter for budgeting and performance measurement
• Determined at the head office level
• Collected from cash flow of individual contract through inclusion of
Mark-up
4.3.1 Establishing ROCE and Mark up in Corporate Budget
Planning
ROCE is made to account for the following costs:
•The average weighted cost of capital (interest of capital
employed)
•Profit margin (dividends, capital reserves...)
•Corporate obligations such as taxations and deprecation
costs.
•Contingencies to cover uncertainties (Risks)
ii) Annual Turnover on contracts.
•This can be obtained from the firm’s short-term plan
committed or planned for execution in the current year.
• One of the items in the Mark-up
• Costs entitled in administrating the company and providing off-site services
• The amount of GOC for individual project is decided by management as
part of their policy.
• Vary with individual firms, but broadly includes (within a company’s
accounts )
- rent on office and yard
- fees, salaries and wages for directors and office staff
- office equipment, stationary, telephones, cars
- office heating and lighting
- insurance on office and staff
• Estimated as the percentage of expected turnover
iii) General overhead costs (off-site
administration):
Steps to reach at company’s Mark- up
Step 1. Estimate total capital to be employed for the
fiscal year (TCE)
- estimated from the Balance Sheet of the
Company
Assets Liabilities
Current Assets
Cash…………….
Marketable securities ….
Account Receivables…….
Inventories…………..
Other current assets….
Fixed assets
Buildings…….
Machineries……
Equipments…..
Land……………..
Current Liabilities
Short term loans………
Account payable……….
Accrued income taxes…….
Current payments due on
Long-term dept…..
Other current liabilities….
Step 2. Determine ROCE as the percentage of the TCE.
- Average weighted cost of capital (interest of capital employed)……***% TCE
- Profit Margin (dividends and reserves)……………………………………….***% TCE
- Corporate obligations (tax, deprecation)…………………………………….***% TCE
- Contingencies to cover uncertainties (risk) ………………………………..***% TCE
ROCE…………………………………….Σ***% TCE
Step 3. Estimate expected turnover for the fiscal year
۰ This can be obtained
- from the firm’s short-term plan committed, or
- planned for execution in the current year.
Steps to reach at company’s Mark-Up (cont…)
Step 4. Determine the General Overhead Cost (GOC)
- Estimated as the percentage of the annual turnover
- based on the previous year’s turnover
GOC…………………***% Turnover
Step 5. Determine the Mark-up
Mark-up (Head Office) = GOC + ROCE
Step 6. Determine the Total Production Cost (TPC)
Σ Production Cost = Turnover – Mark-up
Step 7. Determine Mark-up individual Project
Steps to reach at company’s Mark-Up (cont…)
TPC
mark-up
mark-up at individual project = *100%
Example
The following is the balance sheet of a G5 contractor.
Additional information are also outlined following this.
Assets Liabilities
Current Assets
550,000
Fixed assets
230,000
.
Total Assets: 780,000
Current Liabilities
450,000
Loans 153,234
Preference shares 11,766
Share Capital 32,080
Retained Earnings 132,920
Total L and E 780,000
Example (cont’d)
1. Total Capital Employed (TCE from the BS)
2. The following shows return on the capital employed:
i. Average weighed cost of capital…………….6.5%
ii. Profit margin: ………………………………….....6%
iii. Corporate obligations……………………………4.5%
iv. Contingences to cover uncertainties ……..3%
3. Planned total turnover
The company is planning for a total turnover of
Birr2,500,000 in the fiscal year
4. Administrative Expense
The previous year’s overhead cost was Birr150,000
while its total turnover was Birr2,000,000.
1. Estimate the total mark-up of the company at the head
office and the mark-up on individual contracts.
2. The company is invited to tender for a construction of a
school building with a direct cost of Birr2,000,000 and
estimated site overhead of 6%. What will be the minimum
amount of the contract price that will be offered by the
procurement committee?
4.3.2 The Corporate Budget
• is the starting point for setting up a monitoring and reporting
system
• reference point against which the measurement of financial
performance and the achievement of planned objectives are
made
Corporate Budget (Cash Outlay)
= Administrative Cost + ∑ Capital Required by
Individual Contracts
This has to be balanced with:
Capital Budget (Cash Inflow)
= Net Working Capital + Finance Sources (Debt,
Sales of stocks, Sales of Fixed Assets)
4.4 A System of control levels
• There are different control levels in a construction company:
1. Managing Director Level
2. Contracts Management level
3. Site management level
Control Responsibility Components
•Managing Director Level
➢ Major Contracts production Costs
➢ Administrative Expenses
➢ Return on Capital Employed
•Contract Management Level
➢ Production Costs of Different Contracts
•Site Management Level
➢ Direct Cost of projects:
Labor Cost
Material Cost
Plant Cost
Responsibility
level
Responsibilities Statement used
General
Management
Turnover Control
Overhead control
Account
Management
Corporate
budget
(master Budget)
Contracts
Management
Contract Cost
Management
Contract Budget
Statement
Operational
Budget Statement
Control Statement
Site
Management
Activity Cost
Control
Activity Cost
Statement
Operational
statement
Monitoring and Control at Contract
Management Level
• At this level comparison between the estimated
and actual cash flow takes place
• Contract Managers produce three basic control
statements at Contract Management Level with the
help of quantity surveyors.
1. Contract Budget Statement
2. Operational Budget Statement
3. Control Statement
1. Contract Budget Statement
Operations
Labor
cost
Material
cost Equip.
Cost
Sub-
Cont.
Total
Cost
(BCWS)
Value Margin
Site
Overhead
Earth Work
Concrete Work
Exterior Works
Roofing
TOTAL * ** ***
* Production Costs
** Tender Sum
*** Contract Markup by the corporate
2. Operational Budget Statement
• After the contract budget is prepared,
operational budget is produced on monthly basis
using the contract work Program
• Has two primary functions:
1. Provide managers with cost data on
monthly basis
2. Enable managers at each level to take decisions or
implement corrective actions when necessary
Operational Budget Statement/sample
Operations
Total
Budget
Cost
Sep., 2007 Oct., 2007
Cost
(BCWP)
Value Margin
Cost
(BCWP)
Value Margin
Site Overhead
Earth Work
Concrete
Work
Exterior
Works
Roofing
BCWS
Monthly
Total
Cum. Total
3. Control Statements
It is of vital importance that the value of the work
carried out is accurately monitored and adequately
recorded and presented for agreement and
subsequent payment by the client
Performance Measurement & Evaluation
C
O
S
T
TIME
Current Situation Planned Completion
Planned
Budget
ACWP
BCWP
BCWS
EAC
ETC
CV
SV
Forecast Time Overrun
Forecast Cost Overrun
Performance Measurement & Evaluation
CHAPTER 5
Working Capital Management
❑ Working Capital: all the short term assets used in daily
operations.
❑ Differ from capital budgeting;
➢ Timing : short term
➢ Swift transformation into other asset
Definitions
❑ Gross Working Capital (WC): Total current assets used in
operations.
❑ Net Working Capital: Current assets – Current liabilities.
❑ Working Capital Policy: basic policy decisions as to:
1. the level of each type of current asset, and
2. how current assets will be financed.
❑ Working Capital Management: Controlling cash,
inventories, and A/R, plus Short-Term liability
management.
❑ Setting the WC policy and carrying out the policy in day-
to-day operations
ABC appears to have large amounts of working capital
given its level of sales.
Selected Ratios--ABC plc.
ABC Industry
Current 1.75x 2.25x
Quick 0.83x 1.20x
Debt/Assets 58.76% 50.00%
Turnover of cash & securities 16.67x 22.22x
DSO (days) 45.00 32.00
Inv. turnover 4.82x 7.00x
F. A. turnover 11.35x 12.00x
T. A. turnover 2.08x 3.00x
Profit margin 2.07% 3.50%
ROE 10.45% 21.00%
5.1 Working Capital Policy
How does ABC’s working capital policy compare
with the industry?
❑ Working capital policy is reflected in current ratio, quick
ratio, turnover of cash and securities, inventory turnover,
and DSO.
❑ These ratios indicate ABC has large amounts of working
capital relative to its level of sales. ABC is either very
conservative or inefficient.
Is ABC inefficient or just conservative?
❑ A conservative (relaxed) policy may be appropriate if it
leads to greater profitability.
❑ However, ABC is not as profitable as the average firm in
the industry. This suggests the company has excessive
working capital.
5.1.1 Characteristics of Current Assets
Finished Goods
Accounts Receivable
Work in Progress
Wages, Salaries, Overheads
Raw Materials
Suppliers
Cash
5.1.2 Operating Cycle and Cash Cycle
❑ Investments in working capital are influenced by four
key events in the production and sales cycle of the firm:
➢ Purchase of raw materials,
➢ Payment for raw materials,
➢ Sale of finished goods
➢ Collection of cash sales
Operating Cycle and Cash Cycle
Order
Stock
arrives
Credit
Invoice
Cash paid for
Materials
Cash
Received
Accounts Receivable
Inventory Period
Accounts
Payable
Operating Cycle
Cash Cycle
5.1.3 Factors affecting WC Requirements
1. Sales Volume: some level of WC is required to support
steady sales.
2. Nature of business: length of operating cycle
3. Market condition: Competition can guide WC policy
(credit sales, stock levels)
4. Conditions of Supply: prompt and adequate supply lowers
level of inventory and lead time (JIT).
5.1.4 Cash Requirement for WC
❑ As a finance manager, one will be interested in figuring out
how much cash to arrange to meet the working capital need
of the firm.
Step 1. Estimation of the cash cost of various current assets
required by the firm
Step 2. Deduct the current liabilities from the cash cost of
current assets
5.2 Cash and Liquid Management
❑ All money items and sources that are immediately
available to help pay a firm’s bills
❑ Treasury bills: unconditional promise by the government’s
treasury agent
❑ Commercial Paper: short-term unsecured promissory notes
issued by firms
❑ Certificate of Deposit: represents a negotiable receipt of
funds deposited in a bank for a fixed period
5.2.1 How large a cash balance is needed?
1. Transaction needs: A firm needs cash to carry out the day-
to-day functions of the business.
2. Contingency needs: For unexpected occurrences or
emergencies that require cash.
3. Opportunity needs: The chance to profit from having cash
available.
5.2.2 Forecasting Cash Flow
❑ Determining the amounts and timing of future inflows and
outlays of cash.
Failure of forecast casts risks as:
1. Default: unable to pay interest or principal on borrowings
2. Overdue bills: failure to pay short term obligations (A/P)
3. Lost savings on purchases: loss of discounts on cash
purchases
5.3 Credit Management
Why Credit?
1. Competition: causes firms to sell on credit to attract
customers
2. Facilitates Sales: as it augments customers resources
Finished
Goods
On
Credit
Accounts
Receivables
Accounts
Payable
Debtors
Creditors
5.3 Credit Management (cont’d)
Accounts Receivable makes a major component of a firms
working Capital Needs, Investment in A/R depends on:
1. How much the firm sales on credit, and
2. How long it takes to collect the receivables:
5.3.1 Terms of Payment
Order Delivery
Converted to
cash
Sale
Cash in
Advance
Cash on
Delivery
Cash Terms Credit Terms
Terms of payment vary widely in practice.
5.3.1 Terms of Payment (Cont’d)
Credit Terms can be:
i. Open Account: time available between the shipment and
invoice
ii. Bill of Exchange: a more secure arrangement that represents
an unconditional order by the seller asking the buyer to pay
on demand or at certain future date, the amount specified on
it
iii.Consignment: agent relationship between the seller and the
buyer
iv.Letter of Credit: issued by a bank on behalf of its customer
to the seller.
◼ Lower Credit risk & uncertainty, safety to the buyer
5.3.2 Costs of Maintaining Receivables
As with all assets and operations, the willingness to allow
credit sales involve certain costs :
i. Financing the Receivables
ii. Administrative and collection expenses
iii. Bad Debt loss
5.3.3 Policies for Managing Receivables
The firm should establish its receivable policies after carefully
considering both the benefits and costs of different policies.
I. Profit: Costs (tied up, collection, bad debt, discounts) should be
compared with additional sales as a consequence of a proposed
policy. Degree of relaxing a policy as determined by residual
income:
II. Growth in Sales: growth is so important aside from profits, it
should be viewed as a separate factor in determining receivable
policies. ( ) ( ) ( )
k
I
r
S
p
S
R 
−

−

=

5.3.4 Credit Policy Variables
The credit policies have a bearing on the level of sales, bad debt loss, discounts
taken by customers, and collection expenses. The important dimensions are:
i. Credit Standards: What standard should be applied in accepting or
rejecting an account for credit granting? Can range from Liberal to stiff
credit policy …
ii. Credit Period: Has a direct proportionality with sales
iii. Cash Discount: Firms generally offer cash discounts to induce customers
to make prompt payments.
iv. Collection Effort: aimed at timely collection of the R & consists of:
• Monitoring the state of receivables,
• Dispatch of letters to customers whose due date is approaching,
• Electronic and telephonic advice to customers around the due date,
• Threat of legal action to overdue accounts,
• Legal action against overdue accounts.
5.4 Inventory Management
Defn: Goods held for eventual resale by the firm.
Three types of inventories:
i. Raw Materials
ii. Goods in Process: materials committed to the
production process but have not been completed
iii. Finished Goods: ready for sale. Final output of
the production process. “Merchandise inventory”
5.4.1 Benefits of holding inventory
Inventories are used to provide cushions so that the purchasing, production,
and sales functions can proceed at their own optimum paces.
i. Avoiding Losses of Sales: Ability of a firm to give quick service and to
provide prompt delivery is closely tied to the proper management of
inventory
ii. Gaining Quantity Discounts: to make bulk purchases of goods at large
discounts.
iii. Reducing Order Costs: Forms must be typed, checked, approved and
mailed; when goods arrive, they must be accepted, inspected and
counted.
iv. Achieving Efficient Production Runs: If the firm has to change setups
frequently, it would experience high unit costs of production.
5.4.1 Benefits of holding inventory (Cont’d)
Firms
Hold
Inventories
To
Purchasing
Producing
Selling
Avoid Losses
of Sales
Gain Quantity
Discounts
Reduce Order
Costs
Achieve
Efficient
Production
Separate Which
Helps
5.4.2 Costs of holding inventory
The effective management of inventory involves a tradeoff between having
too little and also too much inventory.
Inventory costs:
i. Ordering Costs: requisitioning, preparation of purchase order,
expediting, transport and receiving and placing in storage, set-up
costs
ii. Carrying Costs: interest on capital locked up in inventory, storage
and handling costs, insurance, depreciation, and property taxes.
iii. Shortage Costs: arise when inventories are short of requirement for
meeting the needs of production or the demand of customers.
◼ Loss of sales, loss of customer goodwill, disruption of production
schedules.
5.4.3 Inventory Management – Minimizing Costs
• The goal of effective inventory management is to minimize the total
costs that are associated with ordering and holding inventories.
• Choose the level of inventory with the lowest total cost after estimating
the different expenses with varying inventory levels.
5.4.3 Inventory Management – Minimizing Costs
(Cont’d)
The two basic questions relating to inventory mgt
◼ Size of the Order: Q optimal
◼ The Level to Order: Q level
10
10 20 30 40 50 60 Units
0
Costs
Total Cost
Carrying Cost
Ordering Cost
Optimum
Level
i) Order Quantity
Economic Order Quantity (EOQ)
◼ The Economic Order Quantity refers to the order
size that will result in the lowest total of order and
carrying costs for an item of inventory.
◼ Order costs increase as number of orders increase
◼ Carrying costs increase as large stocks are kept
Variables in the EOQ model:
U: The forecast usage/demand for goods or raw materials
for a year is known,
Q: Quantity Ordered,
F: Cost per Order,
C: Percent Carrying Cost
P: Price per Unit,
TC: Total Costs of ordering and carrying
i) Order Quantity
Economic Order Quantity (EOQ)
The total cost of ordering and carrying is minimized
when the derivative of the above equation is equated
to zero:
( ) ( )( )
C
P
Q
F
Q
U
TC
2
+
=
0
2
2
=
+
−
=
PC
Q
UF
dQ
dTC
PC
UF
Q
2
2
=
PC
FU
Q
2
=
i) Order Quantity
Economic Order Quantity (EOQ)
Example: Given the following for a company:
U= Annual sale= 20,000 Units
F= fixed cost per order = Birr 2,000
P= Purchase price per unit= Birr 12
C= Carrying cost = 25% of inventory value
PC
FU
Q
2
=
units
x
x
x
Q 164
,
5
25
.
0
12
000
,
20
000
,
2
2
=
=
ii) Order Level
Economic Order Quantity (EOQ)
◼If the usage rate of materials and lead
time for procurement are known with
certainty then;
The ordering level = Lead time in
days for procurement X Average daily
usage
End of Chapter 3
End of Chapter 2
End of Chapter 1
150

Construction financial management

  • 1.
    Debre Birhan university Instituteof technology Department of Construction Technology and Management Financial Management in Construction By: Yibeltal Alamirew (MSc. PE) 0
  • 2.
    CHAPTER 1: Introduction AnOverview of Financial Management ❑Capital Requirement of a Firm ❑Fields of Finance ❑Forms of business organization ❑Goals of Financial Management ❑Functions of Financial Management ❑Organization of Finance Functions 1
  • 3.
    ❑ FM isthe planning for, acquiring and Utilizing of funds in order to maximize the efficiency and value of the firm. ❑ It involves ⚫Forecasting & Planning ⚫Major investment and financing decisions ⚫Coordination and Control ⚫Risk Management What is Financial Management all about? 2
  • 4.
    ❑ No matterwhat the nature the proposed business is and how it is organized, one has to address the following questions. ➢ What capital investment should be made? That is what kind of material and equipment should be purchased, or building to be rented, etc. ➢ How and where the money to pay for the proposed capital investment will be raised? ➢ How the day-to-day financial activities are handled like collecting the receivables and paying the suppliers? Cont’d 3
  • 5.
    It has nowbroaden to deal with issues like: ➢ Which new proposals for employing capital should be accepted by the firm? ➢ What steps can be taken to increase the value of the firm’s common stock? ➢ How much working capital will be needed to support and expand the company’s operation? ➢ Where should the firm go to raise the short and long-term capital demand and how much will it cost? ➢ Should a firm declare a cash dividend on its common stock and if so, how much a dividend should be declared? Cont’d 4
  • 6.
    Cont’d ❑ The termfinance can be defined as the management of the flows of money or its equivalent through an organization, whether it is a for or not-for profit firms, corporation or non- corporate business, or government agency. ❑ Finance concerns itself with the actual flow of money as well as any claims against money. The flow of fund is a continuous process 5
  • 7.
    Dividends Outside Investment Investment Loan PaymentLoan Payment for Material Purchase of Assets Sale of Assets Payment of Expenses Collections Net Credit Sales Net Cash Sales Stockholders’ (Equity) Other Corporations, Businesses and Agencies Creditors (Debt) CASH Raw Materials Fixed Assets Personal Expenses Wages, Benefits & Operating Exp. Accounts Receivables Work in Process Product Inventories Labor Expense Sales Expense Depreciation Cash Flow in a Firm 6
  • 8.
    Cash flow ofcontractors towards project participants Contractor Financial Institutions Sub Contractor Supplier’s Credit Head office finance (Own reserve) Project owner - Payments Construction Plant Products Sales Equipment and Form & False Works Rent
  • 9.
    ➢ Financial demandfor Tendering ➢ Financial demand for Contracting ➢ Financial demand for Inputs (Resources) ➢ Financial demand for Supervision ➢ Financial demand for Payment Processing Major financial demand required for Construction works include:
  • 10.
    ❑ The projectfinance problem is to obtain funds to bridge the time between making expenditures and obtaining revenues. The Financing Problem Sources of Finance to Contractors ❑ Internal ❖ Cash flow from operations ❖ Sale of assets ❑ External ❖ owners (equity) ❖ creditors (debt)
  • 11.
    ❑ Debt Security ➢It arises when a firm borrows money from creditors. The firm incurs liability to repay the amount of money borrowed in some future maturity date ❑ Equity Securities ➢ It represents ownership claim in the firm. People who purchase equity securities are entitled to rights and conditions that are different from those of firm’s creditors Debt vs. Equity Financial Securities 10
  • 12.
  • 13.
    Fields of finance Fund ownedby Fund collected through Use of fund Public Finance Federal, State and Local Government Revenue from taxes and levies, Loan , Grant etc To accomplish Social and Economic objectives. Perform non-profit oriented corporations. Finance Securities Individuals, Institutional investors Purchase and sale of stocks and bonds. Means of raising finance for institutional investors. Means of achieving profit for individuals. International Finance Individuals, businesses and governments involved in international transactions Through International transactions Means of collecting foreign currency. Institutional Finance Banks, Insurance companies, and pension funds and credit unions. Individual savers Finance function of the economy through capital formation. 2. Fields of Finance
  • 14.
    ❑Sole proprietorship ❑Partnership I. GeneralPartnership II. Limited Partnership ❑Corporation I. Subsidiary II. Affiliate III. Division ❑Joint Venture Alternative Forms of Business Organization 13
  • 15.
    ❑ Advantages: ➢ Easeof formation ➢ Subject to few regulations ➢ No corporate income taxes ❑ Disadvantages: ➢ Limited life ➢ Unlimited liability ➢ Difficult to raise capital Sole Proprietorship ❑ A general partnership has roughly the same advantages and disadvantages as a sole proprietorship. 14
  • 16.
    ❑ Advantages: ➢ Unlimitedlife ➢ Easy transfer of ownership ➢ Limited liability ➢ Ease of raising capital ❑ Disadvantages: ➢ Double taxation ➢ Cost of set-up and report filing Double Taxation of Corporate Profits/Income Assume Corporate and Individual Tax = 50% Earnings Before Taxes $100 EBT ($50) Corporate Tax Net Income After Tax $50 NIAT (Profits) Assume 100% Div. Payout $50 Dividend income ($25) Personal Income $25 After-tax Income Corporation 15
  • 17.
    ❑ A jointventure is a partnership agreement in which two or more individual- or group-run businesses join together to carry out a single business project sharing the initial investment & risks. In the Ethiopian Code: “A joint venture is an agreement between partners on terms mutually agreed and is a subject to the general principles of law relating to the partnerships.” Joint Venture 16
  • 18.
    ❑Profit Maximization: ➢ Itis vague ➢ It leaves consideration of timing and duration undefined ➢ It overlooks future aspects ❑ Wealth Maximization: ➢ Avoid high level of risk ➢ Pay consistent dividend ➢ Seek growth in Sales ➢ Maintain market Price of Stocks Goals of Financial Management 17
  • 19.
    ❑Liquidity functions ❖ ForecastingCash flow ❖ Raising Funds ❖ Managing the flow internal funds ❑Profitability functions ❖ Cost Control ❖ Pricing ❖ Forecasting profits ❖ Profit-risk analysis ❑Managing assets Functions of Financial Management 18
  • 20.
    ❑Most firms designatethree major financial positions ▪ Chief Financial Officer (CFO) ▪ Treasurer ➢ Managing cash flows ➢ Forecasting financial need ➢ Relations with FI ▪ Controller ➢ Financial accounting, internal auditing, taxation, payroll functions Organization of Finance Function 19
  • 21.
  • 22.
    ❑ Short-term financing ❑Medium-term financing ❑ Long-term financing CHAPTER 2: Financing Decisions Short, medium, and long term financing
  • 23.
    ❑ Short-term financingusually includes loans that mature within a year or less. ❑ Short-term finance ➢Used to raise temporary funds to cover seasonal or cyclic business peak or special funding needs involving a short time frame. ➢Are self-liquidating. ❑ Goals of short-term financing: ➢ Finance inventories during a production/ construction period. Short-term financing allows the firm to match its funds against its needs over an annual, seasonal or other cyclical period. ➢ To achieve low-cost financing. The interest-free sources provide low-cost financing for the firm by reducing its borrowing need from interest-bearing sources 1. Short Term Financing
  • 24.
    Source of Short-termfinancing I. Unsecured Interest-Free Sources ➢ Accounts Payable ➢ Accruals ➢ Advance Payments ➢ Advance for purchase of materials/ material on site II. Unsecured Interest-bearing Sources ❑ Self-Liquidating Bank Loans ➢ Single payment note ➢ Unsecured overdraft facility/ Line of Credit ➢ Revolving credit agreement ❑ Non Bank Short-term sources ➢ Commercial Paper/ Bond (Treasury bond) ➢ Private Loans
  • 25.
    Source of Short-termfinancing (cont’d) III. Secured Short-term Sources ❑ A secured loan occurs when the borrower pledges a specific asset, collateral, to back a loan. ❑ Collateral may be in the form of: ➢ Warehouse receipt loan ➢ Receivables ✓ Pledging of accounts receivable ✓ Factoring receivables
  • 26.
    ❑ Intermediate-term financingusually includes loans with maturity greater than 1 year & less than 5 to 7 years. ❑ Intermediate-term finance categories ➢ Revolving Credit Agreement ➢ Term Loan ➢ Lease ❑ Intermediate-term financing institutions ➢ Commercial Bank Loans ➢ Insurance Companies ➢ Pension Funds ➢ Equipment Manufacturers 2. Intermediate-Term Financing
  • 27.
    ❑ Long-term financingusually refers to the borrowing of money for a long period of time in order to invest in fixed assets relatively permanent in nature with long life. ❑ The Two Common sources I. Debt: Sources can be classified into two ➢ Term loans ➢ Bonds II. Equity: Ownership money acquired through the sale of common stocks, preferred stock and retained earnings. 3. Long-Term Financing
  • 28.
    ❑ Debt investorsare entitled to a contractual set of cash flows (interest and principal) whereas equity investors have a claim of residual cash flows of the firm after it has satisfied all other claims and liabilities ❑ Interest paid to debt investors represents a tax-deductible expense whereas dividend paid to equity investors has to come out of profit after tax. ❑ Debt has a fixed maturity whereas equity ordinarily has infinite life. ❑ Equity investors enjoy the prerogative to control the affairs of the firm whereas debt investors play a passive role. However, they often impose certain restrictions on the way the firm is run to protect their interests. Equity vs. Debt
  • 29.
    1. Common Stock ❑Represents ownership capital as equity shareholders collectively own the company. ➢ Bear risks of ownership ➢ Liable only to the amount of capital ❑ Rights and Position of Equity shareholders ➢ Right to income ➢ Right to control ➢ Pre-emptive right ➢ Right to Liquidation Equity Capital
  • 30.
    2. Preferred Stock ❑Represents hybrid form of financing. ❑ Resembles Equity in the following ways ➢ Dividend is payable only out of distributable profits ➢ Preference dividend is not an obligatory payment ➢ Preference dividend is not a tax-deductible payment ➢ It is an expensive source of financing ❑ Resembles Debt in the following ways ➢ No right to vote ➢ Claims come before common stock Equity Capital (Cont’d)
  • 31.
    3. Retained Earnings ❑Represents the only internal source of financing for expansion and growth ❑ Advantages to the firm: ➢ Retained earnings are readily available: Low cost ➢ No dilution of control when the firm relies on retained earnings ❑ Disadvantages to the firm: ➢ Limited ➢ High opportunity cost Equity Capital (Cont’d)
  • 32.
    1. Term Loans ❑Represents a source of finance which is generally payable in 5 to 10 years. ❑ Used for acquisition of fixed assets and working capital margin ❑ Advantages: ➢ No dilution of control, debt owners do not interfere with the firm ➢ Defaulting in case of decline goes to the debtors ➢ Issue costs of debt are significantly lower than those on equity and preferred stock Disadvantages: • Debt financing entails fixed interest and principal repayment obligation Long-term Debt
  • 33.
    2. Bonds ❑ Issuea bond with the promise of paying the investor (Bond holding firm) a designated interest on his money at certain scheduled intervals of time ❑ Term Bonds ❑ Serial Bonds ❑ Mortgage Bonds ❑ Debenture ❑ Callable bonds Long-term Debt (Cont’d)
  • 34.
    Collects and processes financialinformation Reports information to decision makers Managers (internal) Investors and Creditors (external) Chapter 3 Firms Financial Operations ❑ The Accounting System
  • 35.
    The Accounting System AccountingSystem Financial Accounting System Periodic financial statements and related disclosures Managerial Accounting System Detailed plans and continuous performance reports External Decision Makers Investors, creditors, suppliers, customers, etc. Internal Decision Makers Managers throughout the organization
  • 36.
    1. The BasicFinancial Statements Income Statement Balance Sheet Statement of Cash Flows Statement of Retained Earnings ❑ Financial statements summarize the financial activities of the business. ❑ Financial statements paint a picture of the transactions that flow through the business.
  • 37.
    The System ASSETS • Current (Short-term) •Fixed (long-term) • Other LIABILITIES • Current • Long-term) Shareholder’s EQUITY Debt Stock Sell Equity Issue Debt <Buy Assets> <Buy Inventory> Make Sales! <Pay Costs> <Pay Taxes> Cash Flow Balance Sheet Capital Supplied 3 4 Retain profits or “repay” debt-holders (with interest) and stockholders (with dividends) Reta in Retu rn 2 1 <Pay Interest> <Pay Dividends>
  • 38.
    ❑ To informthe following parties of the financial performance and position of the entity: 1)Management – for reviewing their performance during the reporting period 2)Shareholders – for assessing the worth of their investments and reviewing the effectiveness of the Management 3)Investors – for judging the worth of the entity before deciding to invest 4)Suppliers and Lenders – for judging the creditworthiness of the entity before deciding to extend credit 5)Government – for calculating the amount of tax to be collected Purpose of Financial Statements
  • 39.
  • 40.
    Assets ❑ Current assets: ➢Cash & securities ➢ Receivables ➢ Inventories ❑ Fixed assets: ➢ Tangible assets ➢ Intangible assets Liabilities and Equity ❑ Current liabilities: ➢ Payables ➢ Short-term debt ❑ Long-term liabilities ❑ Shareholders' equity 1) Balance Sheet Owns Owes
  • 41.
    Addis-Matador CORP. Balance Sheet AtDecember 31, 2006 (in thousands of dollars) Assets Cash 4,895 $ Accounts receivable 5,714 Inventories 8,517 Plant and equipment 7,154 Land 981 Total assets 27,261 $ Liabilities and Stockholders' Equity Liabilities Accounts payable 7,156 $ Notes payable 9,000 Total liabilities 16,156 $ Stockholders' Equity Contributed capital 2,000 $ Retained earnings 9,105 Total stockholders' equity 11,105 Total liabilities and stockholders' equity 27,261 $ 1. Name of entity 2. Title of statement 3. Specific date 4. Unit of measure The Balance Sheet reports the financial position of an entity at a particular point in time.
  • 42.
    The Balance Sheet BasicAccounting Equation Assets = Liabilities + Stockholders’ Equity
  • 43.
    Addis-Matador CORP. Balance Sheet AtDecember 31, 2006 (in thousands of dollars) Assets Cash 4,895 $ Accounts receivable 5,714 Inventories 8,517 Plant and equipment 7,154 Land 981 Total assets 27,261 $ Liabilities and Stockholders' Equity Liabilities Accounts payable 7,156 $ Notes payable 9,000 Total liabilities 16,156 $ Stockholders' Equity Contributed capital 2,000 $ Retained earnings 9,105 Total stockholders' equity 11,105 Total liabilities and stockholders' equity 27,261 $ Assets are listed by their ease of conversion into cash. Cash Amount of cash in the company’s bank accounts. Accounts receivable Amounts owed by customers from prior sales. Inventories Parts and completed but unsold products. Plant and equipment Factories and production machinery. Land Land on which factories are built. Assets are economic resources owned by the business as a result of past transactions.
  • 44.
    Addis-Matador CORP. Balance Sheet AtDecember 31, 2006 (in thousands of dollars) Assets Cash 4,895 $ Accounts receivable 5,714 Inventories 8,517 Plant and equipment 7,154 Land 981 Total assets 27,261 $ Liabilities and Stockholders' Equity Liabilities Accounts payable 7,156 $ Notes payable 9,000 Total liabilities 16,156 $ Stockholders' Equity Contributed capital 2,000 $ Retained earnings 9,105 Total stockholders' equity 11,105 Total liabilities and stockholders' equity 27,261 $ Liabilities are debts or obligations of the business that result from past transactions. Accounts payable Amounts owed to suppliers for prior purchases. Notes payable Amounts owed on written debt contracts.
  • 45.
    Addis-Matador CORP. Balance Sheet AtDecember 31, 2006 (in thousands of dollars) Assets Cash 4,895 $ Accounts receivable 5,714 Inventories 8,517 Plant and equipment 7,154 Land 981 Total assets 27,261 $ Liabilities and Stockholders' Equity Liabilities Accounts payable 7,156 $ Notes payable 9,000 Total liabilities 16,156 $ Stockholders' Equity Contributed capital 2,000 $ Retained earnings 9,105 Total stockholders' equity 11,105 Total liabilities and stockholders' equity 27,261 $ Contributed capital Amounts invested in the business by stockholders. Retained earnings Past earnings not distributed to stockholders. Equity is the amount of financing provided by owners of the business and earnings.
  • 46.
    Addis-Matador CORP. Balance Sheet AtDecember 31, 2006 (in thousands of dollars) Assets Cash 4,895 $ Accounts receivable 5,714 Inventories 8,517 Plant and equipment 7,154 Land 981 Total assets 27,261 $ Liabilities and Stockholders' Equity Liabilities Accounts payable 7,156 $ Notes payable 9,000 Total liabilities 16,156 $ Stockholders' Equity Contributed capital 2,000 $ Retained earnings 9,105 Total stockholders' equity 11,105 Total liabilities and stockholders' equity 27,261 $ Use $ on the first item in a group and on the group total. Assets = Liabilities + Stockholders’ Equity
  • 47.
    Addis-Matador CORP. Income Statement Forthe Year Ended December 31, 2006 (in thousands of dollars) Revenues Sales revenue 37,436 $ Expenses Cost of goods sold 26,980 $ Selling, general and administrative 3,624 Research and development 1,982 Interest expense 450 Total expenses 33,036 Pretax income 4,400 $ Income tax expense 1,100 Net income 3,300 $ 1. Name of entity 2. Title of statement 3. Specific date (Unlike the balance sheet, this statement covers a specified period of time.) 4. Unit of measure
  • 48.
    Addis-Matador CORP. Income Statement Forthe Year Ended December 31, 2006 (in thousands of dollars) Revenues Sales revenue 37,436 $ Expenses Cost of goods sold 26,980 $ Selling, general and administrative 3,624 Research and development 1,982 Interest expense 450 Total expenses 33,036 Pretax income 4,400 $ Income tax expense 1,100 Net income 3,300 $ The Income Statement reports the revenues less expenses of the accounting period.
  • 49.
    Addis-Matador CORP. Income Statement Forthe Year Ended December 31, 2006 (in thousands of dollars) Revenues Sales revenue 37,436 $ Expenses Cost of goods sold 26,980 $ Selling, general and administrative 3,624 Research and development 1,982 Interest expense 450 Total expenses 33,036 Pretax income 4,400 $ Income tax expense 1,100 Net income 3,300 $ Revenues are earnings from the sale of goods or services to customers. Revenue is recognized in the period in which goods and services are sold, not necessarily the period in which cash is received.
  • 50.
    Revenues June 2006 Cash fromsale collected on June 10th. X May 2006 $1,000 sale made on May 25th. X When will the revenue from this transaction be recognized? Earnings from the sale of goods or services.
  • 51.
    Revenue May 2006 $1,000 revenue recognizedin May June 2006 When will the revenue from this transaction be recognized? Earnings from the sale of goods or services.
  • 52.
    Addis-Matador CORP. Income Statement Forthe Year Ended December 31, 2006 (in thousands of dollars) Revenues Sales revenue 37,436 $ Expenses Cost of goods sold 26,980 $ Selling, general and administrative 3,624 Research and development 1,982 Interest expense 450 Total expenses 33,036 Pretax income 4,400 $ Income tax expense 1,100 Net income 3,300 $ Expenses are the dollar amount of resources used up by the entity to earn revenues during a period. An expense is recognized in the period in which goods and services are used, not necessarily the period in which cash is paid.
  • 53.
    Addis-Matador CORP. Income Statement Forthe Year Ended December 31, 2006 (in thousands of dollars) Revenues Sales revenue 37,436 $ Expenses Cost of goods sold 26,980 $ Selling, general and administrative 3,624 Research and development 1,982 Interest expense 450 Total expenses 33,036 Pretax income 4,400 $ Income tax expense 1,100 Net income 3,300 $ Cost of goods sold The cost to produce products sold this period. Production costs: direct costs Selling, general and administrative Operating expenses not directly related to production. Research and development Expenses incurred to develop new products. Interest expense The cost of using borrowed funds. Income tax expense Income taxes on current period’s pretax income.
  • 54.
    Expenses May 2006 June2006 May 11 paid $75 cash for newspaper ad. X Ad appears on June 8th. X The dollar amount of resources used up by the entity to earn revenues during a period. When will the expense for this transaction be recognized?
  • 55.
    Expenses May 2006 June2006 Advertising expense recorded in June. The dollar amount of resources used up by the entity to earn revenues during a period. When will the expense for this transaction be recognized?
  • 56.
    Addis-Matador CORP. Income Statement Forthe Year Ended December 31, 2006 (in thousands of dollars) Revenues Sales revenue 37,436 $ Expenses Cost of goods sold 26,980 $ Selling, general and administrative 3,624 Research and development 1,982 Interest expense 450 Total expenses 33,036 Pretax income 4,400 $ Income tax expense 1,100 Net income 3,300 $ If expenses exceed revenues, we report net loss.
  • 57.
    Addis-Matador CORP. Statement ofRetained Earnings For the Year Ended December 31, 2006 (in thousands of dollars) Retained earnings, January 1, 2006 6,805 $ Net income for 2003 3,300 Dividends for 2003 (1,000) Retained earnings, December 31, 2006 9,105 $ 1. Name of entity 2. Title of statement 3. Specific date (Like the income statement, this statement covers a specified period of time.) 4. Unit of measure
  • 58.
    Addis-Matador CORP. Statement ofRetained Earnings For the Year Ended December 31, 2006 (in thousands of dollars) Retained earnings, January 1, 2006 6,805 $ Net income for 2006 3,300 Dividends for 2006 (1,000) Retained earnings, December 31, 2006 9,105 $ The Statement of Retained Earnings reports the way that net income and the distribution of dividends affect the financial position of the company during a period.
  • 59.
    Statement of CashFlows Because revenues reported do not always equal cash collected. . . . . . and expenses reported do not always equal cash paid . . . net income is usually not equal to the change in cash for the period.
  • 60.
    Addis-Matador CORP. Statement ofCash Flows For the Year Ended December 31, 2006 (in thousands of dollars) Cash flows from operating activities: Cash collected from customers 33,563 $ Cash paid to suppliers and employees (30,854) Cash paid for interest (450) Cash paid for taxes (1,190) Net cash flow from operating activities 1,069 $ Cash flow from investing activities: Cash paid to purchase equipment (1,625) $ Net cash flow from investing activities (1,625) Cash flow from financing activities: Cash received from bank loan 1,400 $ Cash paid for dividends (1,000) Net cash flow from financing activities 400 Net decrease in cash during the year (156) $ Cash at beginning of the year 5,051 Cash at end of the year 4,895 $ 1. Name of entity 2. Title of statement 3. Specific date (Like the income statement and statement of retained earnings, this statement covers a specified period of time.) 4. Unit of measure
  • 61.
    Addis-Matador CORP. Statement ofCash Flows For the Year Ended December 31, 2006 (in thousands of dollars) Cash flows from operating activities: Cash collected from customers 33,563 $ Cash paid to suppliers and employees (30,854) Cash paid for interest (450) Cash paid for taxes (1,190) Net cash flow from operating activities 1,069 $ Cash flow from investing activities: Cash paid to purchase equipment (1,625) $ Net cash flow from investing activities (1,625) Cash flow from financing activities: Cash received from bank loan 1,400 $ Cash paid for dividends (1,000) Net cash flow from financing activities 400 Net decrease in cash during the year (156) $ Cash at beginning of the year 5,051 Cash at end of the year 4,895 $ The Statement of Cash Flows reports the inflows and outflows of cash during the period in the categories of operating, investing, and financing.
  • 62.
    Sell Equity Issue Debt <BuyAssets> <Buy Inventory> Make Sales! <Pay Costs> <Pay Taxes> “Natural” Cash Flows <Pay Interest> <Pay Dividends> Sell Equity Issue Debt <Pay Dividends> <Buy Assets> Make Sales! <Buy Inventory> <Pay Costs> <Pay Taxes> <Pay Interest> Cash flow statement Classifications Financing Investing Operating =NET CASH FLOW
  • 63.
    Addis-Matador CORP. Statement ofCash Flows For the Year Ended December 31, 2006 (in thousands of dollars) Cash flows from operating activities: Cash collected from customers 33,563 $ Cash paid to suppliers and employees (30,854) Cash paid for interest (450) Cash paid for taxes (1,190) Net cash flow from operating activities 1,069 $ Cash flow from investing activities: Cash paid to purchase equipment (1,625) $ Net cash flow from investing activities (1,625) Cash flow from financing activities: Cash received from bank loan 1,400 $ Cash paid for dividends (1,000) Net cash flow from financing activities 400 Net decrease in cash during the year (156) $ Cash at beginning of the year 5,051 Cash flows directly related to earning income are shown in the operating section.
  • 64.
    Addis-Matador CORP. Statement ofCash Flows For the Year Ended December 31, 2006 (in thousands of dollars) Cash flows from operating activities: Cash collected from customers 33,563 $ Cash paid to suppliers and employees (30,854) Cash paid for interest (450) Cash paid for taxes (1,190) Net cash flow from operating activities 1,069 $ Cash flow from investing activities: Cash paid to purchase equipment (1,625) $ Net cash flow from investing activities (1,625) Cash flow from financing activities: Cash received from bank loan 1,400 $ Cash paid for dividends (1,000) Net cash flow from financing activities 400 Net decrease in cash during the year (156) $ Cash at beginning of the year 5,051 Cash at end of the year 4,895 $ Cash flows related to the acquisition or sale of productive assets are shown in the investing section.
  • 65.
    Addis-Matador CORP. Statement ofCash Flows For the Year Ended December 31, 2006 (in thousands of dollars) Cash flows from operating activities: Cash collected from customers 33,563 $ Cash paid to suppliers and employees (30,854) Cash paid for interest (450) Cash paid for taxes (1,190) Net cash flow from operating activities 1,069 $ Cash flow from investing activities: Cash paid to purchase equipment (1,625) $ Net cash flow from investing activities (1,625) Cash flow from financing activities: Cash received from bank loan 1,400 $ Cash paid for dividends (1,000) Net cash flow from financing activities 400 Net decrease in cash during the year (156) $ Cash at beginning of the year 5,051 Cash at end of the year 4,895 $ Cash flows from or to investors or creditors are shown in the financing section.
  • 66.
    Addis-Matador CORP. Statement ofCash Flows For the Year Ended December 31, 2006 (in thousands of dollars) Cash flows from operating activities: Cash collected from customers 33,563 $ Cash paid to suppliers and employees (30,854) Cash paid for interest (450) Cash paid for taxes (1,190) Net cash flow from operating activities 1,069 $ Cash flow from investing activities: Cash paid to purchase equipment (1,625) $ Net cash flow from investing activities (1,625) Cash flow from financing activities: Cash received from bank loan 1,400 $ Cash paid for dividends (1,000) Net cash flow from financing activities 400 Net decrease in cash during the year (156) $ Cash at beginning of the year 5,051 Cash at end of the year 4,895 $ The statement ends with a reconciliation of Cash.
  • 67.
    Relationship Among theFinancial Statements Addis-Matador CORP. Income Statement For the Year Ended December 31, 2006 (in thousands of dollars) Revenues Sales revenue 37,436 $ Expenses Cost of goods sold 26,980 $ Selling, general and administrative 3,624 Research and development 1,982 Interest expense 450 Total expenses 33,036 Pretax income 4,400 $ Income tax expense 1,100 Net income 3,300 $ Addis-Matador CORP. Statement of Retained Earnings For the Year Ended December 31, 2006 (in thousands of dollars) Retained earnings, January 1, 2006 6,805 $ Net income for 2006 3,300 Dividends for 2006 (1,000) Retained earnings, December 31, 2006 9,105 $ Net income from the income statement increases ending retained earnings on the statement of retained earnings.
  • 68.
    Relationship Among theFinancial Statements Addis-Matador CORP. Statement of Retained Earnings For the Year Ended December 31, 2006 (in thousands of dollars) Retained earnings, January 1, 2003 6,805 $ Net income for 2003 3,300 Dividends for 2003 (1,000) Retained earnings, December 31, 2003 9,105 $ Ending retained earnings from the statement of retained earnings is one of the components of stockholders’ equity on the balance sheet. Addis-Matador CORP. Balance Sheet At December 31, 2006 (in thousands of dollars) Assets Cash 4,895 $ Accounts receivable 5,714 Inventories 8,517 Plant and equipment 7,154 Land 981 Total assets 27,261 $ Liabilities and Stockholders' Equity Liabilities Accounts payable 7,156 $ Notes payable 9,000 Total liabilities 16,156 $ Stockholders' Equity Contributed capital 2,000 $ Retained earnings 9,105 Total stockholders' equity 11,105 Total liabilities and stockholders' equity 27,261 $
  • 69.
    Relationship among theFinancial Statements The change in cash on the statement of cash flows added to the beginning of the year balance in cash equals the ending balance in cash on the balance sheet. Addis-Matador CORP. Balance Sheet At December 31, 2006 (in thousands of dollars) Assets Cash 4,895 $ Accounts receivable 5,714 Inventories 8,517 Plant and equipment 7,154 Land 981 Total assets 27,261 $ Liabilities and Stockholders' Equity Liabilities Accounts payable 7,156 $ Notes payable 9,000 Total liabilities 16,156 $ Stockholders' Equity Contributed capital 2,000 $ Retained earnings 9,105 Total stockholders' equity 11,105 Total liabilities and stockholders' equity 27,261 $ Addis-Matador CORP. Statement of Cash Flows For the Year Ended December 31, 2006 (in thousands of dollars) Cash flows from operating activities: Cash collected from customers 33,563 $ Cash paid to suppliers and employees (30,854) Cash paid for interest (450) Cash paid for taxes (1,190) Net cash flow from operating activities 1,069 $ Cash flow from investing activities: Cash paid to purchase equipment (1,625) $ Net cash flow from investing activities (1,625) Cash flow from financing activities: Cash received from bank loan 1,400 $ Cash paid for dividends (1,000) Net cash flow from financing activities 400 Net decrease in cash during the year (156) $ Cash at beginning of the year 5,051 Cash at end of the year 4,895 $
  • 70.
    2. Financial Analysis ❑Assessment of the firm’s past, present and future financial conditions ❑ Done to find firm’s financial strengths and weaknesses ❑ Primary Tools: ➢ Financial Statements ➢ Comparison of financial ratios to past, industry, sector and all firms. 1. Common Size Financial Statements ❑ Each component of the statement is represented in terms of percentages. ➢ Income statement: Each item is calculated as a percent of net sales ➢ Balance sheet: Each item is calculated as a percent of assets or total liabilities and stockholder’s equity.
  • 71.
    Financial Analysis (Cont’d) 2.Comparative (Common-Base year) Financial Statements ➢ Financial information reported side by side in vertical columns to see relationship and trends between years. ➢ Trend Analysis ➢ Horizontal analysis shows birr and percent changes from year to year. 3. All Financial Statement ratios should be compared to: ❑ Should analyze ratios based upon standards of comparison such as I. Industry ratios and standards II. Similar businesses in the same industry (competition) III. Past performance ratios. IV. Prior years operating results
  • 72.
    Ratio Analysis ❑ Liquidity:Can we make required payments? ❑ Debt management: Right mix of debt and equity? ❑ Asset management: Right amount of assets vs. sales? ❑ Profitability: Do sales prices exceed unit costs, and are sales high enough as reflected in PM, ROE, and ROA?
  • 73.
    a) Liquidity Ratios ❑An asset that can be converted to cash quickly without having to reduce asset’s price very much. ❑ Current Ratio: s liabilitie Current assets Current ratio Current = ❑ Quick or Acid Test Ratio: Is calculated by deducting inventory from current assets as a proportion of current liabilities s liabilitie Current s Inventorie - assets Current ratio Quick =
  • 74.
    b) Leverage Ratios ❑Debt Ratio The ratio of total debts to total assets: measures the percentage of funds provided by creditors Assets Total Debt Total Ratio Debt = ❑ Times-Interest-Earned (TIE) Ratio The ratio of earnings before interest and taxes (EBIT) to interest charges; a measure of the firm’s ability to meet its annual interest payments. charges Interest EBIT ratio coverage Interest =
  • 75.
    c) Profitability Ratios ❑A group of ratios that show the combined effects of liquidity, asset management, and debt on operating results. ❑ Gross profit margin This ratio shows the margin left after meeting production costs. It measures the efficiency of production and pricing. Income profit Gross margin profit Gross = ❑ Return on Capital Employed A measure of how efficiently the capital is employed. A key indicator of profitability of a firm. Firms that are efficiently using their assets have a relatively high return. Less efficient firms have a lower return. Assets Current profit Net employed capital on Return =
  • 76.
    Profitability Ratios (cont’d) ❑Return on Equity Profit indicator to shareholders. The ratio indicates the degree to which the firm is able to convert equity to generate net profit that eventually can be claimed by shareholders equity Total profit Net equity on Return = d) Asset Management Ratios (Turnover) ❑ The asset management ratios measures how effectively the firm is managing its assets ❑ Inventory turnover ratio This ratio is calculated by dividing sales by inventories s Inventorie Sales ratio turnover Inventory =
  • 77.
    Asset Management Ratios(Cont’d) Assets Total Sales ratio over Asset turn Total = ❑ Total Asset turnover ratio Measures how efficiently assets are employed ❑ Fixed Asset turnover ratio Measures how efficiently fixed assets are employed assets fixed Net Sales ratio over Asset turn Fixe =
  • 78.
    Investment Decisions Chapter 4 ChapterSummary 1. Discuss the time value of money and standard calculations showing the relationship b/n PV and FV. 2. Discuss different methodologies of economic analysis for investment appraisal. 3. Discuss how to budget capital on contract investment and how to establish ROCE and Mark-up in corporate budget planning. 4. Identify the different systems of control levels to monitor capital allocated for investment.
  • 79.
    Introduction ❑ Investment isdecision making process by which firms evaluate the purchase of fixed assets ❑ Investment policy is the firm’s formal planning process ❑ Significance of investment: ➢ substantial expenditure ➢ long time period ➢ sales forecasts ➢ investment appraisal ➢ planning horizon
  • 80.
    ❑ Investor preferto receive payment of a fixed amount of money today, rather than an equal amount in the future. Why? ➢ People prefer current consumption to future ➢ To account for opportunity cost (to the least the interest payment) 4.1. The time value of money CF0 CF1 CF3 CF2 0 1 2 3 I% ❖ Show the timing of cash flows. ❖ Tick marks occur at the end of periods, so Time 0 is today; Time 1 is the end of the first period (year, month, etc.) or the beginning of the second period.
  • 81.
    4.1. The timevalue of money (cont.…) General Assumption: ❑ Cash Flows (CFs) occur at the END of the period, unless stated otherwise. ❑ Payments (PMTs) occur at the END of the period (ordinary annuity), unless stated otherwise. CFs can either be: I. Lump Sum (Birr1000 to be received in 1 year or 5 years, or Birr1000 invested today), or II. Recurring CFs (non-constant CFs), e.g. B100 in YR1, B200 in YR 2, B300 in YR3) or III. PMTs (constant CFs, e.g. B100 per year for 3 years).
  • 82.
    ❑ Financial investmentsinvolve cash flows occurring at different points in the time series. ❑ Cash flows have to be brought to the same point 1. Present and future value of a single amount A. Simple interest: no interest is earned on the interest. ❑ Interest is accounted only for the principal 4.1. The time value of money (cont.…) FVn= PV (1+nr) Where, PV= is the value at time=0 FV= is the value at time=n r=is the rate at which the amount will be compounded each period n= is the number of periods
  • 83.
    B. Compound interest:interest payment is reinvested. FV = PV (1+r)n Where, PV= is the value at time=0 FV= is the value at time=n r=is the rate at which the amount will be compounded each period n= is the number of periods 4.1. The time value of money (cont.…)
  • 84.
    Relationship b/n PVand FV PV Simple Interest Comp. Interest Period FV 4.1. The time value of money (cont.…)
  • 85.
    2. Present Valueof uneven series • Present value of uneven cash flow stream r = discount rate CF0 A1 A3 A2 0 1 2 3 I% (1+r)1 An PVn = A1 + (1+r)1 A2 + (1+r)2 ….+ (1+r)n 4.1. The time value of money (cont.…)
  • 86.
    3. Present Valueof Annuity ❑ Constant cash flow at regular interval of time. CF0 A A A 0 1 2 3 I% 1 r (1 - ) PVn = A( ) 1 (1+r)n 4. Future Value of Annuity FVn = A( ) (1+r)n - 1 r 4.1. The time value of money (cont.…)
  • 87.
    4.2 Investment Appraisal ❑Investmentproposals are evaluated from different dimensions: ➢ Economic evaluation ➢ Social benefit ➢ Environmental impact ➢ Consistent with local and nation development plan ➢ Others…. ❑Topic focus: Economic evaluation for investment appraisal
  • 88.
    ❑ Important investmentevaluation methods: 1. payback period 2. Net Present Value (NPV) 3. Internal Rate of Return (IRR) 4. Cost-Benefit Analysis 5. Cost-effective Analysis 6. Multi-criteria Analysis 7. Liner programming 8. Dynamic Programming 4.2 Investment Appraisal (cont…)
  • 89.
    ❑ Payback periodis the expected number of years required to recover the original investment. ❑ It measures risk, not return. ❑ The shorter the payback period, the more desirable will be the project ❑ First the maximum acceptable payback period (nmax) is specified against which the calculated payback period (n) is compared. 4.2 Investment Appraisal (cont…)
  • 90.
    ❑ Standard methodfor the financial appraisal of long-term projects ❑ Used for capital budgeting, and widely throughout economics, it measures the excess or shortfall of cash flows, in present value (PV) terms, once financing charges are met. ❑ Indicator of how much value an investment or project adds to the value of the firm. 4.2.2 The Net Present Value (NPV) 4.2 Investment Appraisal (cont…)
  • 91.
    • NPV iscalculated as: 4.2.2 NPV (cont…) NPV = Σ Bt (1 + r)-t - Σ Ct (1 + r)-t Where, Bt = Benefit or return at the end of year t Ct = Cost outlay or investment at the end of year t r = required return (discount rate) t = time of the cash outlay n = total time of the project t=1 n t=1 n 4.2 Investment Appraisal (cont…)
  • 92.
    •In financial theory,if there is a choice between two mutually exclusive alternatives, the one yielding the higher NPV should be selected •The rate used to discount future cash flows to their present values is a key variable of this process •Most firms have a well defined policy regarding their capital structure, so the weighted average cost of capital (after tax) is used as the discount rate •Another method is to use a variable discount rate with higher rates applied to cash flows occurring further along the time span, (reflecting the yield curve premium for long-term debt). 4.2.2 NPV (cont…) 4.2 Investment Appraisal (cont…)
  • 93.
    •It is appropriateto use higher discount rates to adjust for risk for riskier projects •If a project offers a high risk, the reqiured return on the project will also be high. 4.2.2 NPV (cont…) Degree of Risk Expected Return 4.2 Investment Appraisal (cont…)
  • 94.
    • Procedure foranalysis using NPV 1. Find the present value of each cash flow, including both inflows and outflows, discounted at the projects cost of capital 2. Sum this discounted cash flows: NPV 3. Evaluate based on the value of 2 above 4.2.2 NPV (cont…) 0 1 2 3 −100.00 10 60 80 9.09 49.59 60.11 NPV = 18.79 4.2 Investment Appraisal (cont…)
  • 95.
    If… It means...Then... NPV > 0 the investment would add value to the firm The project may be accepted NPV < 0 the investment would subtract value from the firm The project should be rejected NPV = 0 the investment would neither gain nor lose value for the firm We should be indifferent in the decision whether to accept or reject the project. This project adds no monetary value. Decision should be based on other criteria, e.g. strategic positioning or other factors not explicitly included in the calculation. 4.2.2 NPV (cont…) 4.2 Investment Appraisal (cont…)
  • 96.
    •Is the discountrate that equates the present value of the project’s expected cash inflow’s to the present value of the project’s costs. PVinfows = PVinvestment costs IRR is a rate that brings NPV=0 4.2.3 Internal Rate of Return (IRR) 0 1 2 3 −100.00 10 60 80 100.00 NPV = 0 4.2 Investment Appraisal (cont…)
  • 97.
    •The use ofthe IRR always leads to the selection of the same project, •project selection using the NPV method depends on the discount rate chosen, •NPV and IRR could result in different selections Comparing NPV and IRR 4.2 Investment Appraisal (cont…)
  • 98.
    •It is similarto NPV in the way one compares the value added. •Compares the value added per the cost incurred and used to evaluate projects of different sizes. 4.2.4 The Cost Benefit Ratio (CBR)   = − = − + + = n t t n t t r C r B CBR 1 1 1 1 ) 1 ( ) 1 ( 4.2 Investment Appraisal (cont…)
  • 99.
    Cash Flow Forecasting •The most important, but also the most difficult, step in capital budgeting is estimating projects’ cash flows • The investment outlays and the annual net cash inflows after a project goes into operations • Relevant Cash flows The specific cash flows that should be considered in a capital budgeting decisions. Rules: 1. Capital budgeting decisions must be based on cash flows, not accounting income. 2. Only incremental cash flows are relevant. Costs that occur iff we accept the project. 4.2 Investment Appraisal (cont…)
  • 100.
    Cash Flow Forecasting •Annuity • Constant stream of payments • Lease, rent, etc • Random • Construction business for contractors is expected to be increasing • Individual contract amount takes the form of the S- curve The Cash flows typically include the following items: 1. Initial investment outlay 2. Operating cash flows over the project’s life 3. Terminal year cash flows 4.2 Investment Appraisal (cont…)
  • 101.
    Cash flows ofa construction company occur as a result of the contractual and credit arrangements existing on a series of contracts within any trading period. Sources of finance on contracts:  Internal Source - generated from the companies operation - most of they are locked up b/c: → Stage payment → Disagreement  External Sources - from lenders based on interest 4.3 Capital Budgeting on Contract investment
  • 102.
    The two parametersthat affect a construction company’s profitability: 1. The company's ROCE 2. The mark-up on contract costs to achieve the desired ROCE To determine firm’s mark-up target, it is required establish: i) Return on Capital Employed (ROCE) Represents return anticipated by the company in relation with the total capital employed. • Successful measurement of profitability • Starting parameter for budgeting and performance measurement • Determined at the head office level • Collected from cash flow of individual contract through inclusion of Mark-up 4.3.1 Establishing ROCE and Mark up in Corporate Budget Planning
  • 103.
    ROCE is madeto account for the following costs: •The average weighted cost of capital (interest of capital employed) •Profit margin (dividends, capital reserves...) •Corporate obligations such as taxations and deprecation costs. •Contingencies to cover uncertainties (Risks) ii) Annual Turnover on contracts. •This can be obtained from the firm’s short-term plan committed or planned for execution in the current year.
  • 104.
    • One ofthe items in the Mark-up • Costs entitled in administrating the company and providing off-site services • The amount of GOC for individual project is decided by management as part of their policy. • Vary with individual firms, but broadly includes (within a company’s accounts ) - rent on office and yard - fees, salaries and wages for directors and office staff - office equipment, stationary, telephones, cars - office heating and lighting - insurance on office and staff • Estimated as the percentage of expected turnover iii) General overhead costs (off-site administration):
  • 105.
    Steps to reachat company’s Mark- up Step 1. Estimate total capital to be employed for the fiscal year (TCE) - estimated from the Balance Sheet of the Company Assets Liabilities Current Assets Cash……………. Marketable securities …. Account Receivables……. Inventories………….. Other current assets…. Fixed assets Buildings……. Machineries…… Equipments….. Land…………….. Current Liabilities Short term loans……… Account payable………. Accrued income taxes……. Current payments due on Long-term dept….. Other current liabilities….
  • 106.
    Step 2. DetermineROCE as the percentage of the TCE. - Average weighted cost of capital (interest of capital employed)……***% TCE - Profit Margin (dividends and reserves)……………………………………….***% TCE - Corporate obligations (tax, deprecation)…………………………………….***% TCE - Contingencies to cover uncertainties (risk) ………………………………..***% TCE ROCE…………………………………….Σ***% TCE Step 3. Estimate expected turnover for the fiscal year ۰ This can be obtained - from the firm’s short-term plan committed, or - planned for execution in the current year. Steps to reach at company’s Mark-Up (cont…)
  • 107.
    Step 4. Determinethe General Overhead Cost (GOC) - Estimated as the percentage of the annual turnover - based on the previous year’s turnover GOC…………………***% Turnover Step 5. Determine the Mark-up Mark-up (Head Office) = GOC + ROCE Step 6. Determine the Total Production Cost (TPC) Σ Production Cost = Turnover – Mark-up Step 7. Determine Mark-up individual Project Steps to reach at company’s Mark-Up (cont…) TPC mark-up mark-up at individual project = *100%
  • 108.
    Example The following isthe balance sheet of a G5 contractor. Additional information are also outlined following this. Assets Liabilities Current Assets 550,000 Fixed assets 230,000 . Total Assets: 780,000 Current Liabilities 450,000 Loans 153,234 Preference shares 11,766 Share Capital 32,080 Retained Earnings 132,920 Total L and E 780,000
  • 109.
    Example (cont’d) 1. TotalCapital Employed (TCE from the BS) 2. The following shows return on the capital employed: i. Average weighed cost of capital…………….6.5% ii. Profit margin: ………………………………….....6% iii. Corporate obligations……………………………4.5% iv. Contingences to cover uncertainties ……..3% 3. Planned total turnover The company is planning for a total turnover of Birr2,500,000 in the fiscal year 4. Administrative Expense The previous year’s overhead cost was Birr150,000 while its total turnover was Birr2,000,000.
  • 110.
    1. Estimate thetotal mark-up of the company at the head office and the mark-up on individual contracts. 2. The company is invited to tender for a construction of a school building with a direct cost of Birr2,000,000 and estimated site overhead of 6%. What will be the minimum amount of the contract price that will be offered by the procurement committee?
  • 111.
    4.3.2 The CorporateBudget • is the starting point for setting up a monitoring and reporting system • reference point against which the measurement of financial performance and the achievement of planned objectives are made Corporate Budget (Cash Outlay) = Administrative Cost + ∑ Capital Required by Individual Contracts This has to be balanced with: Capital Budget (Cash Inflow) = Net Working Capital + Finance Sources (Debt, Sales of stocks, Sales of Fixed Assets)
  • 112.
    4.4 A Systemof control levels • There are different control levels in a construction company: 1. Managing Director Level 2. Contracts Management level 3. Site management level
  • 113.
    Control Responsibility Components •ManagingDirector Level ➢ Major Contracts production Costs ➢ Administrative Expenses ➢ Return on Capital Employed •Contract Management Level ➢ Production Costs of Different Contracts •Site Management Level ➢ Direct Cost of projects: Labor Cost Material Cost Plant Cost
  • 114.
    Responsibility level Responsibilities Statement used General Management TurnoverControl Overhead control Account Management Corporate budget (master Budget) Contracts Management Contract Cost Management Contract Budget Statement Operational Budget Statement Control Statement Site Management Activity Cost Control Activity Cost Statement Operational statement
  • 115.
    Monitoring and Controlat Contract Management Level • At this level comparison between the estimated and actual cash flow takes place • Contract Managers produce three basic control statements at Contract Management Level with the help of quantity surveyors. 1. Contract Budget Statement 2. Operational Budget Statement 3. Control Statement
  • 116.
    1. Contract BudgetStatement Operations Labor cost Material cost Equip. Cost Sub- Cont. Total Cost (BCWS) Value Margin Site Overhead Earth Work Concrete Work Exterior Works Roofing TOTAL * ** *** * Production Costs ** Tender Sum *** Contract Markup by the corporate
  • 117.
    2. Operational BudgetStatement • After the contract budget is prepared, operational budget is produced on monthly basis using the contract work Program • Has two primary functions: 1. Provide managers with cost data on monthly basis 2. Enable managers at each level to take decisions or implement corrective actions when necessary
  • 118.
    Operational Budget Statement/sample Operations Total Budget Cost Sep.,2007 Oct., 2007 Cost (BCWP) Value Margin Cost (BCWP) Value Margin Site Overhead Earth Work Concrete Work Exterior Works Roofing BCWS Monthly Total Cum. Total
  • 119.
    3. Control Statements Itis of vital importance that the value of the work carried out is accurately monitored and adequately recorded and presented for agreement and subsequent payment by the client
  • 120.
    Performance Measurement &Evaluation C O S T TIME Current Situation Planned Completion Planned Budget ACWP BCWP BCWS EAC ETC CV SV Forecast Time Overrun Forecast Cost Overrun
  • 121.
  • 122.
    CHAPTER 5 Working CapitalManagement ❑ Working Capital: all the short term assets used in daily operations. ❑ Differ from capital budgeting; ➢ Timing : short term ➢ Swift transformation into other asset
  • 123.
    Definitions ❑ Gross WorkingCapital (WC): Total current assets used in operations. ❑ Net Working Capital: Current assets – Current liabilities. ❑ Working Capital Policy: basic policy decisions as to: 1. the level of each type of current asset, and 2. how current assets will be financed. ❑ Working Capital Management: Controlling cash, inventories, and A/R, plus Short-Term liability management. ❑ Setting the WC policy and carrying out the policy in day- to-day operations
  • 124.
    ABC appears tohave large amounts of working capital given its level of sales. Selected Ratios--ABC plc. ABC Industry Current 1.75x 2.25x Quick 0.83x 1.20x Debt/Assets 58.76% 50.00% Turnover of cash & securities 16.67x 22.22x DSO (days) 45.00 32.00 Inv. turnover 4.82x 7.00x F. A. turnover 11.35x 12.00x T. A. turnover 2.08x 3.00x Profit margin 2.07% 3.50% ROE 10.45% 21.00% 5.1 Working Capital Policy
  • 125.
    How does ABC’sworking capital policy compare with the industry? ❑ Working capital policy is reflected in current ratio, quick ratio, turnover of cash and securities, inventory turnover, and DSO. ❑ These ratios indicate ABC has large amounts of working capital relative to its level of sales. ABC is either very conservative or inefficient. Is ABC inefficient or just conservative? ❑ A conservative (relaxed) policy may be appropriate if it leads to greater profitability. ❑ However, ABC is not as profitable as the average firm in the industry. This suggests the company has excessive working capital.
  • 126.
    5.1.1 Characteristics ofCurrent Assets Finished Goods Accounts Receivable Work in Progress Wages, Salaries, Overheads Raw Materials Suppliers Cash
  • 127.
    5.1.2 Operating Cycleand Cash Cycle ❑ Investments in working capital are influenced by four key events in the production and sales cycle of the firm: ➢ Purchase of raw materials, ➢ Payment for raw materials, ➢ Sale of finished goods ➢ Collection of cash sales
  • 128.
    Operating Cycle andCash Cycle Order Stock arrives Credit Invoice Cash paid for Materials Cash Received Accounts Receivable Inventory Period Accounts Payable Operating Cycle Cash Cycle
  • 129.
    5.1.3 Factors affectingWC Requirements 1. Sales Volume: some level of WC is required to support steady sales. 2. Nature of business: length of operating cycle 3. Market condition: Competition can guide WC policy (credit sales, stock levels) 4. Conditions of Supply: prompt and adequate supply lowers level of inventory and lead time (JIT).
  • 130.
    5.1.4 Cash Requirementfor WC ❑ As a finance manager, one will be interested in figuring out how much cash to arrange to meet the working capital need of the firm. Step 1. Estimation of the cash cost of various current assets required by the firm Step 2. Deduct the current liabilities from the cash cost of current assets
  • 131.
    5.2 Cash andLiquid Management ❑ All money items and sources that are immediately available to help pay a firm’s bills ❑ Treasury bills: unconditional promise by the government’s treasury agent ❑ Commercial Paper: short-term unsecured promissory notes issued by firms ❑ Certificate of Deposit: represents a negotiable receipt of funds deposited in a bank for a fixed period
  • 132.
    5.2.1 How largea cash balance is needed? 1. Transaction needs: A firm needs cash to carry out the day- to-day functions of the business. 2. Contingency needs: For unexpected occurrences or emergencies that require cash. 3. Opportunity needs: The chance to profit from having cash available. 5.2.2 Forecasting Cash Flow ❑ Determining the amounts and timing of future inflows and outlays of cash. Failure of forecast casts risks as: 1. Default: unable to pay interest or principal on borrowings 2. Overdue bills: failure to pay short term obligations (A/P) 3. Lost savings on purchases: loss of discounts on cash purchases
  • 133.
    5.3 Credit Management WhyCredit? 1. Competition: causes firms to sell on credit to attract customers 2. Facilitates Sales: as it augments customers resources Finished Goods On Credit Accounts Receivables Accounts Payable Debtors Creditors
  • 134.
    5.3 Credit Management(cont’d) Accounts Receivable makes a major component of a firms working Capital Needs, Investment in A/R depends on: 1. How much the firm sales on credit, and 2. How long it takes to collect the receivables: 5.3.1 Terms of Payment Order Delivery Converted to cash Sale Cash in Advance Cash on Delivery Cash Terms Credit Terms Terms of payment vary widely in practice.
  • 135.
    5.3.1 Terms ofPayment (Cont’d) Credit Terms can be: i. Open Account: time available between the shipment and invoice ii. Bill of Exchange: a more secure arrangement that represents an unconditional order by the seller asking the buyer to pay on demand or at certain future date, the amount specified on it iii.Consignment: agent relationship between the seller and the buyer iv.Letter of Credit: issued by a bank on behalf of its customer to the seller. ◼ Lower Credit risk & uncertainty, safety to the buyer
  • 136.
    5.3.2 Costs ofMaintaining Receivables As with all assets and operations, the willingness to allow credit sales involve certain costs : i. Financing the Receivables ii. Administrative and collection expenses iii. Bad Debt loss
  • 137.
    5.3.3 Policies forManaging Receivables The firm should establish its receivable policies after carefully considering both the benefits and costs of different policies. I. Profit: Costs (tied up, collection, bad debt, discounts) should be compared with additional sales as a consequence of a proposed policy. Degree of relaxing a policy as determined by residual income: II. Growth in Sales: growth is so important aside from profits, it should be viewed as a separate factor in determining receivable policies. ( ) ( ) ( ) k I r S p S R  −  −  = 
  • 138.
    5.3.4 Credit PolicyVariables The credit policies have a bearing on the level of sales, bad debt loss, discounts taken by customers, and collection expenses. The important dimensions are: i. Credit Standards: What standard should be applied in accepting or rejecting an account for credit granting? Can range from Liberal to stiff credit policy … ii. Credit Period: Has a direct proportionality with sales iii. Cash Discount: Firms generally offer cash discounts to induce customers to make prompt payments. iv. Collection Effort: aimed at timely collection of the R & consists of: • Monitoring the state of receivables, • Dispatch of letters to customers whose due date is approaching, • Electronic and telephonic advice to customers around the due date, • Threat of legal action to overdue accounts, • Legal action against overdue accounts.
  • 139.
    5.4 Inventory Management Defn:Goods held for eventual resale by the firm. Three types of inventories: i. Raw Materials ii. Goods in Process: materials committed to the production process but have not been completed iii. Finished Goods: ready for sale. Final output of the production process. “Merchandise inventory”
  • 140.
    5.4.1 Benefits ofholding inventory Inventories are used to provide cushions so that the purchasing, production, and sales functions can proceed at their own optimum paces. i. Avoiding Losses of Sales: Ability of a firm to give quick service and to provide prompt delivery is closely tied to the proper management of inventory ii. Gaining Quantity Discounts: to make bulk purchases of goods at large discounts. iii. Reducing Order Costs: Forms must be typed, checked, approved and mailed; when goods arrive, they must be accepted, inspected and counted. iv. Achieving Efficient Production Runs: If the firm has to change setups frequently, it would experience high unit costs of production.
  • 141.
    5.4.1 Benefits ofholding inventory (Cont’d) Firms Hold Inventories To Purchasing Producing Selling Avoid Losses of Sales Gain Quantity Discounts Reduce Order Costs Achieve Efficient Production Separate Which Helps
  • 142.
    5.4.2 Costs ofholding inventory The effective management of inventory involves a tradeoff between having too little and also too much inventory. Inventory costs: i. Ordering Costs: requisitioning, preparation of purchase order, expediting, transport and receiving and placing in storage, set-up costs ii. Carrying Costs: interest on capital locked up in inventory, storage and handling costs, insurance, depreciation, and property taxes. iii. Shortage Costs: arise when inventories are short of requirement for meeting the needs of production or the demand of customers. ◼ Loss of sales, loss of customer goodwill, disruption of production schedules.
  • 143.
    5.4.3 Inventory Management– Minimizing Costs • The goal of effective inventory management is to minimize the total costs that are associated with ordering and holding inventories. • Choose the level of inventory with the lowest total cost after estimating the different expenses with varying inventory levels.
  • 144.
    5.4.3 Inventory Management– Minimizing Costs (Cont’d) The two basic questions relating to inventory mgt ◼ Size of the Order: Q optimal ◼ The Level to Order: Q level 10 10 20 30 40 50 60 Units 0 Costs Total Cost Carrying Cost Ordering Cost Optimum Level
  • 145.
    i) Order Quantity EconomicOrder Quantity (EOQ) ◼ The Economic Order Quantity refers to the order size that will result in the lowest total of order and carrying costs for an item of inventory. ◼ Order costs increase as number of orders increase ◼ Carrying costs increase as large stocks are kept Variables in the EOQ model: U: The forecast usage/demand for goods or raw materials for a year is known, Q: Quantity Ordered, F: Cost per Order, C: Percent Carrying Cost P: Price per Unit, TC: Total Costs of ordering and carrying
  • 146.
    i) Order Quantity EconomicOrder Quantity (EOQ) The total cost of ordering and carrying is minimized when the derivative of the above equation is equated to zero: ( ) ( )( ) C P Q F Q U TC 2 + = 0 2 2 = + − = PC Q UF dQ dTC PC UF Q 2 2 = PC FU Q 2 =
  • 147.
    i) Order Quantity EconomicOrder Quantity (EOQ) Example: Given the following for a company: U= Annual sale= 20,000 Units F= fixed cost per order = Birr 2,000 P= Purchase price per unit= Birr 12 C= Carrying cost = 25% of inventory value PC FU Q 2 = units x x x Q 164 , 5 25 . 0 12 000 , 20 000 , 2 2 = =
  • 148.
    ii) Order Level EconomicOrder Quantity (EOQ) ◼If the usage rate of materials and lead time for procurement are known with certainty then; The ordering level = Lead time in days for procurement X Average daily usage
  • 149.
  • 150.
  • 151.