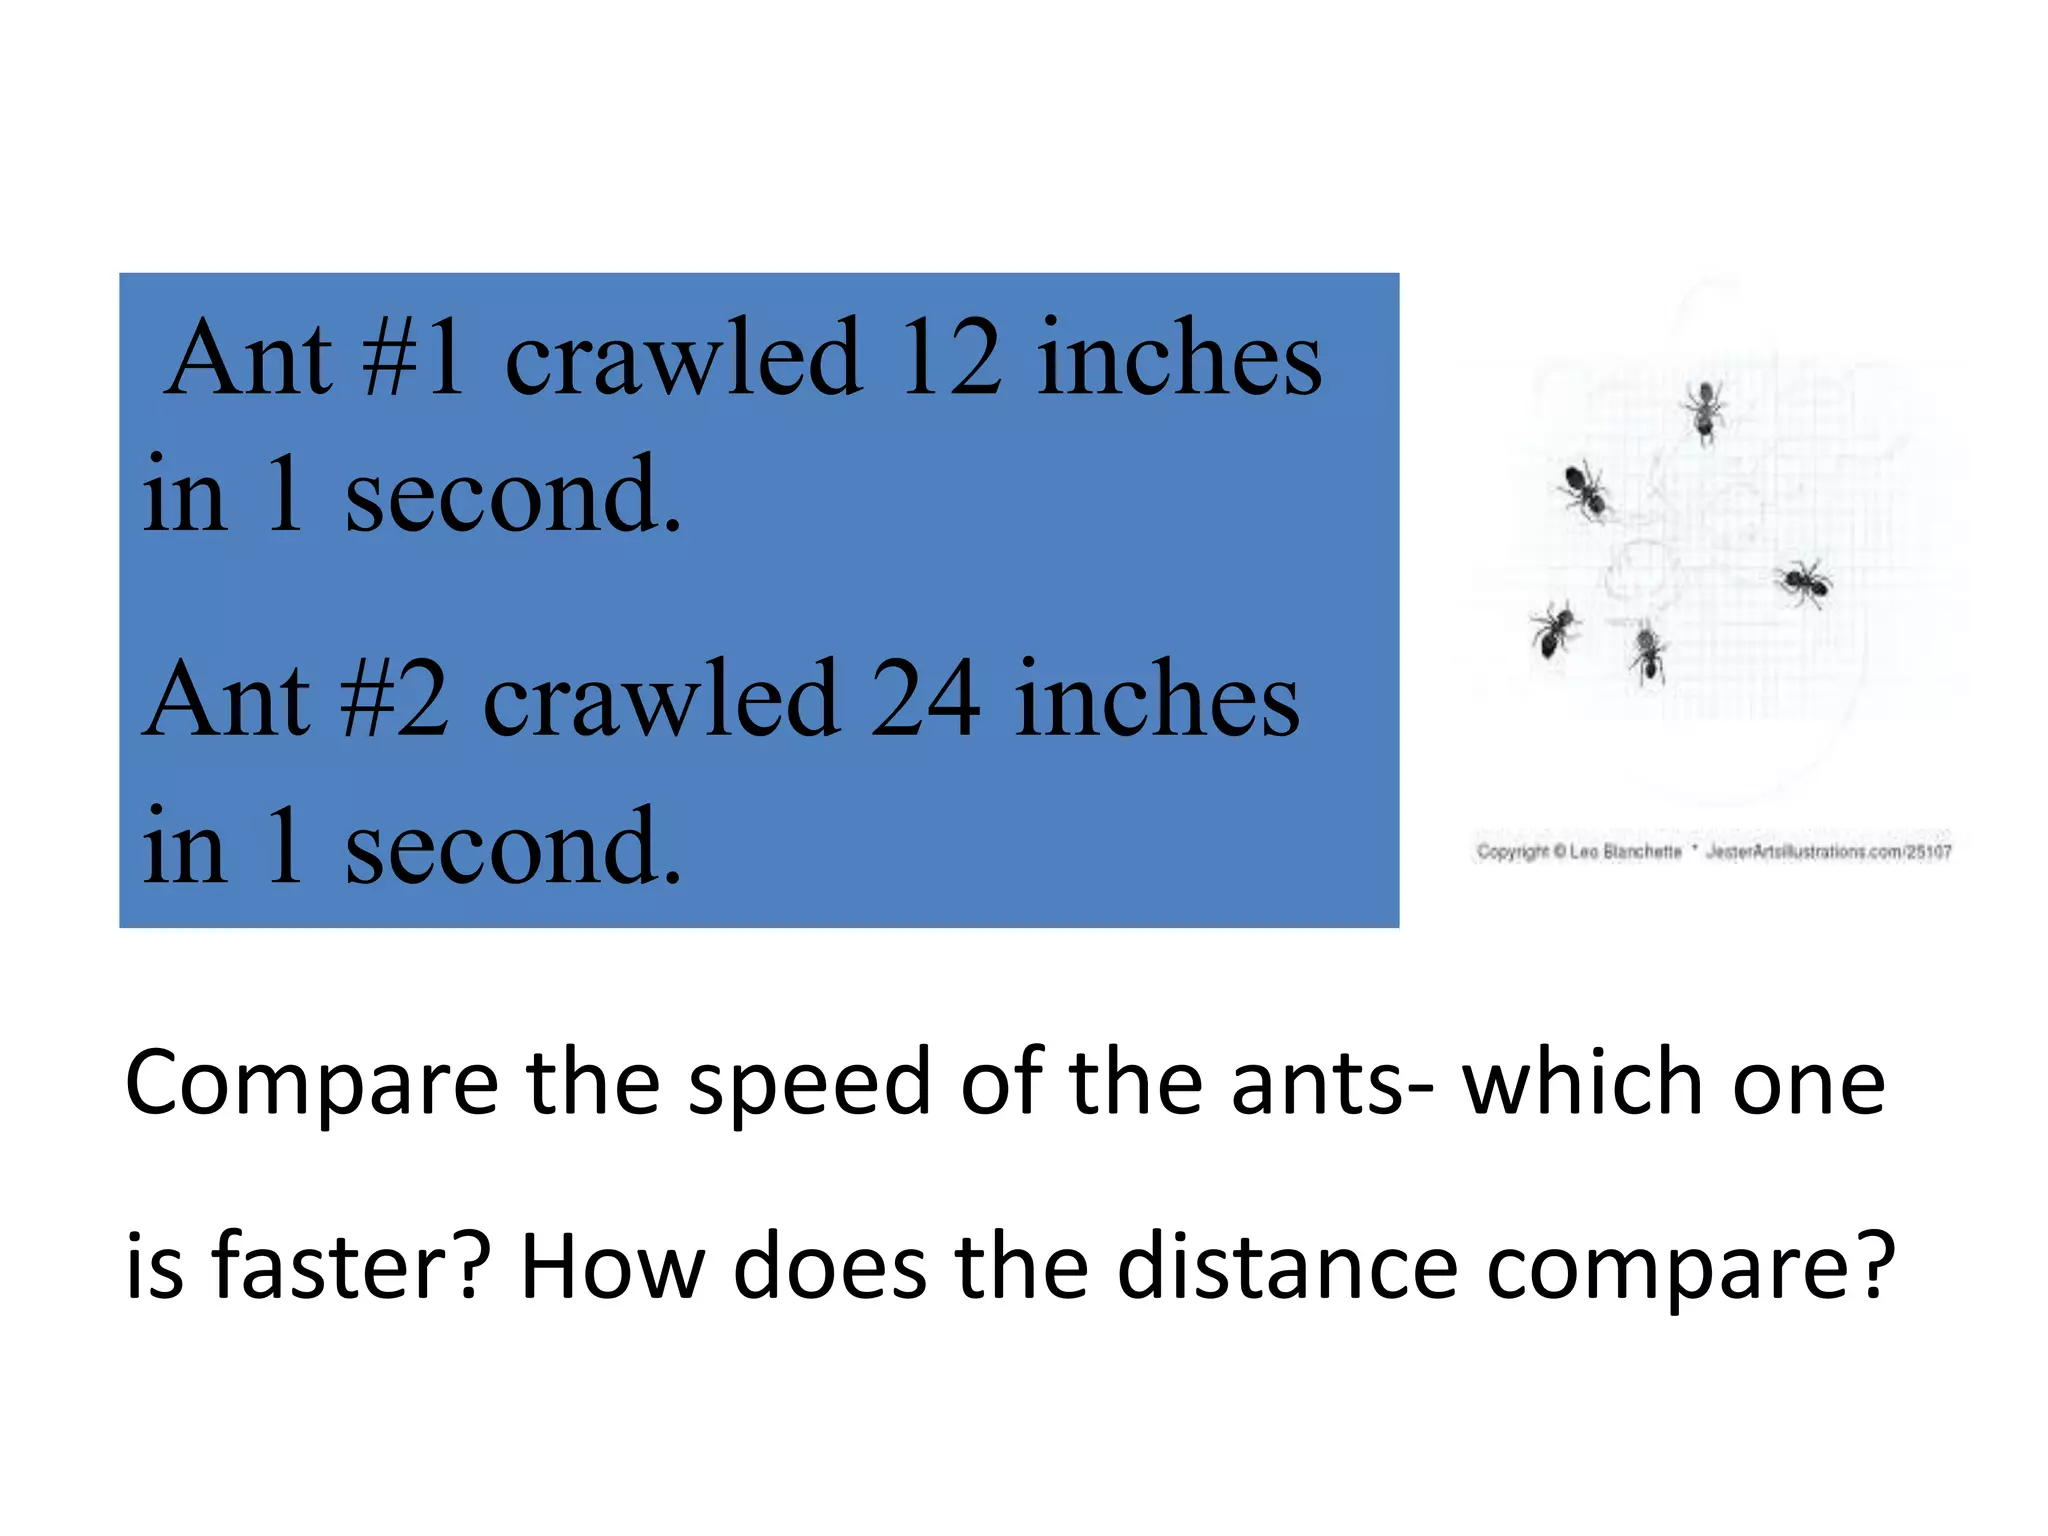
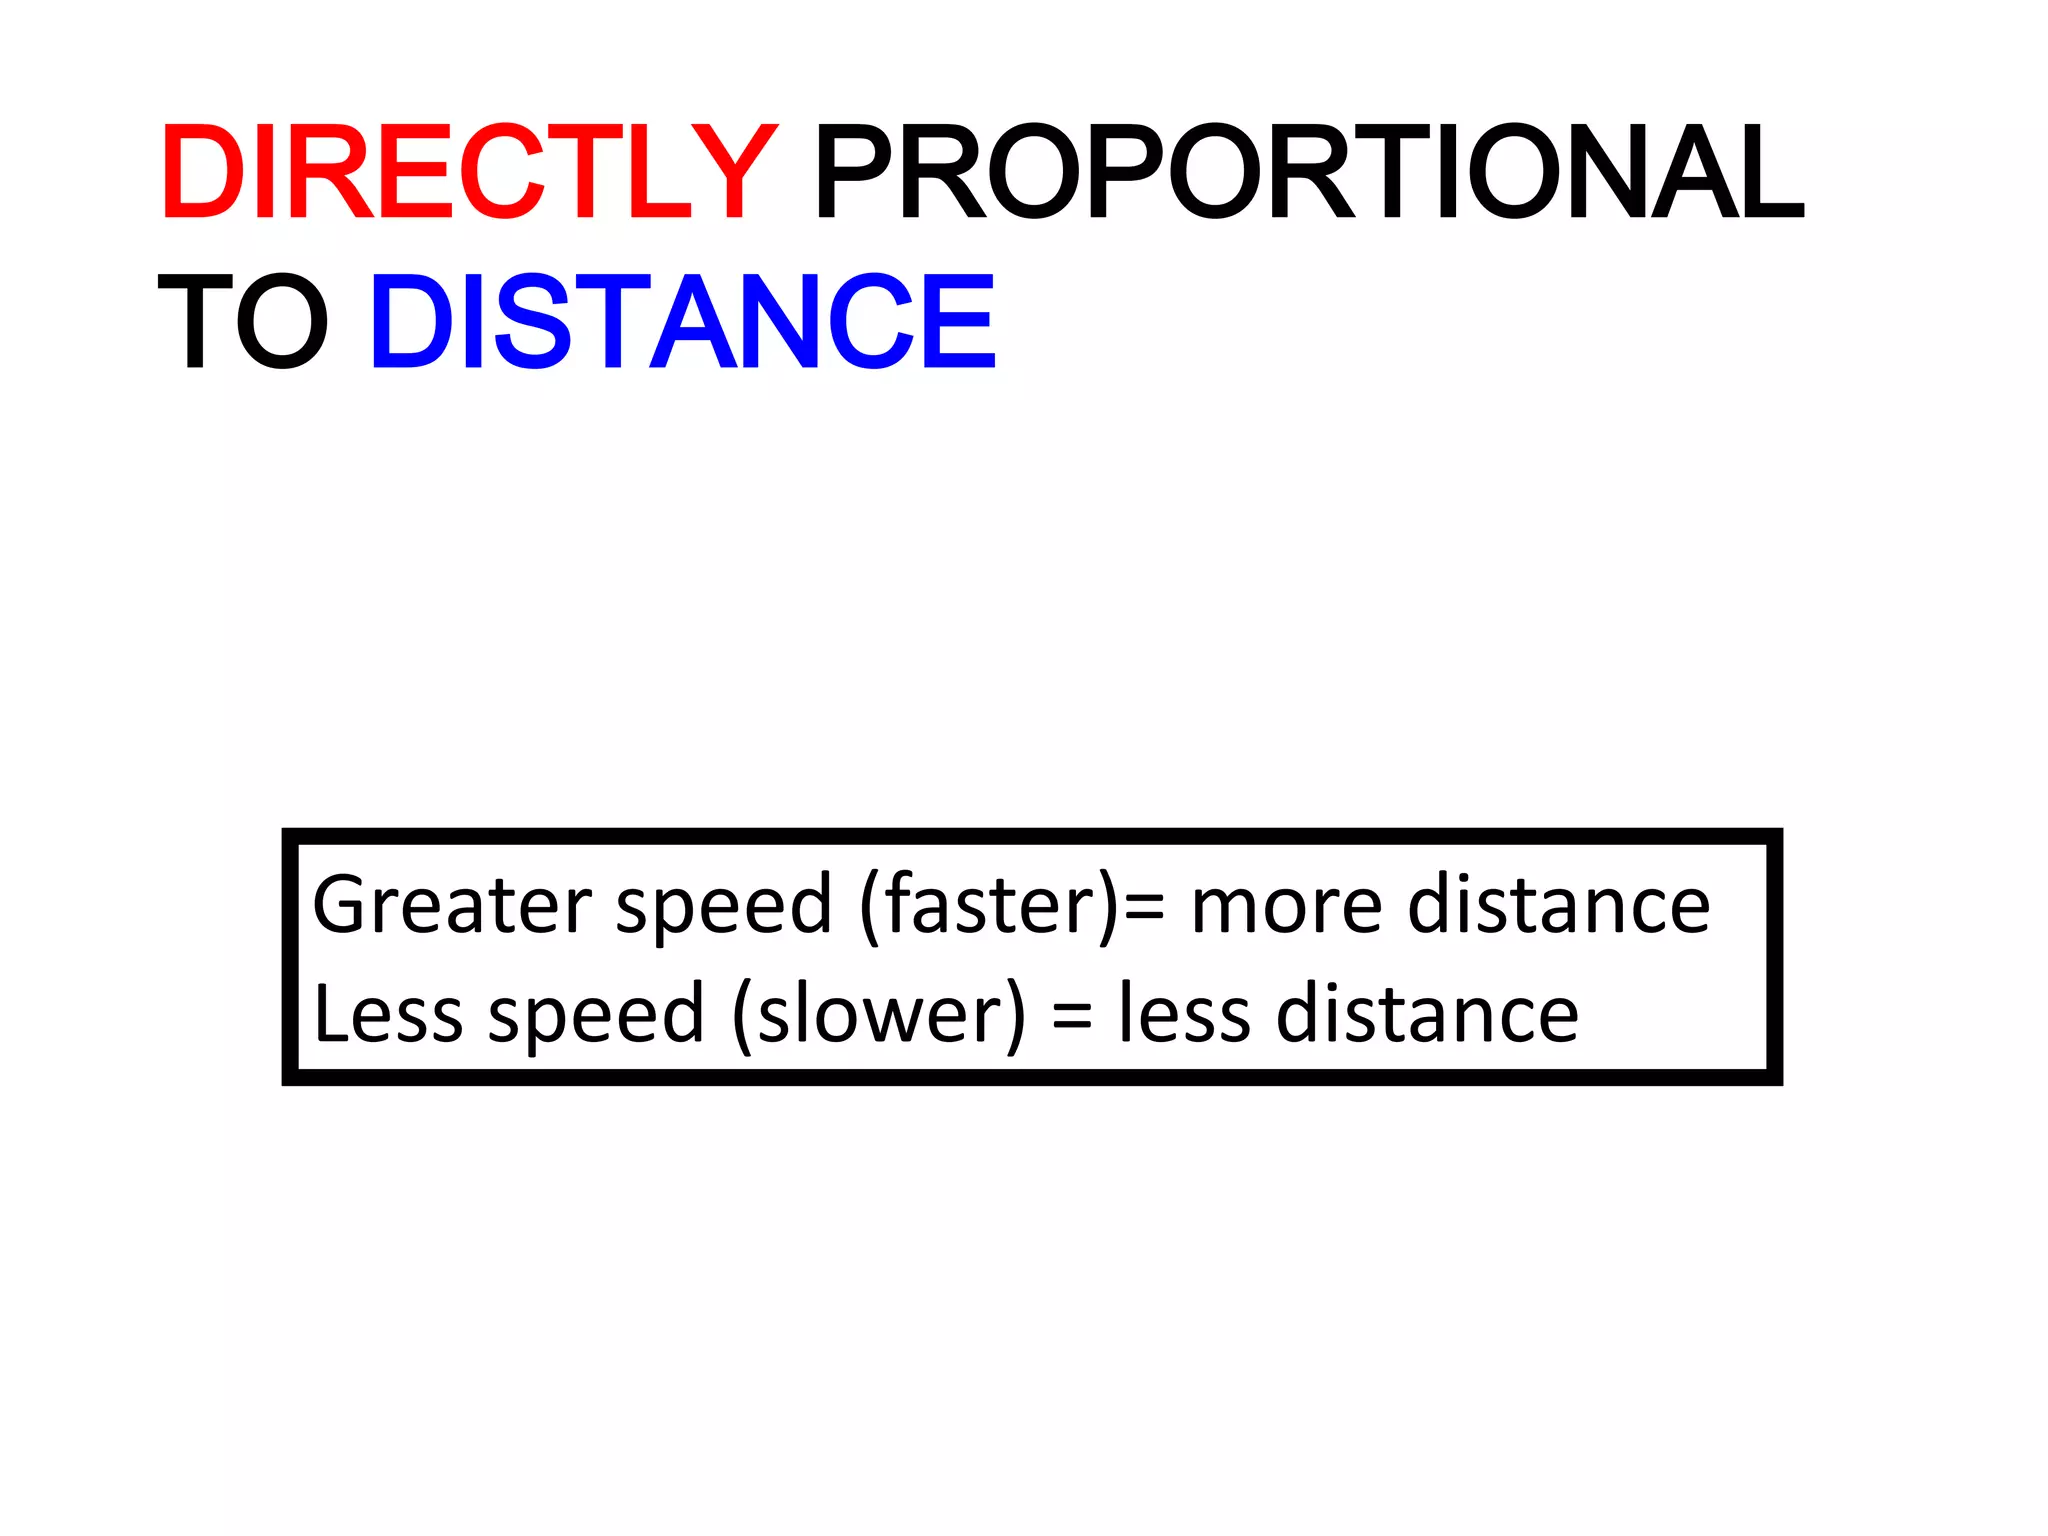
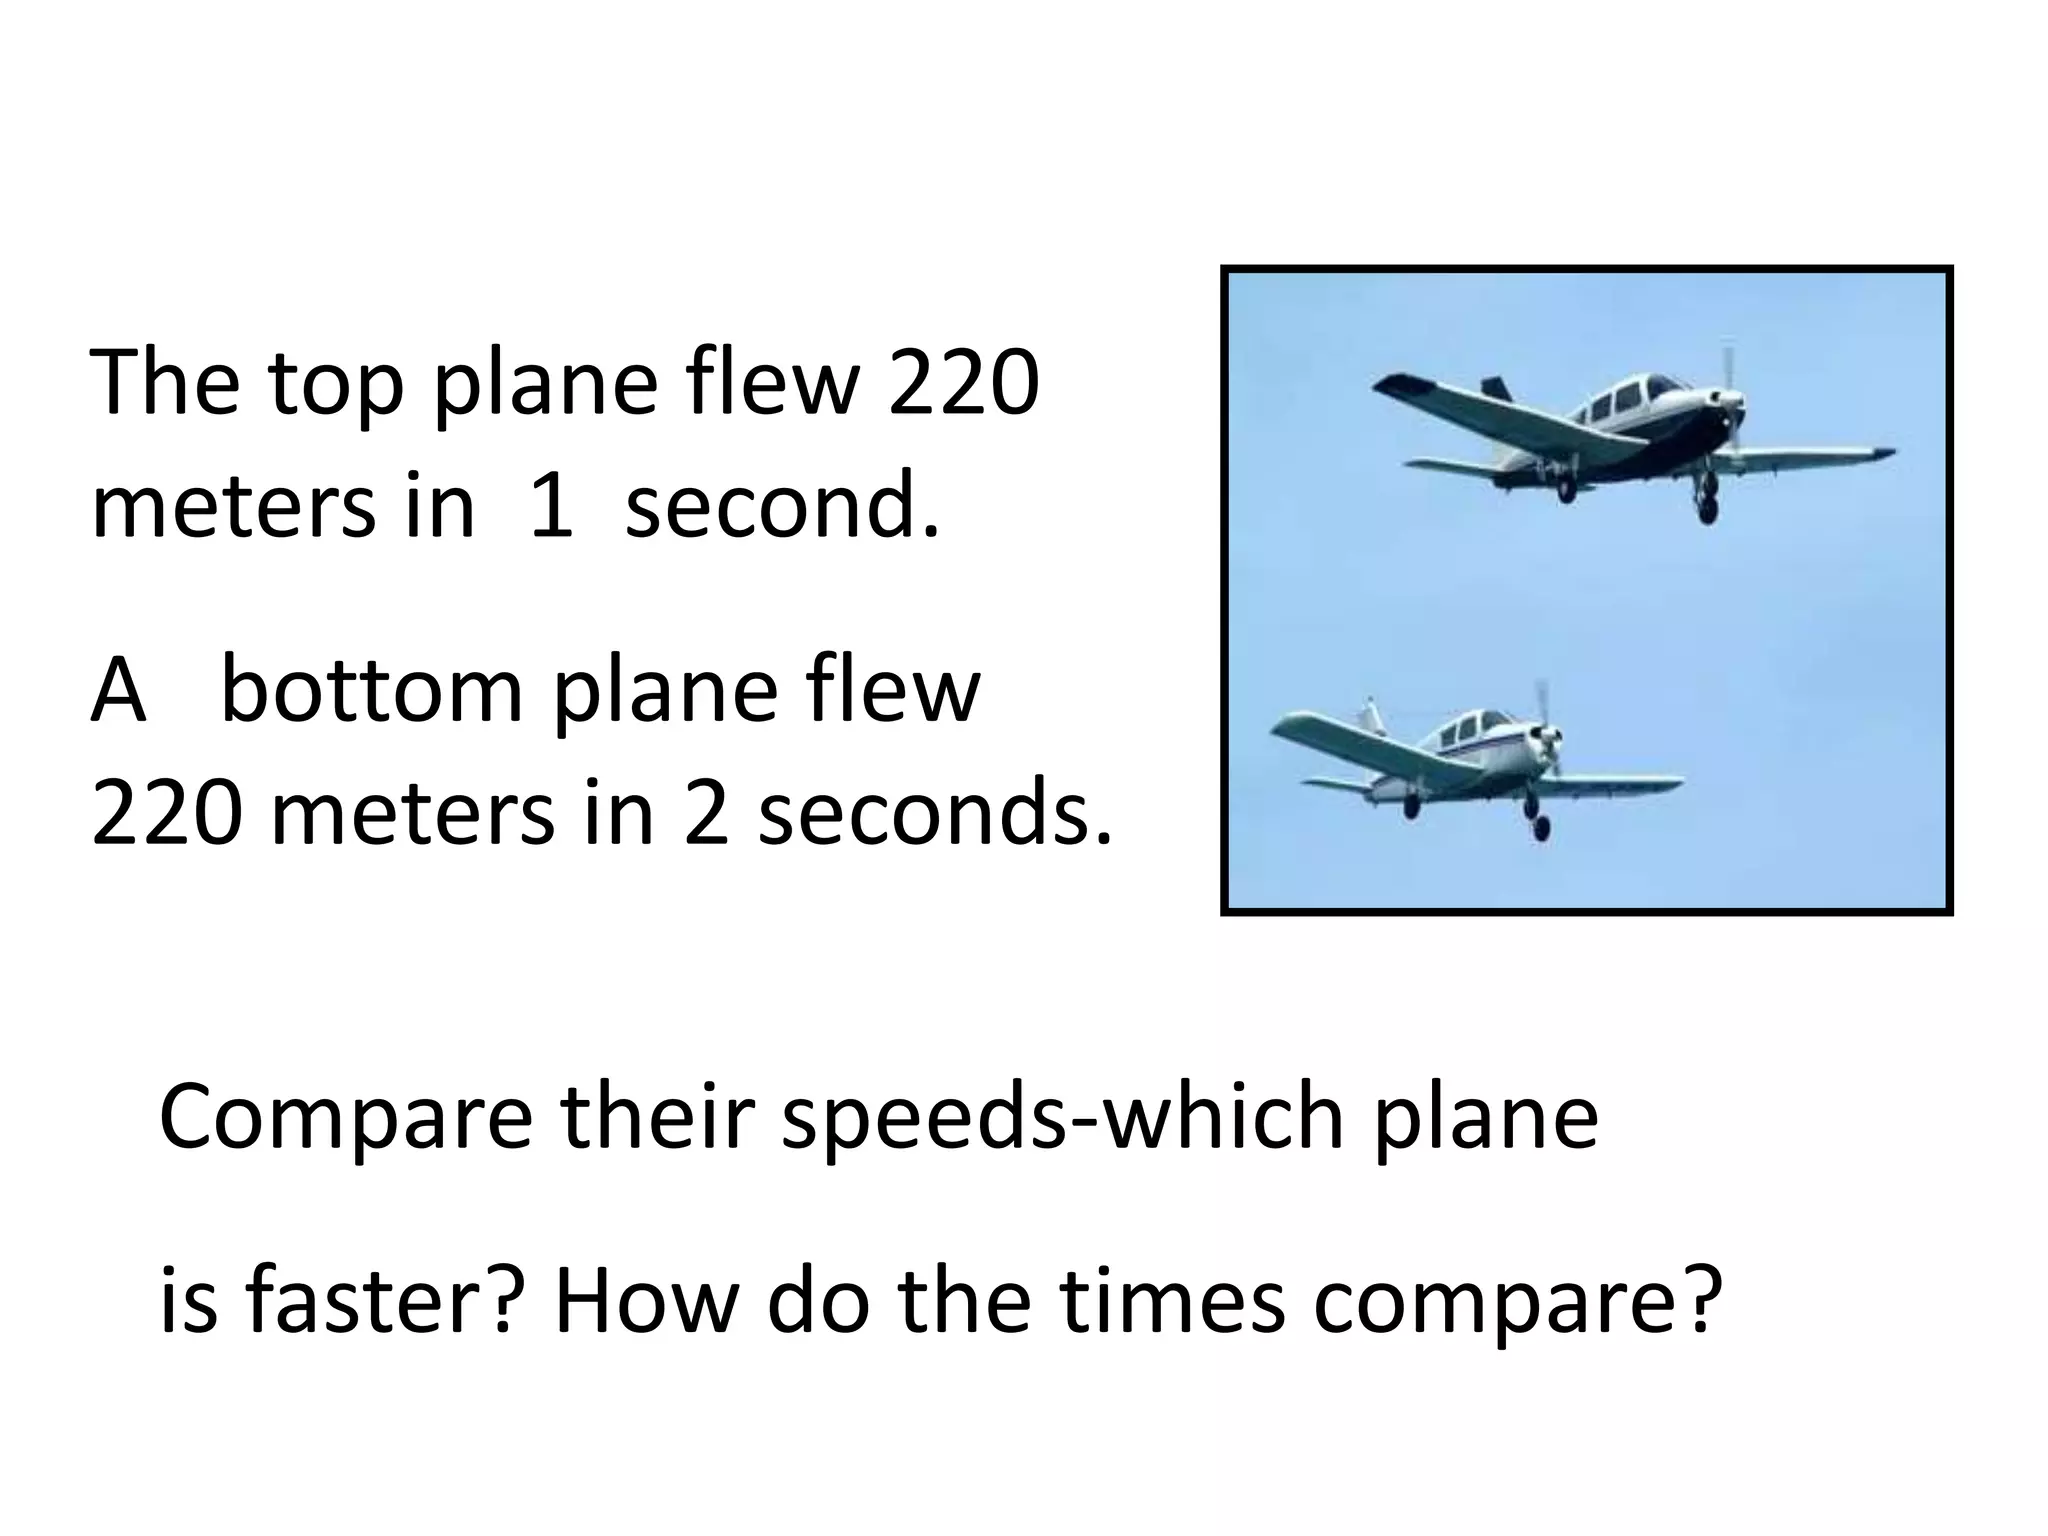
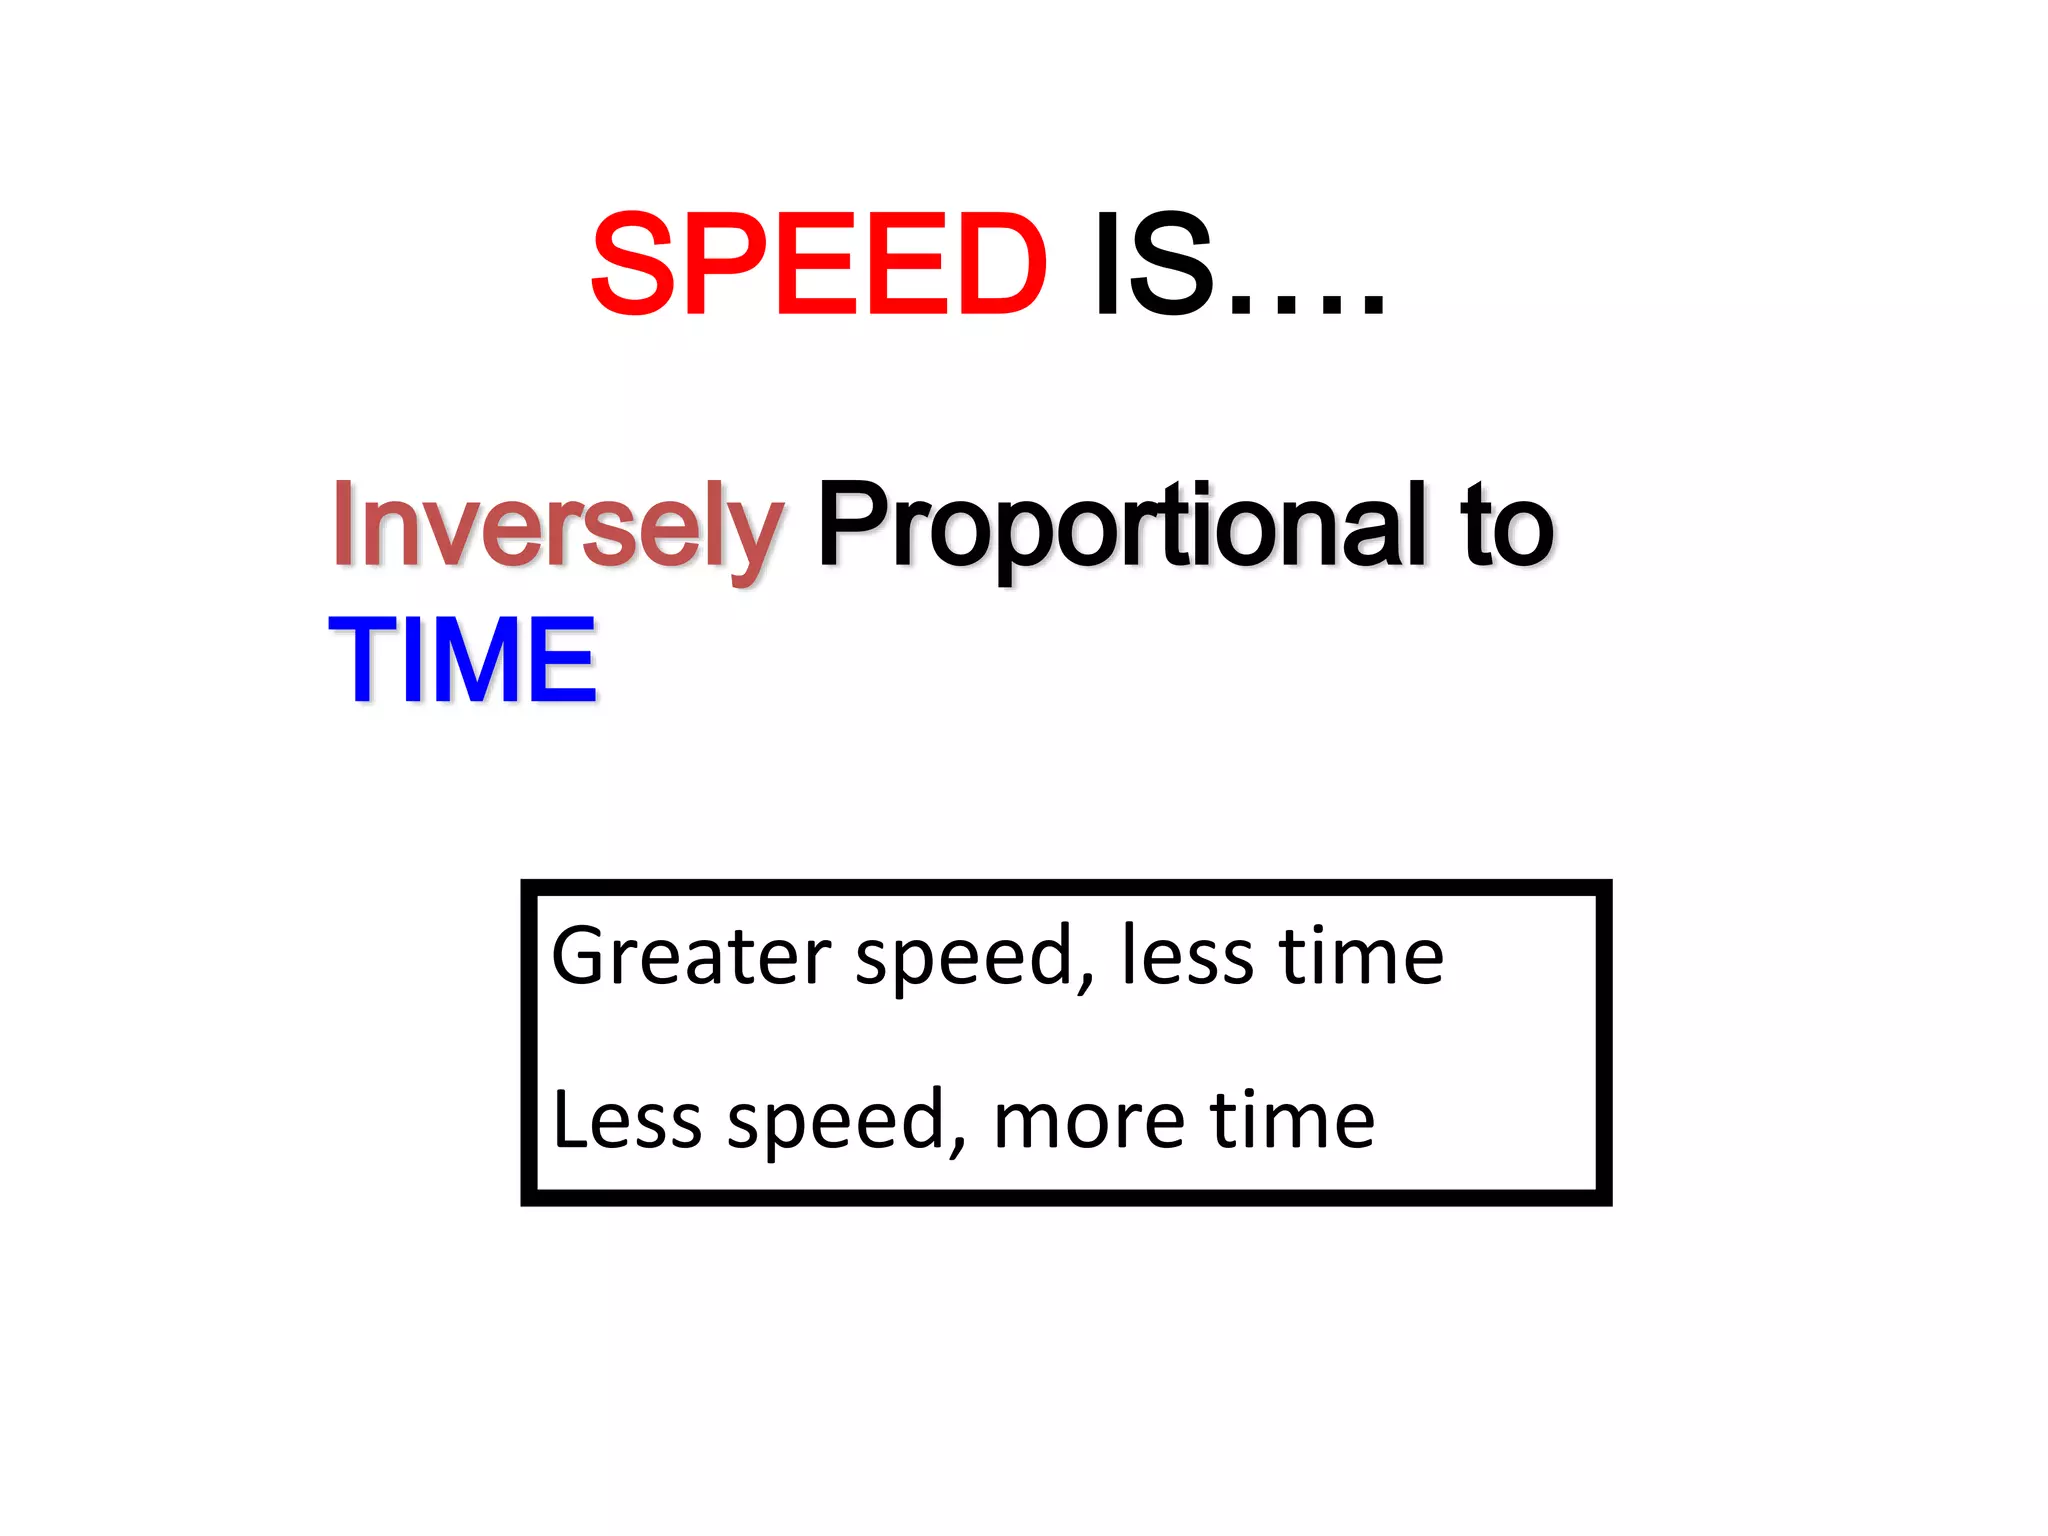
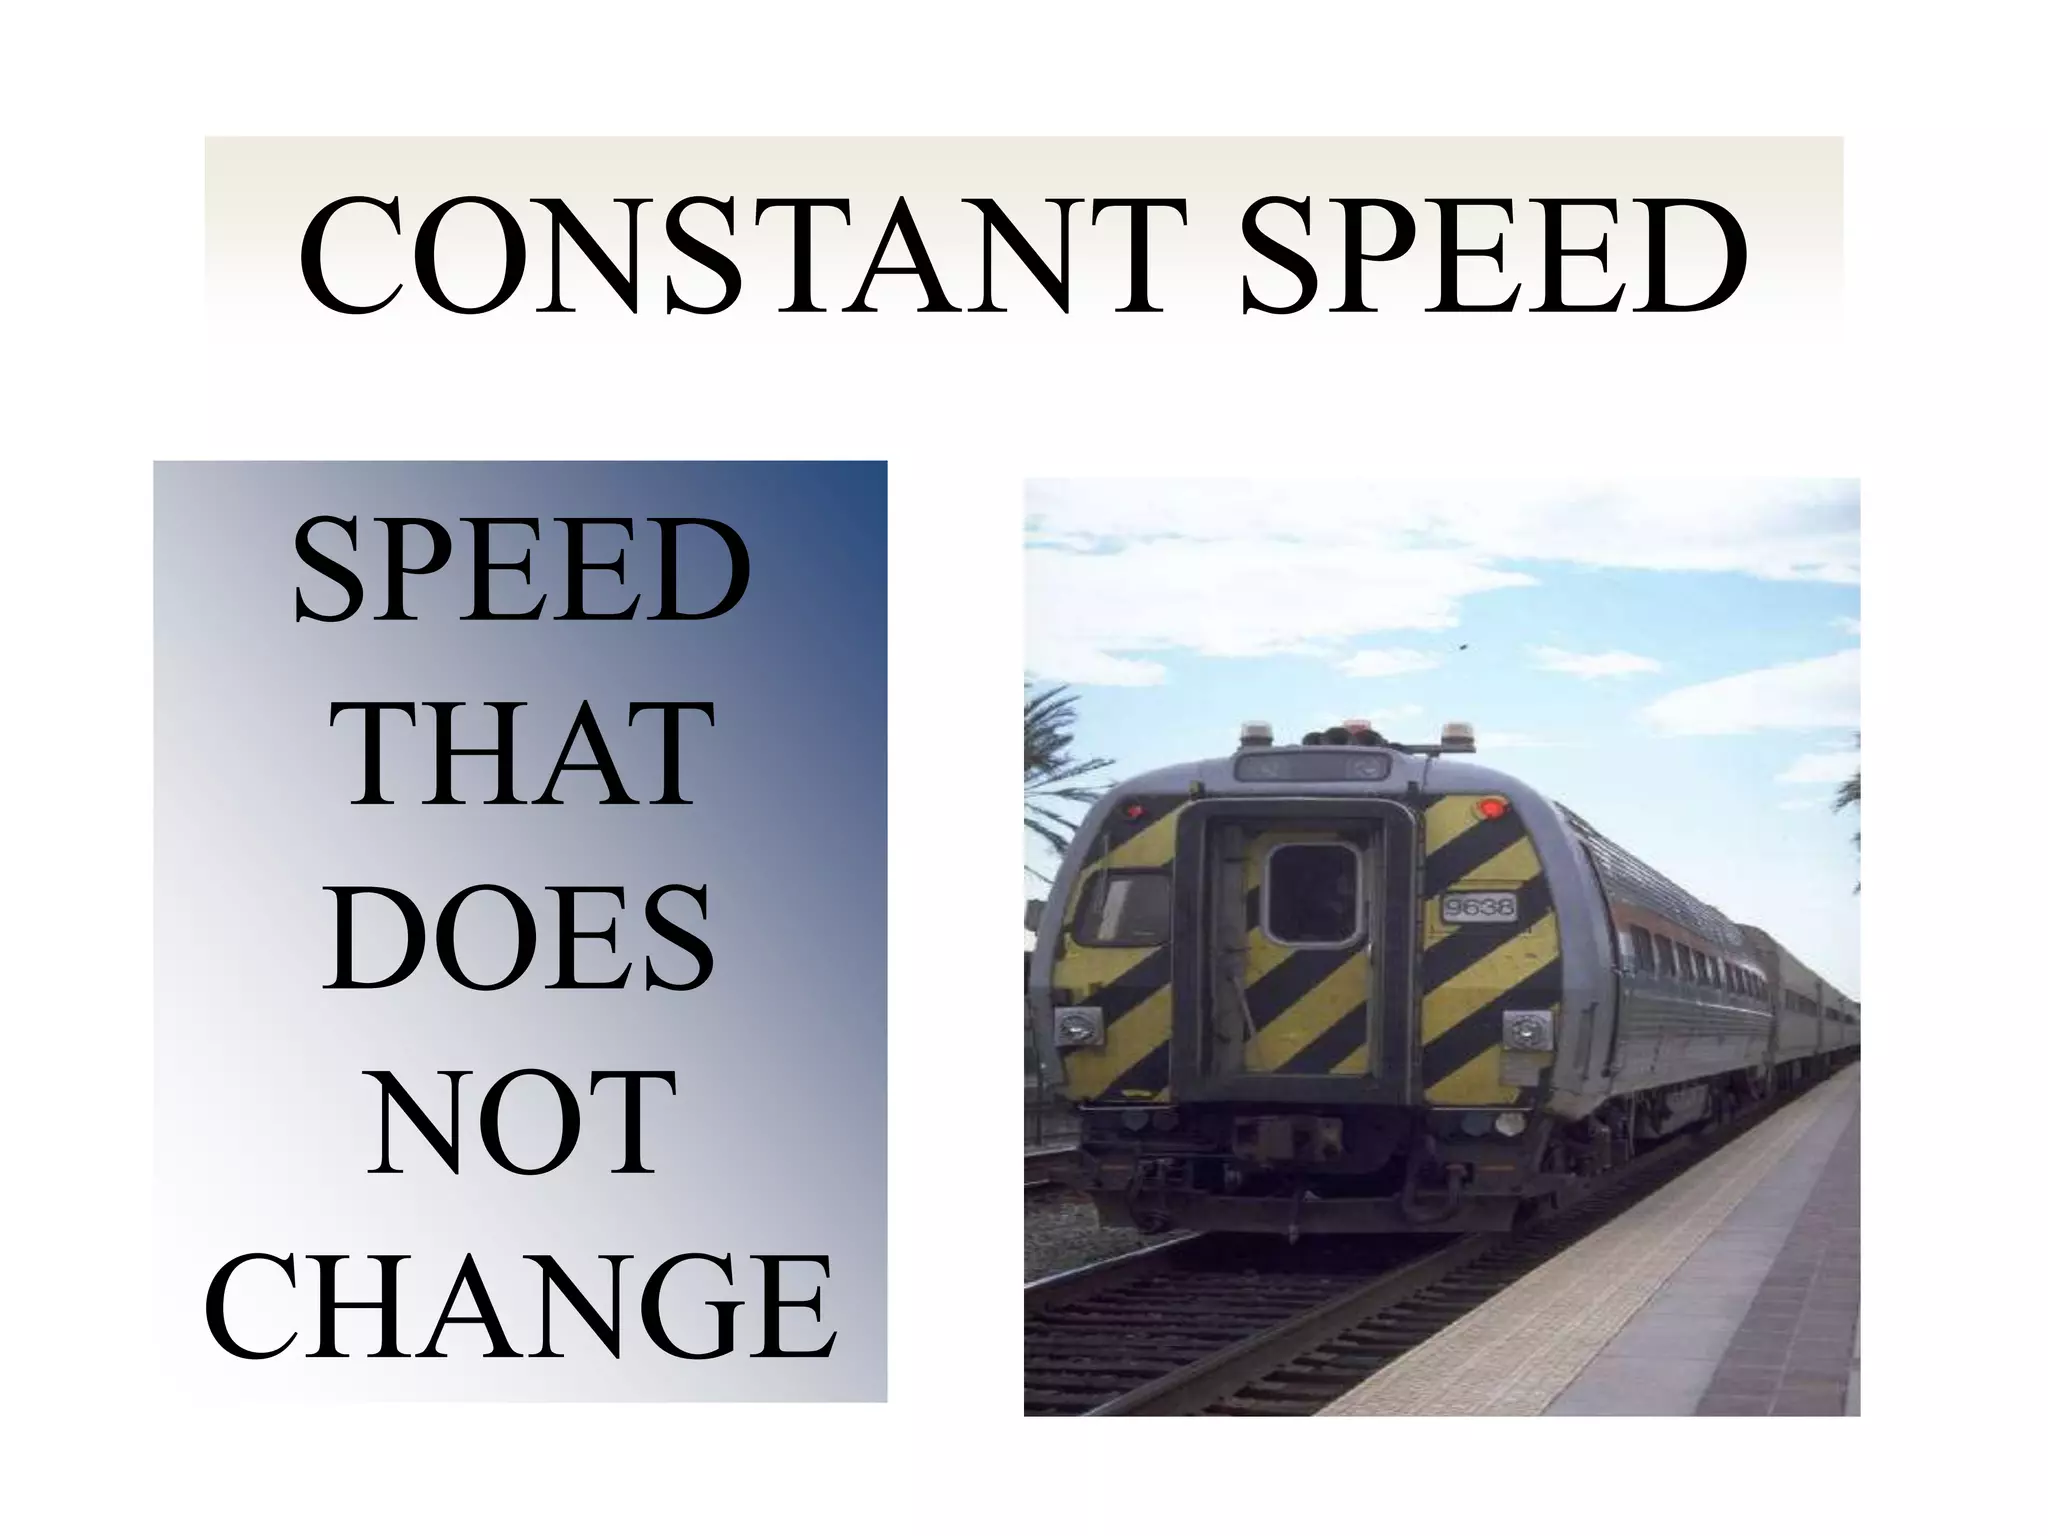
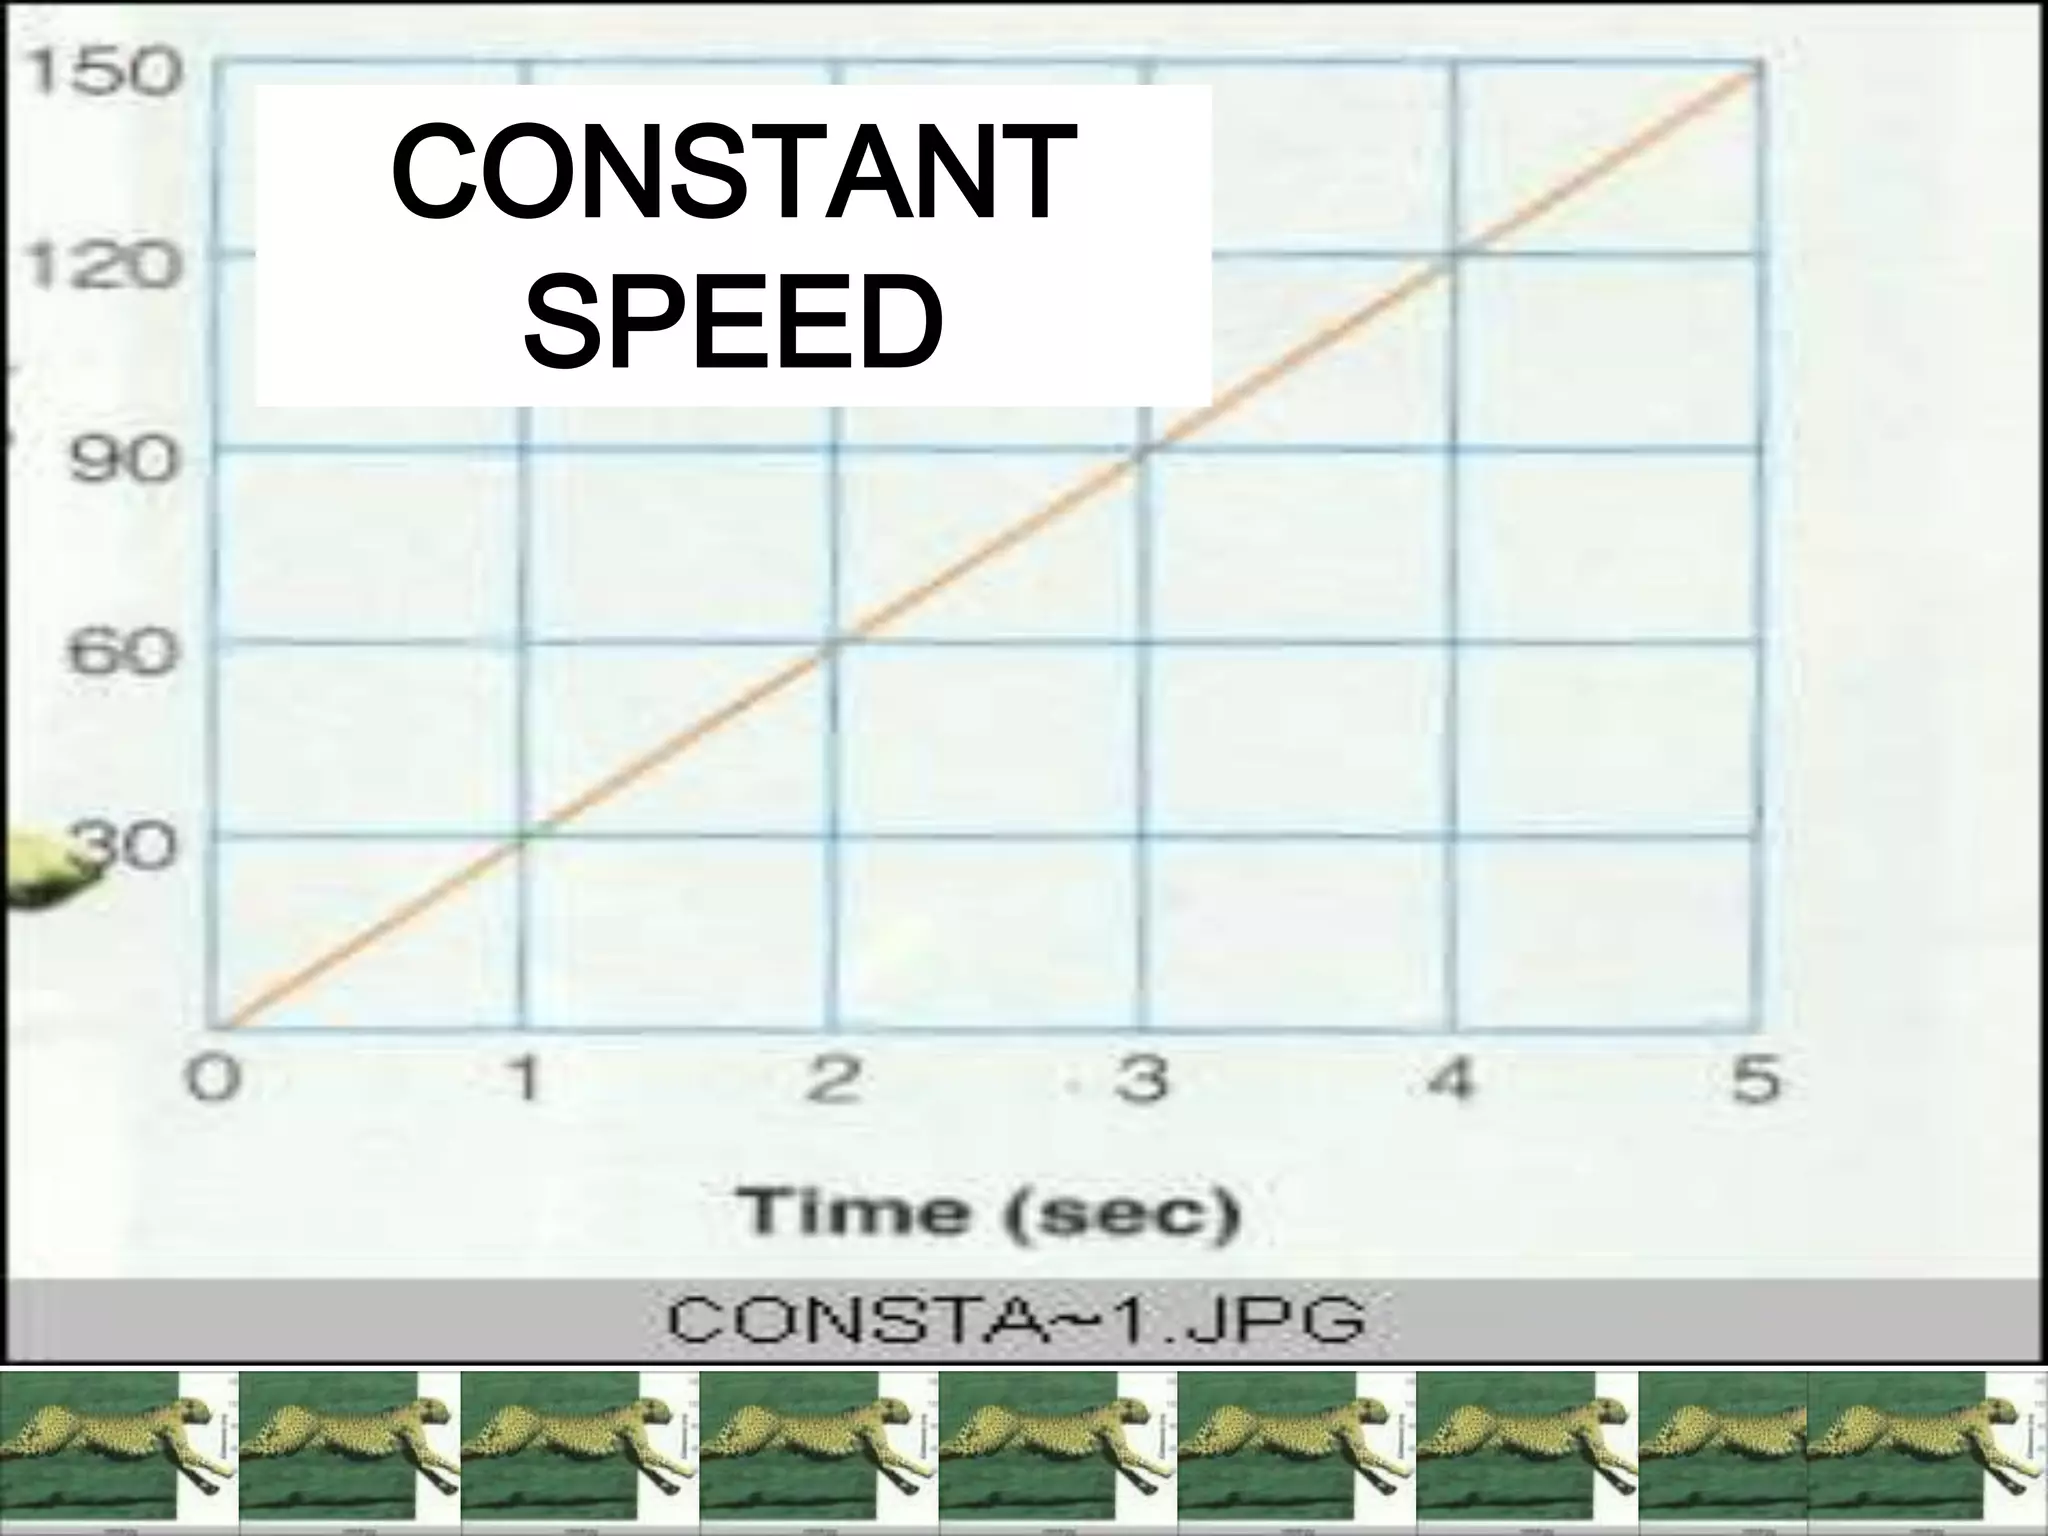
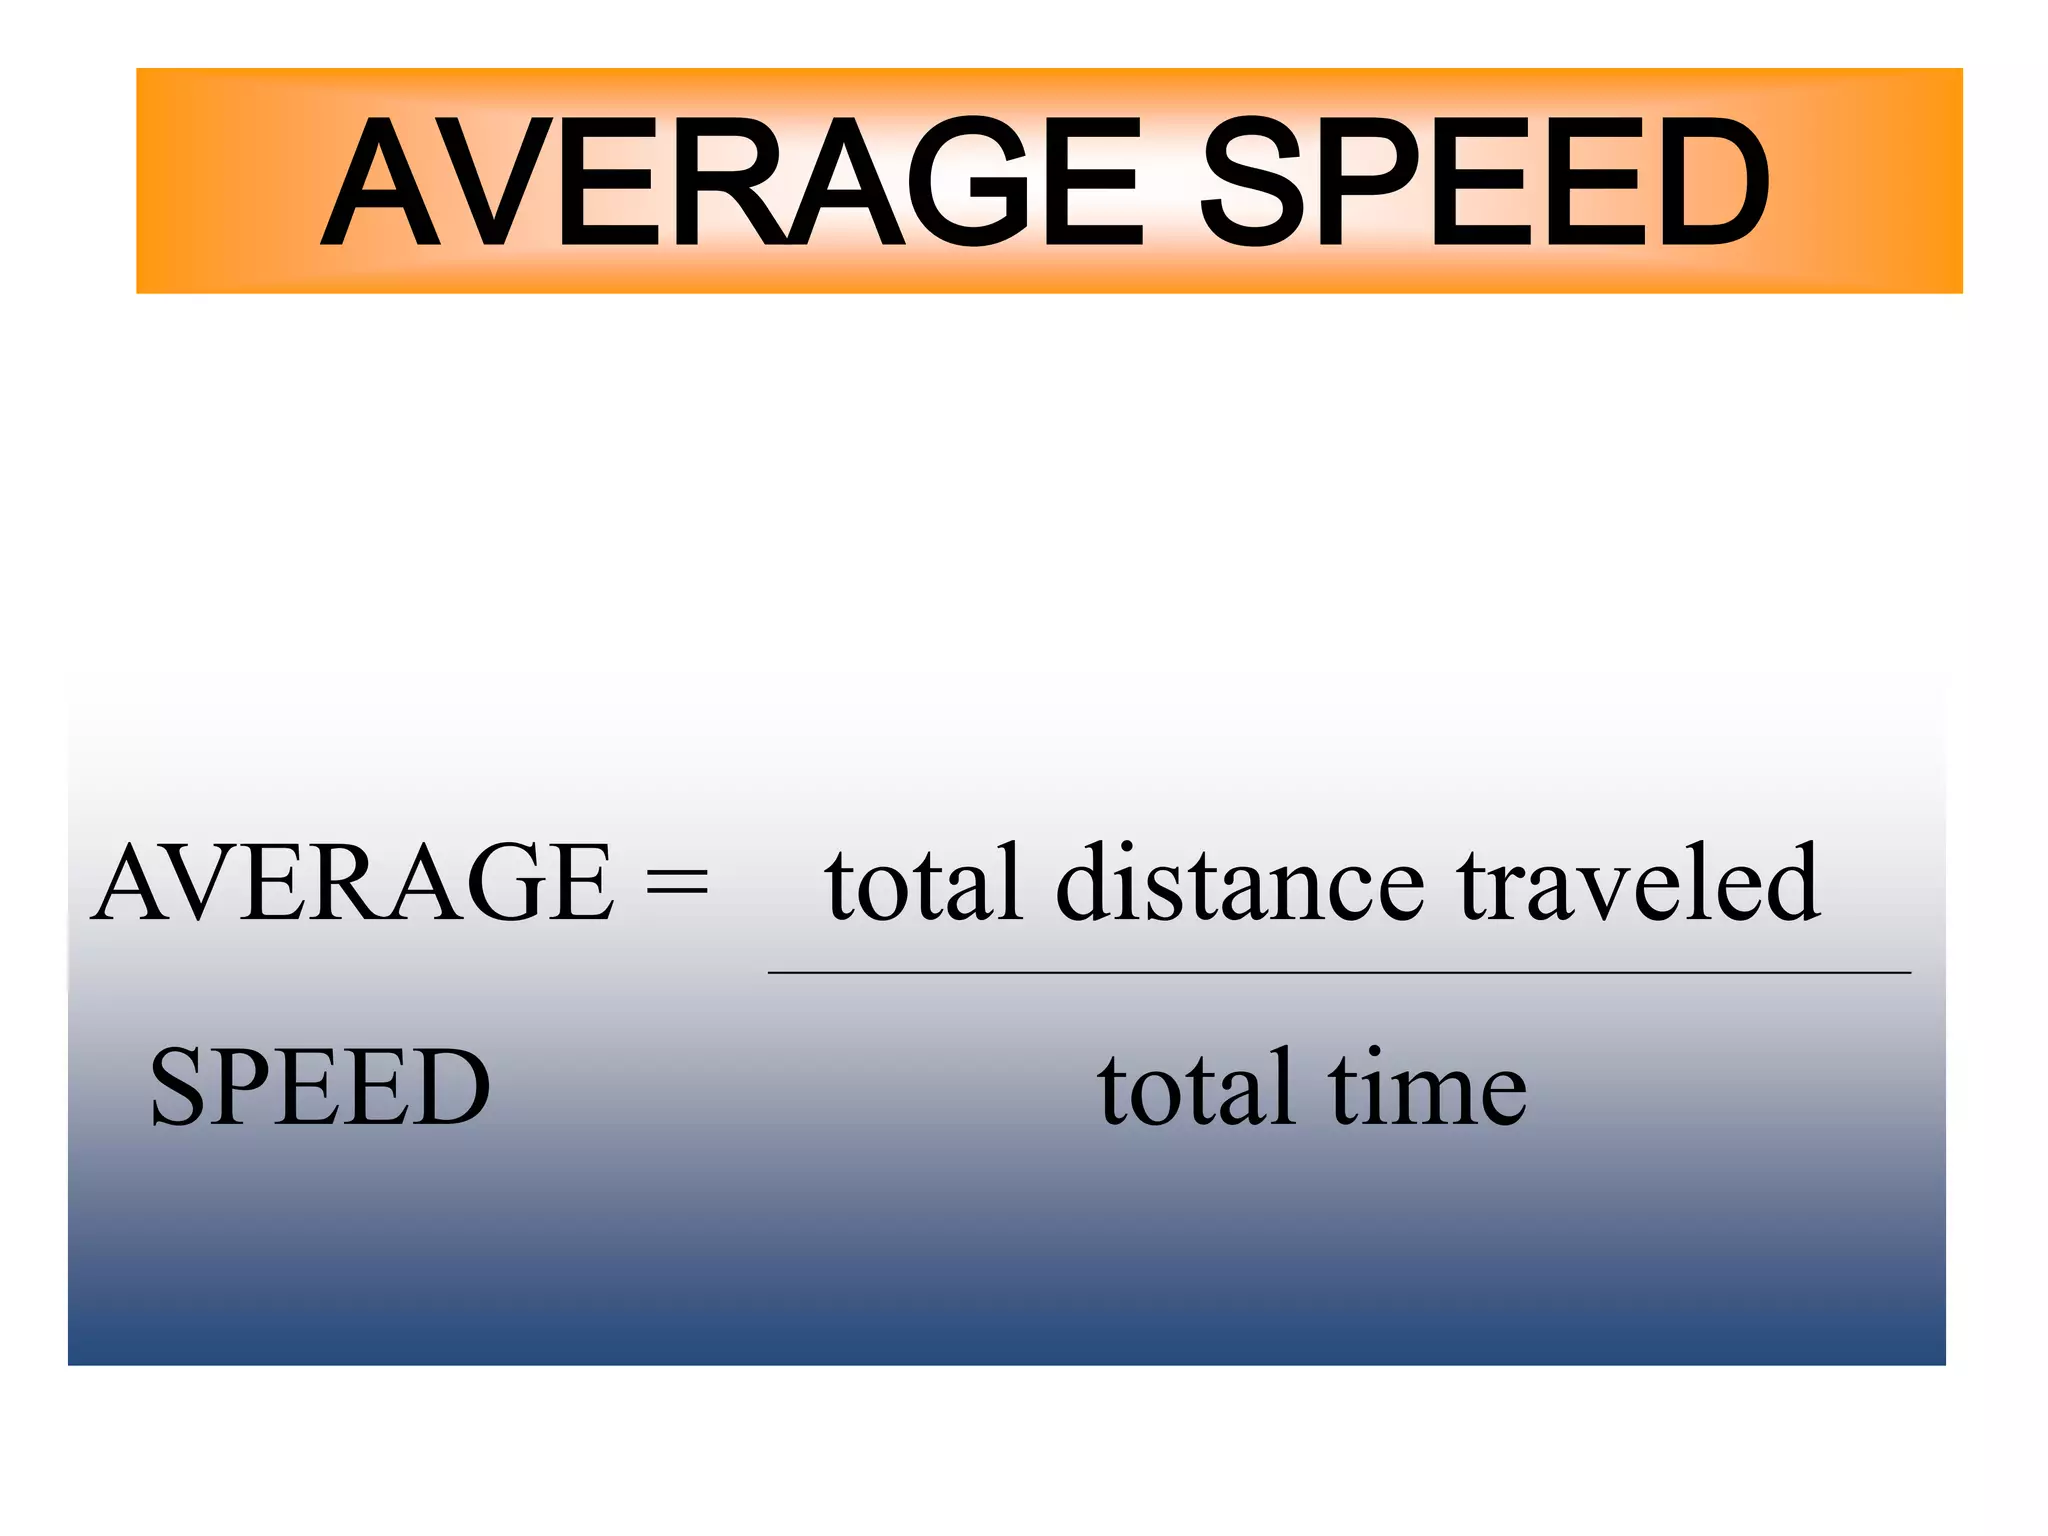
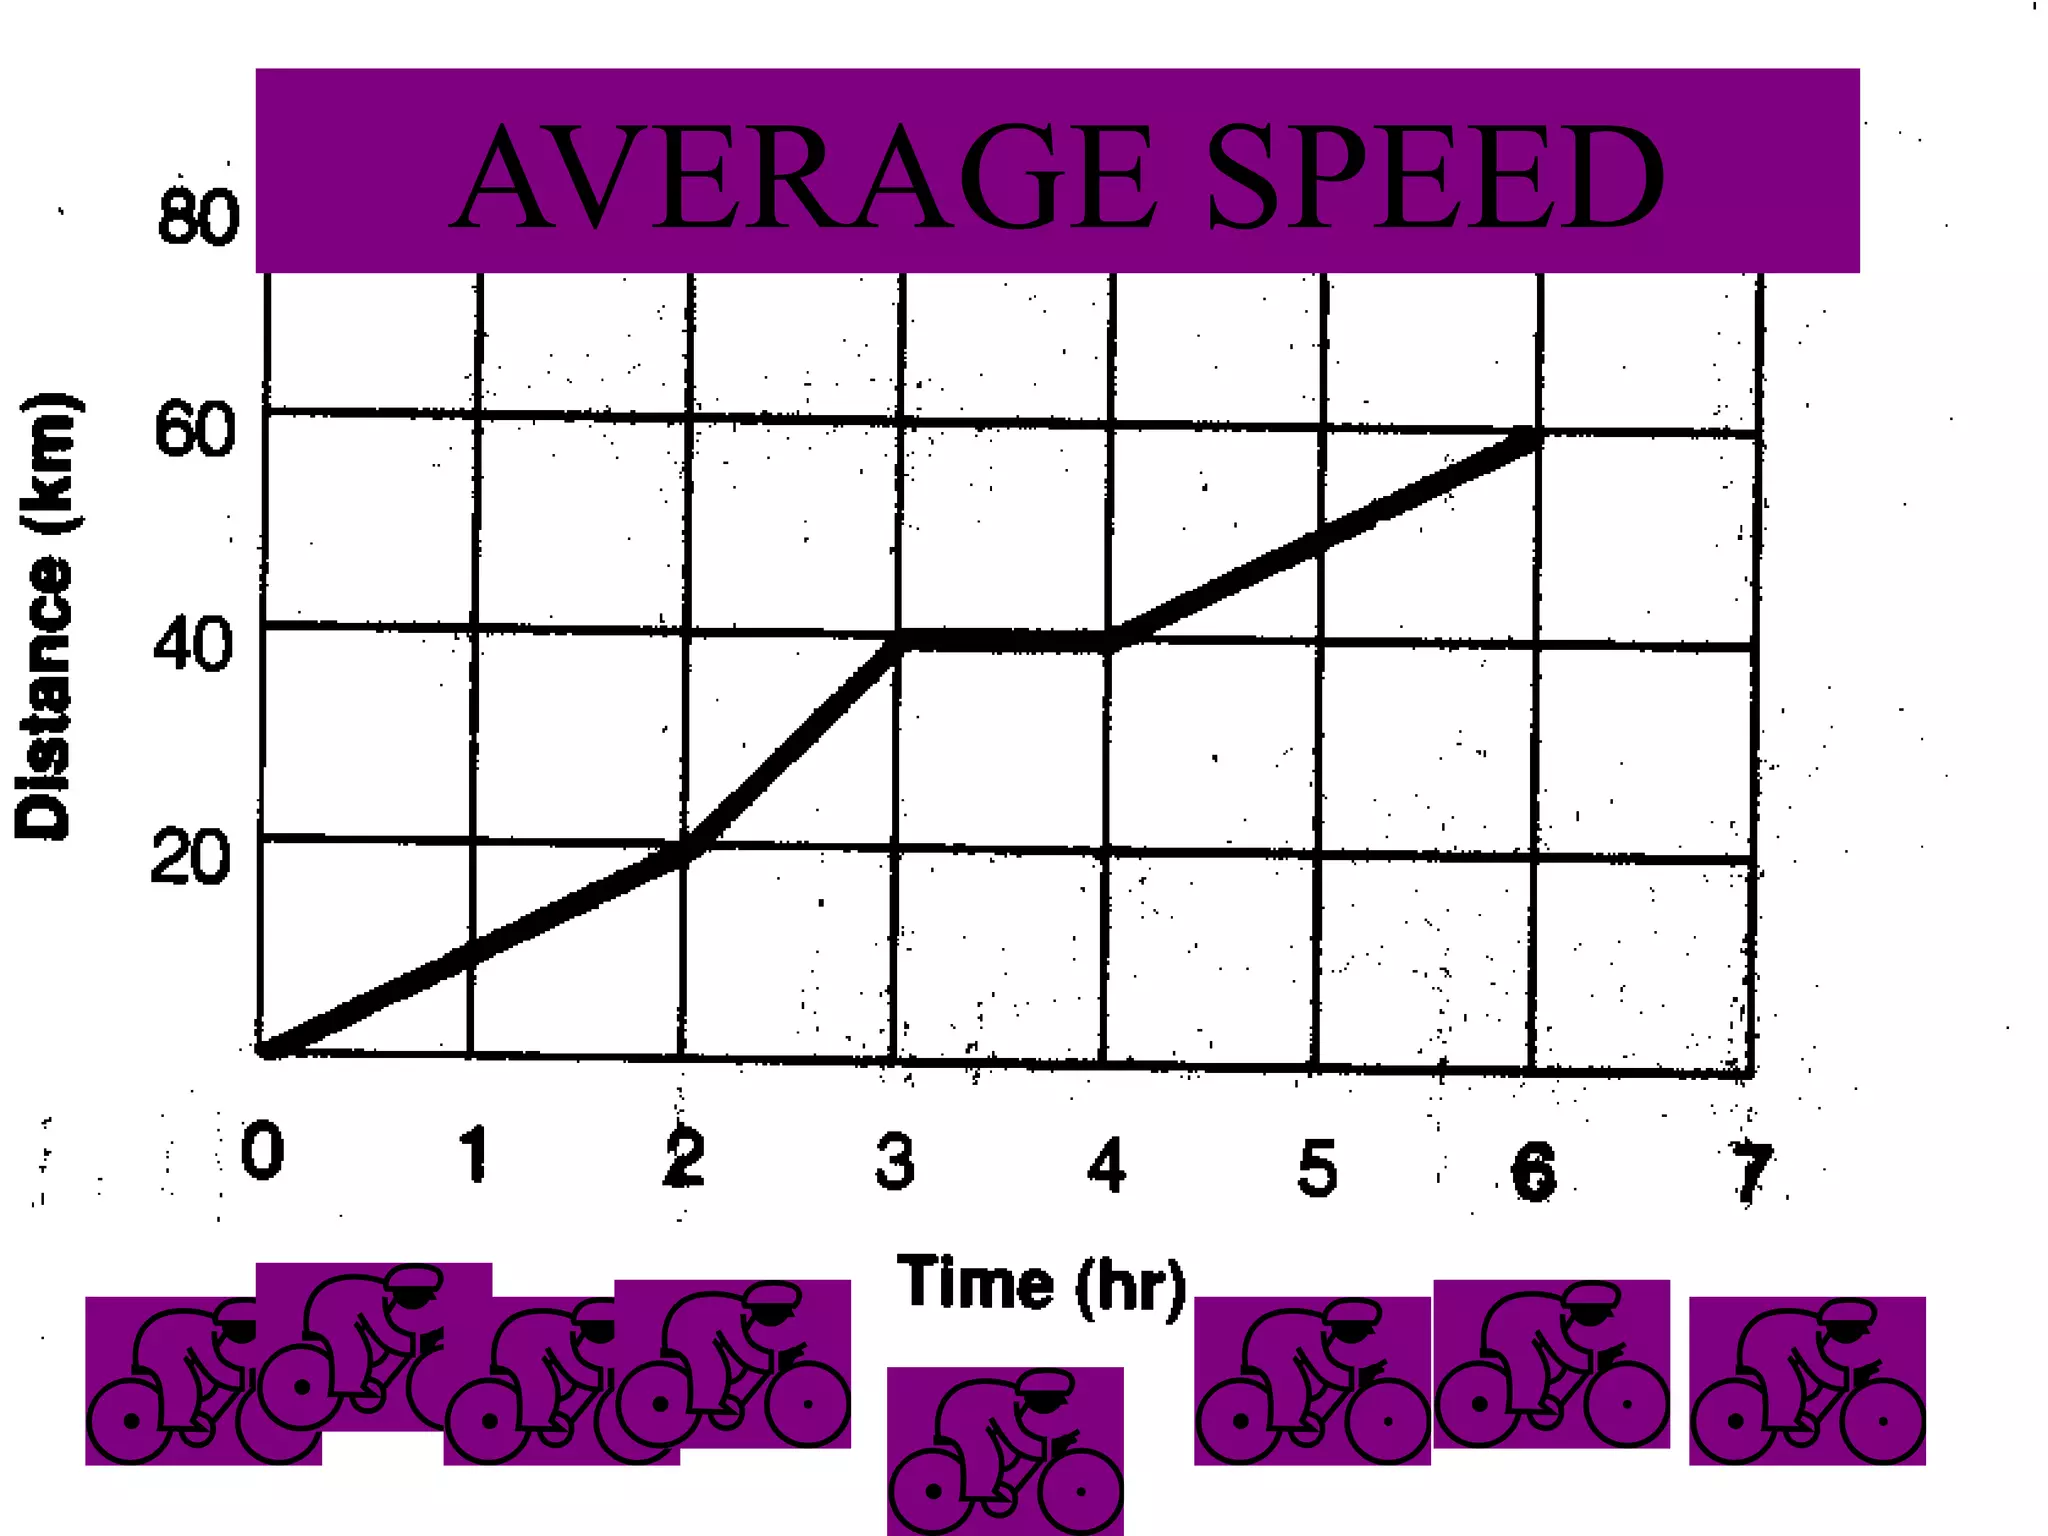
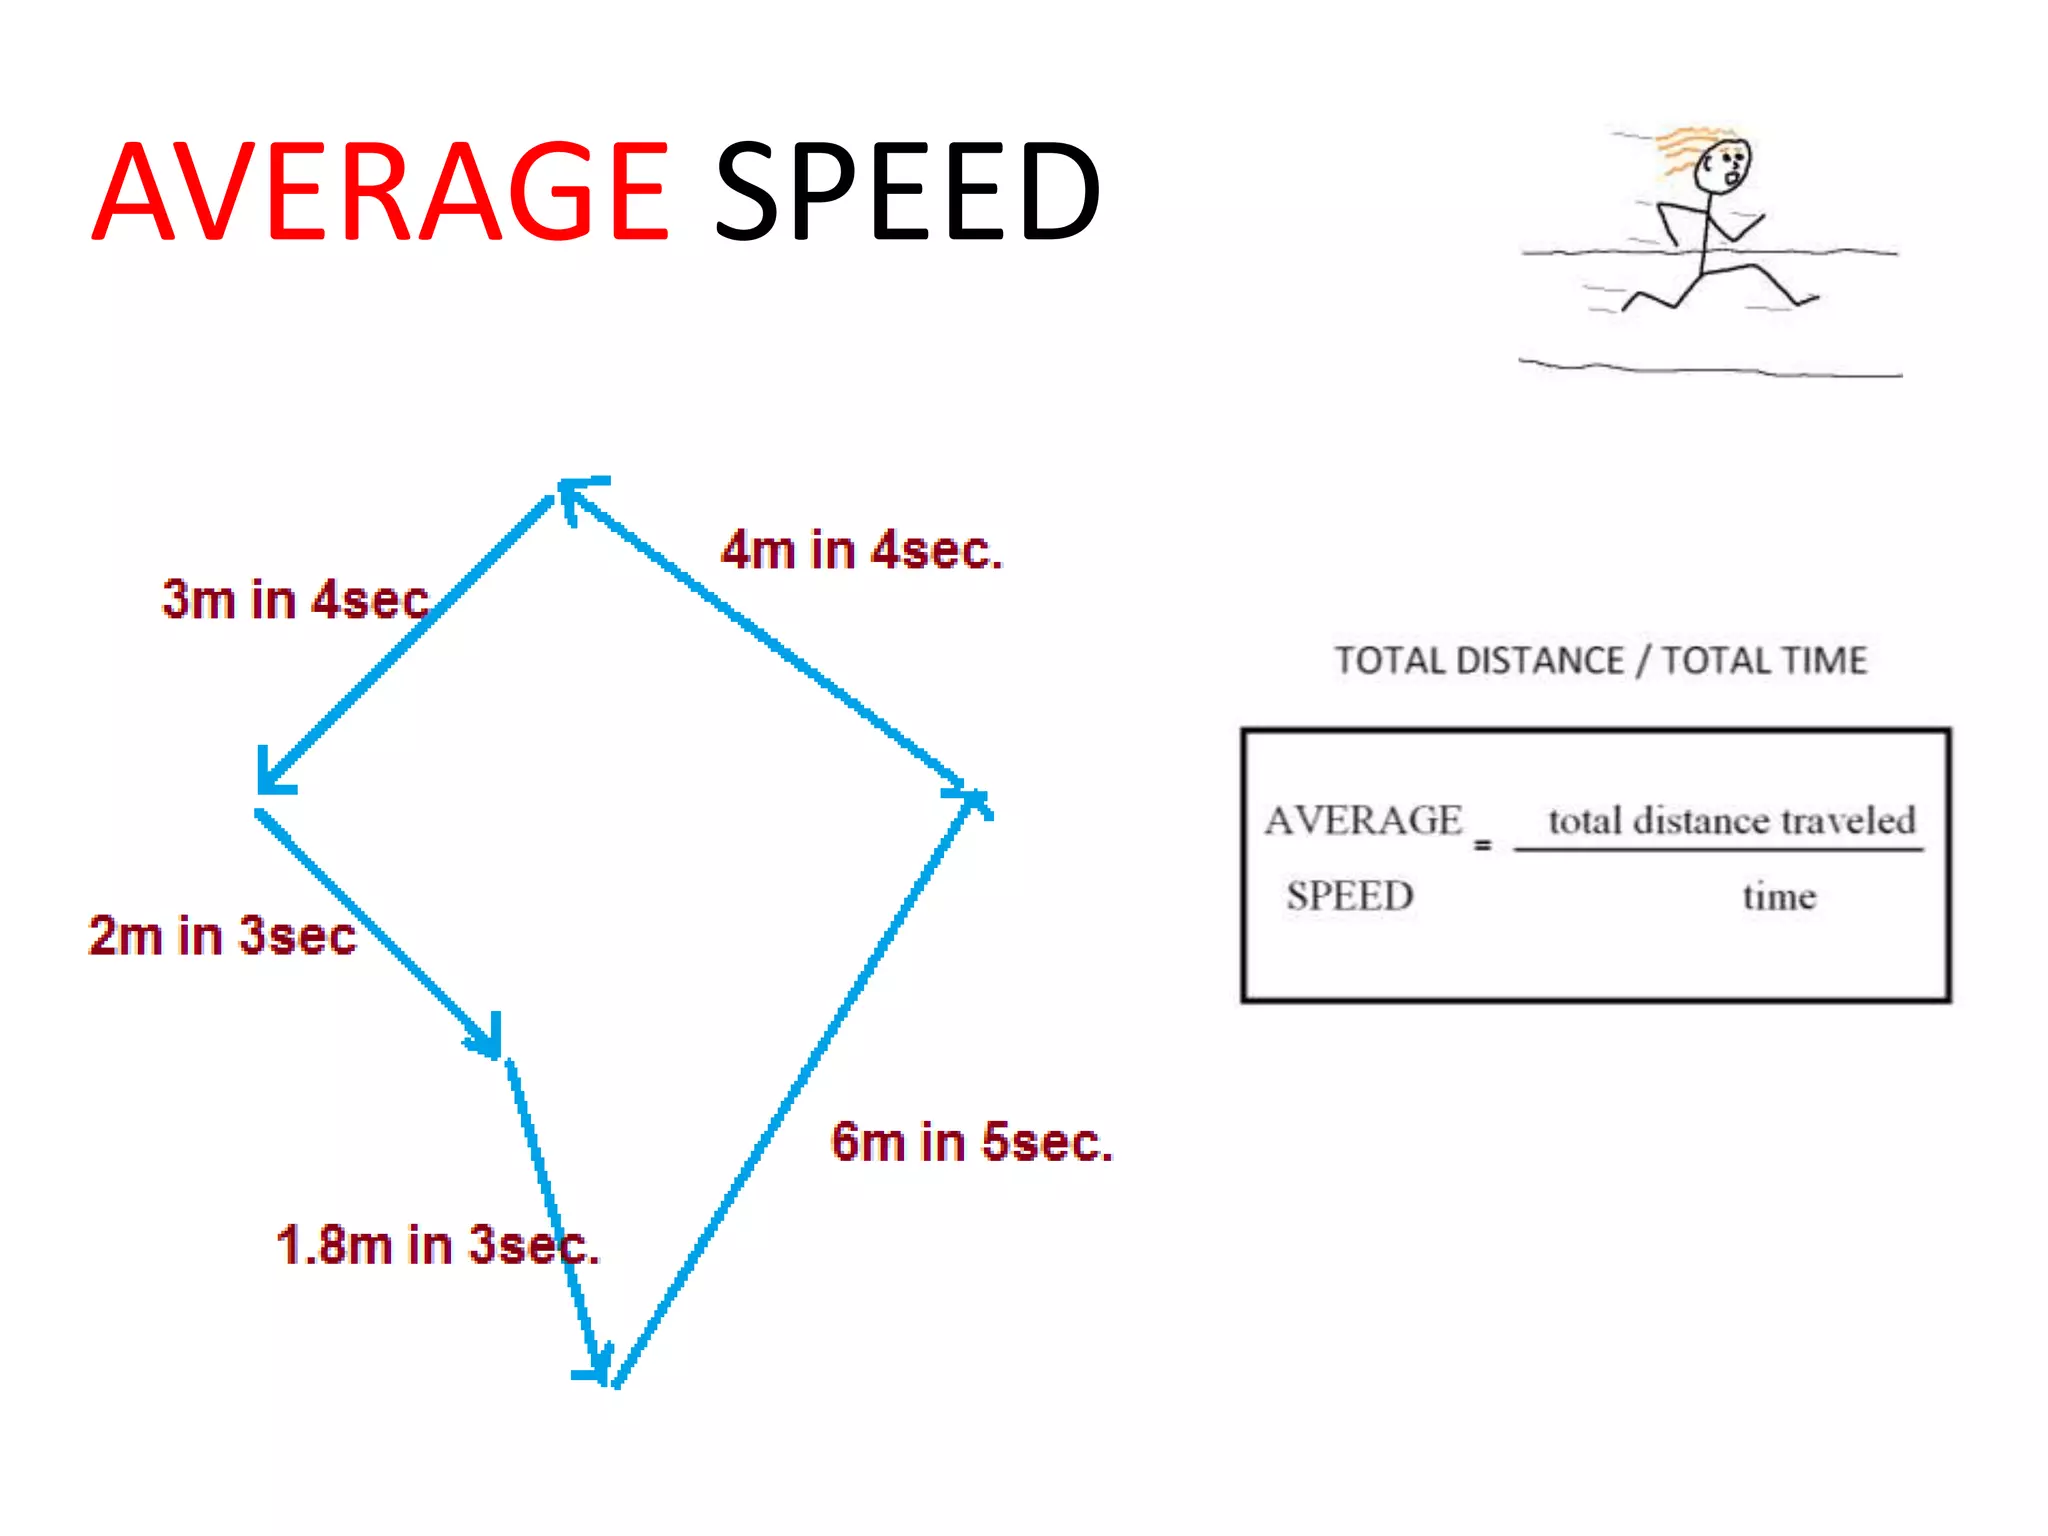
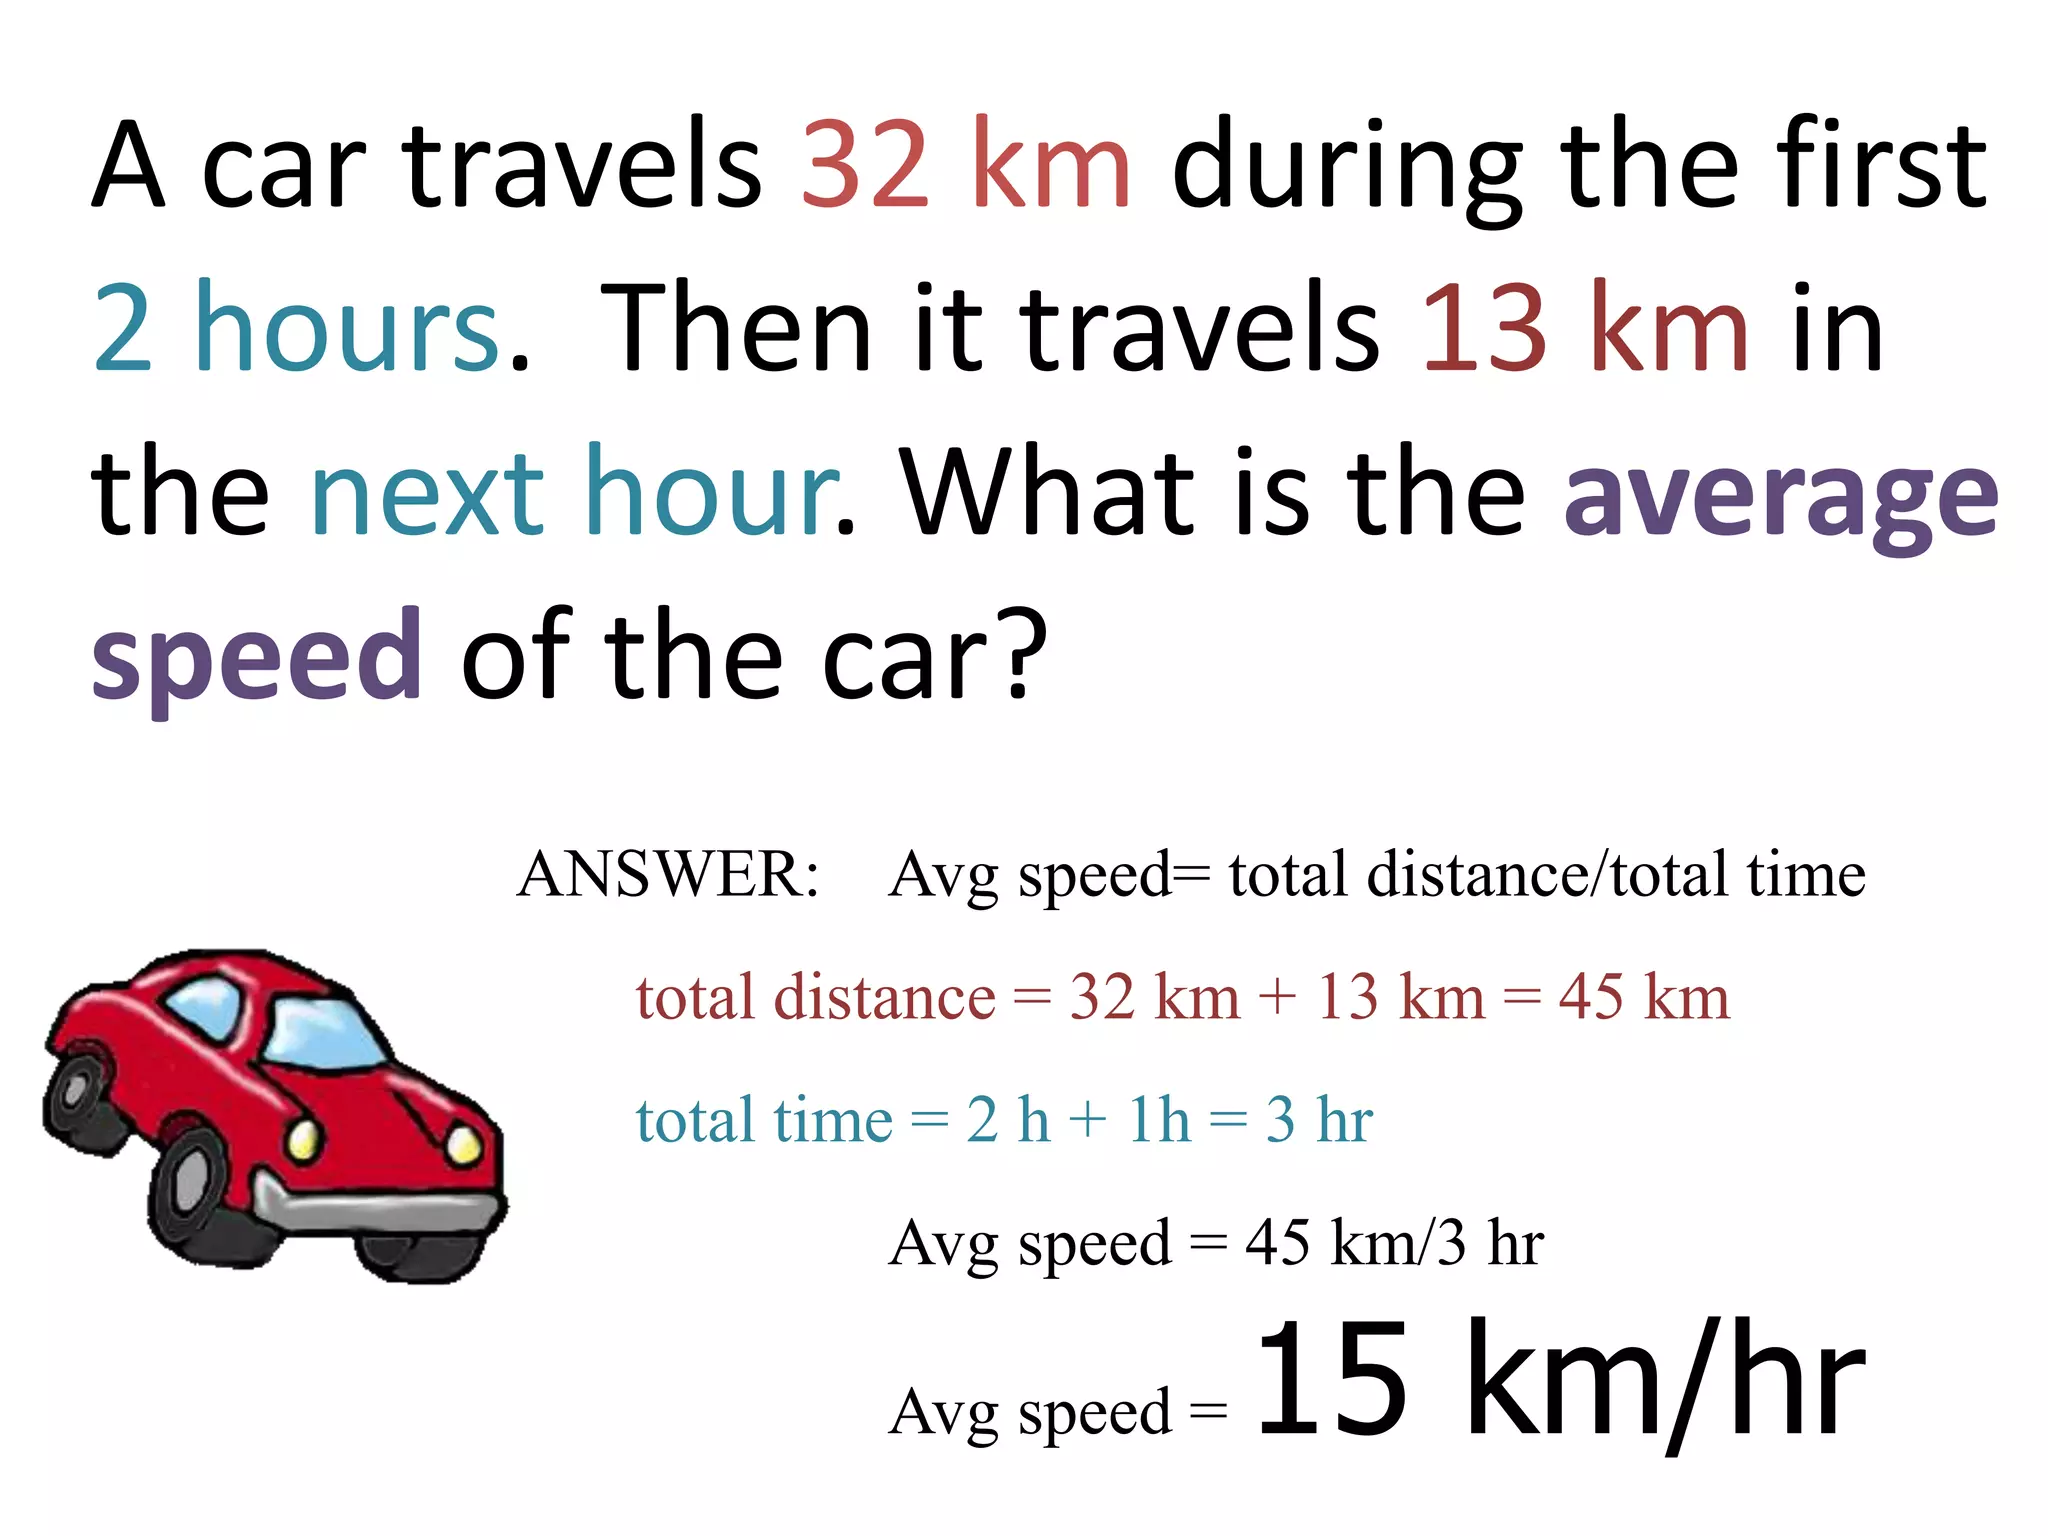
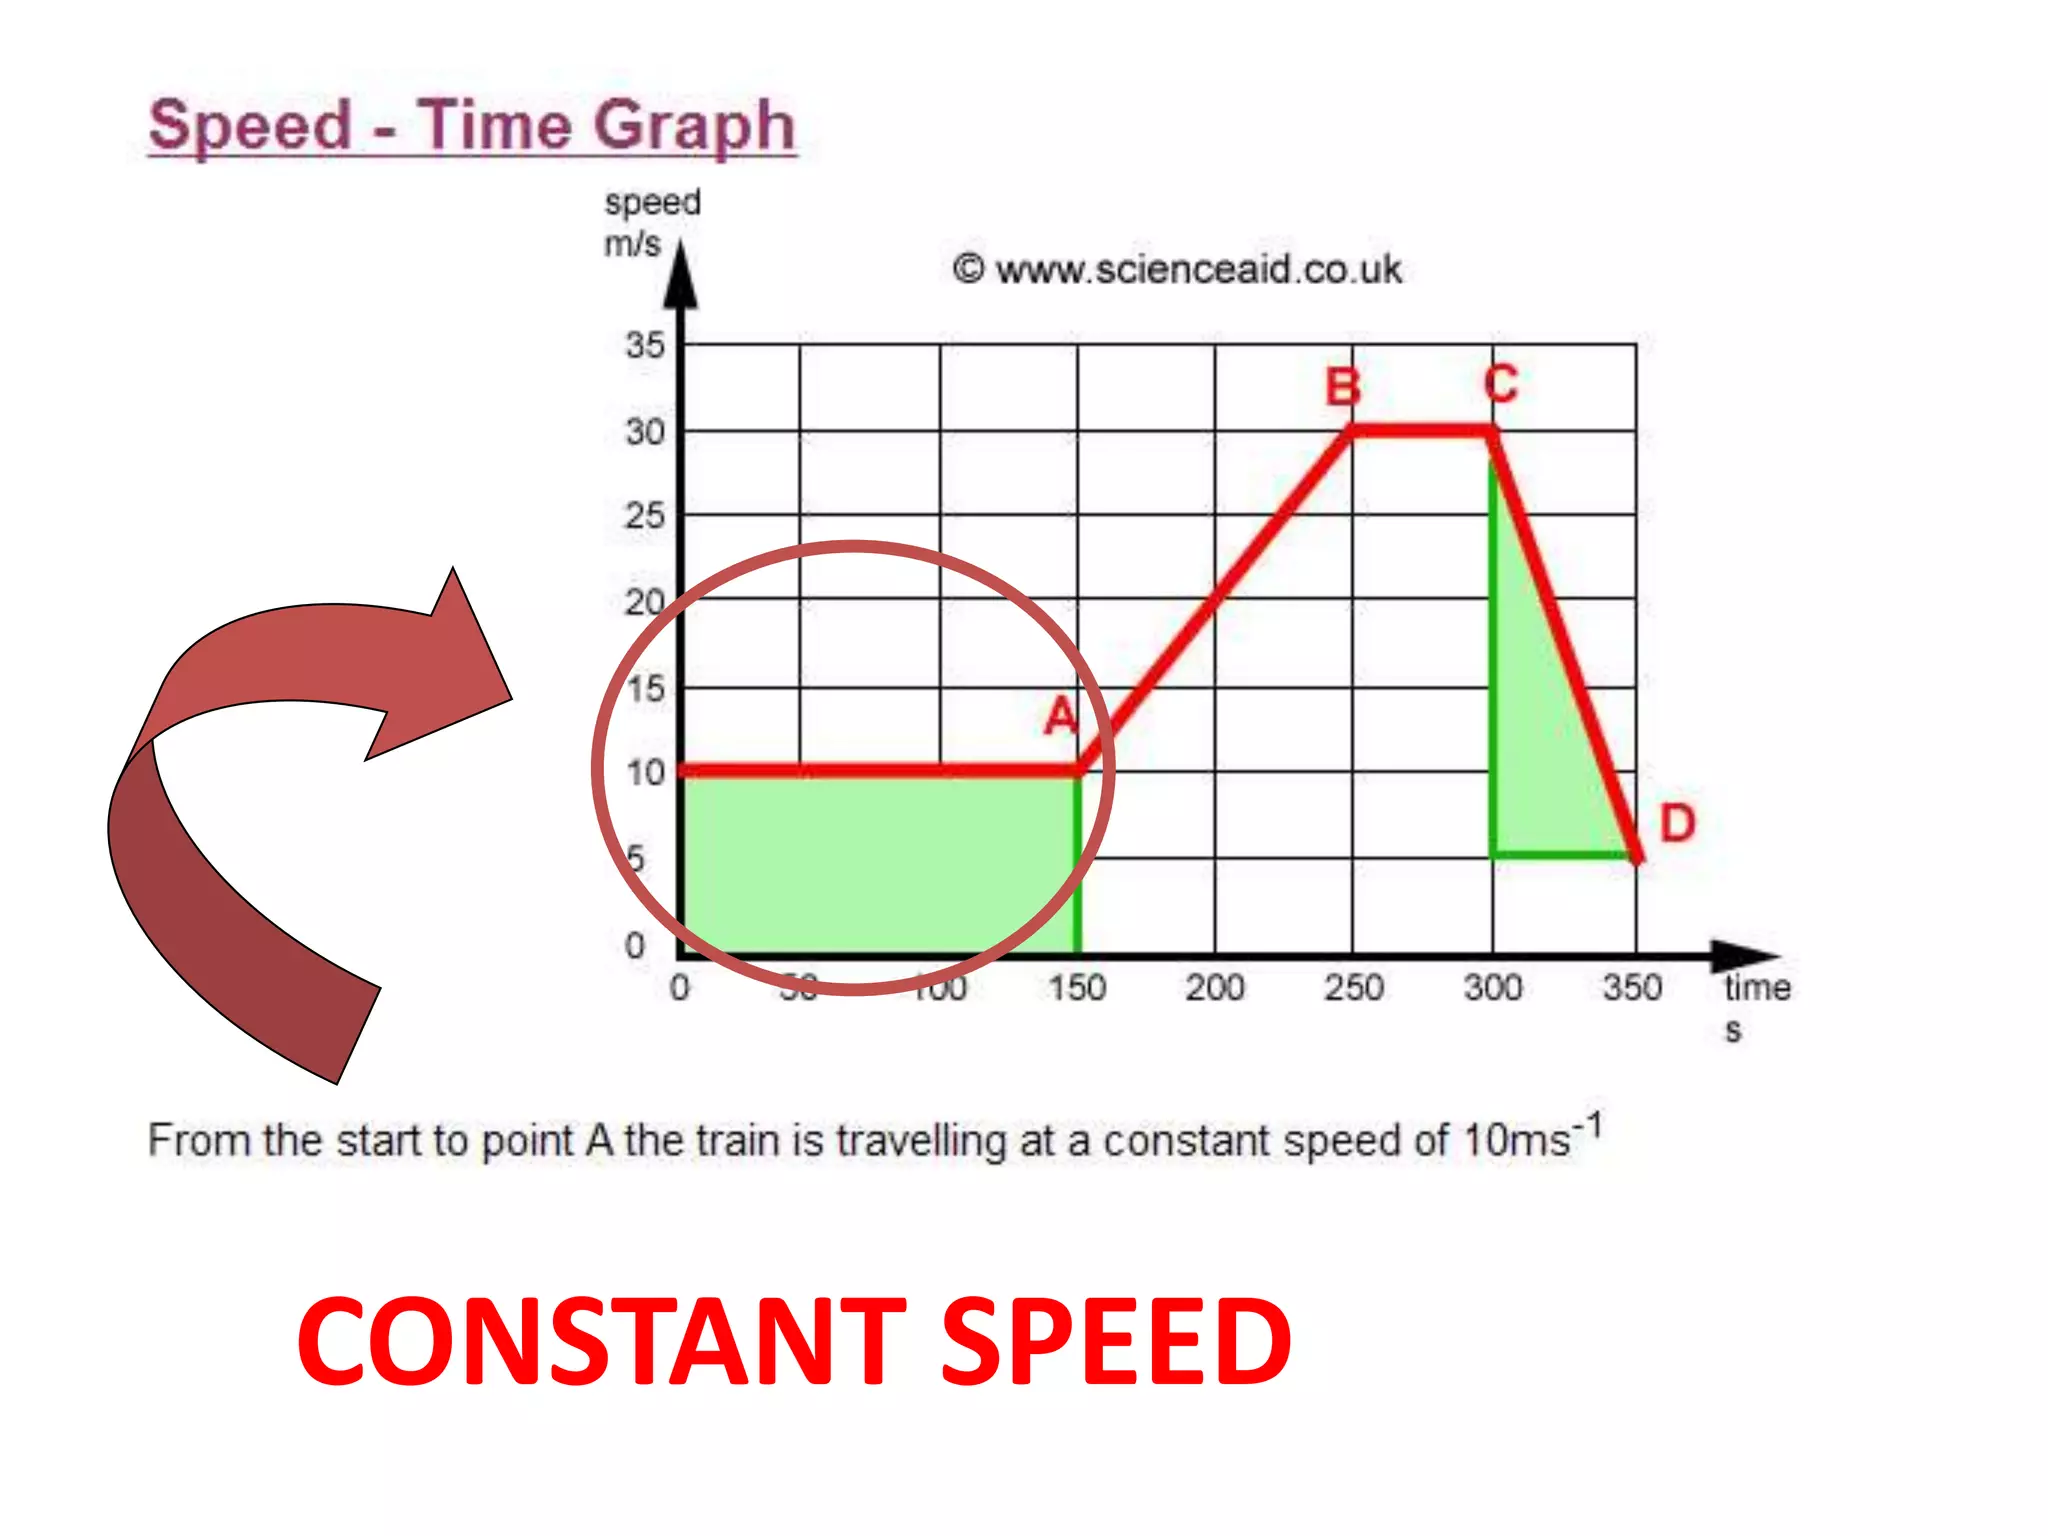
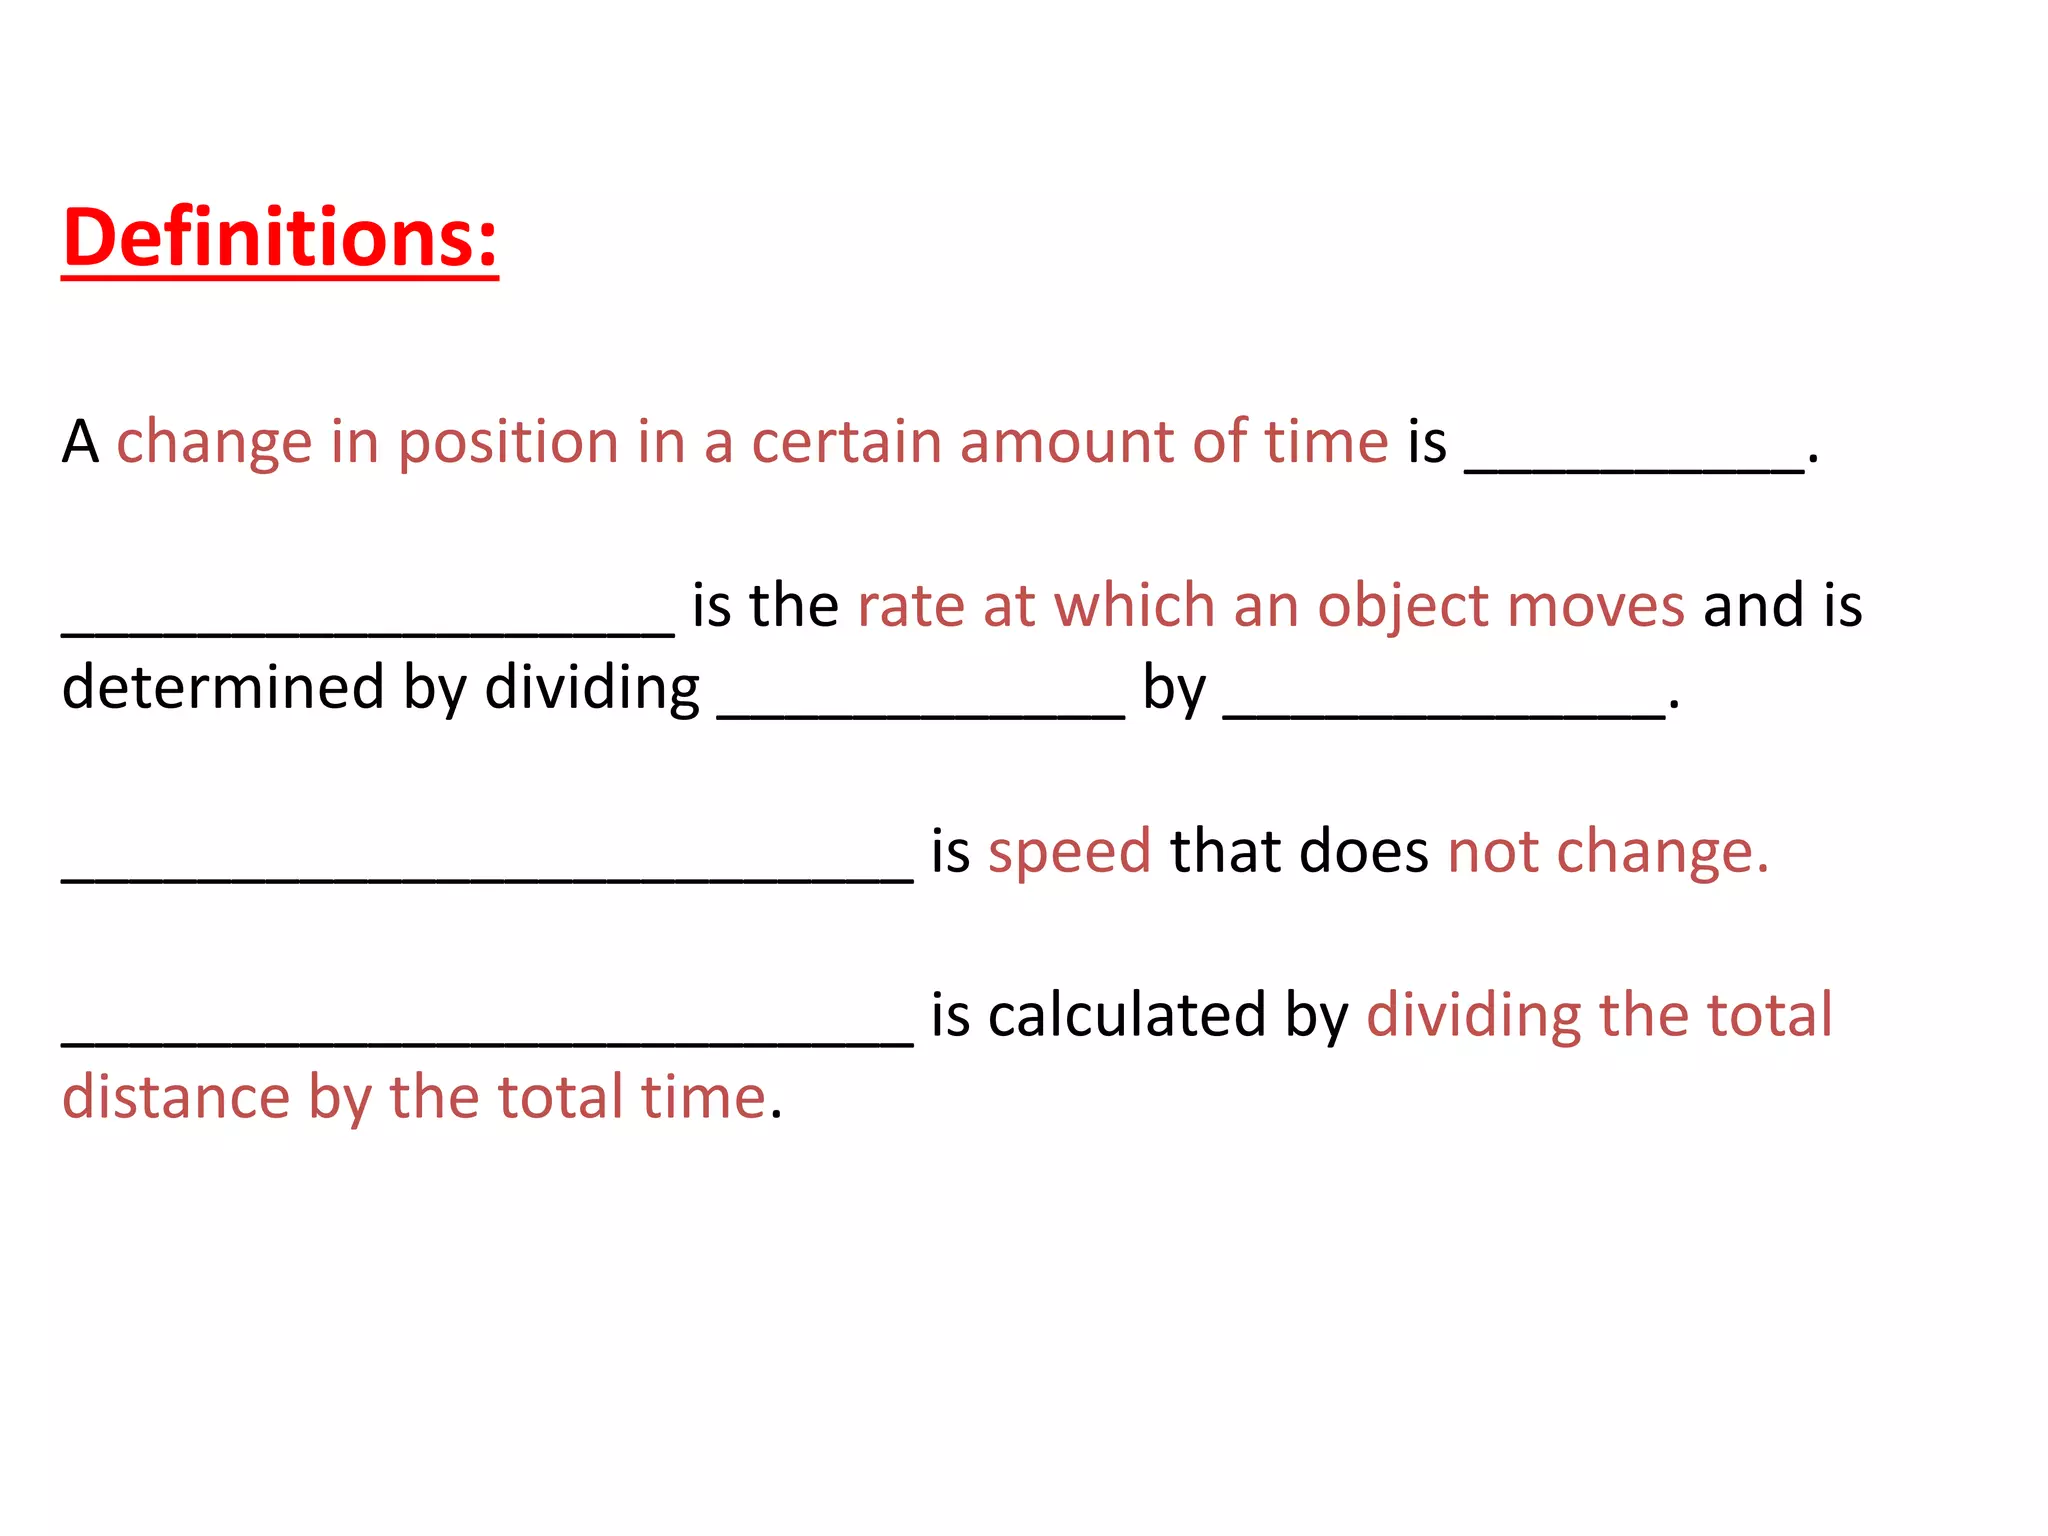
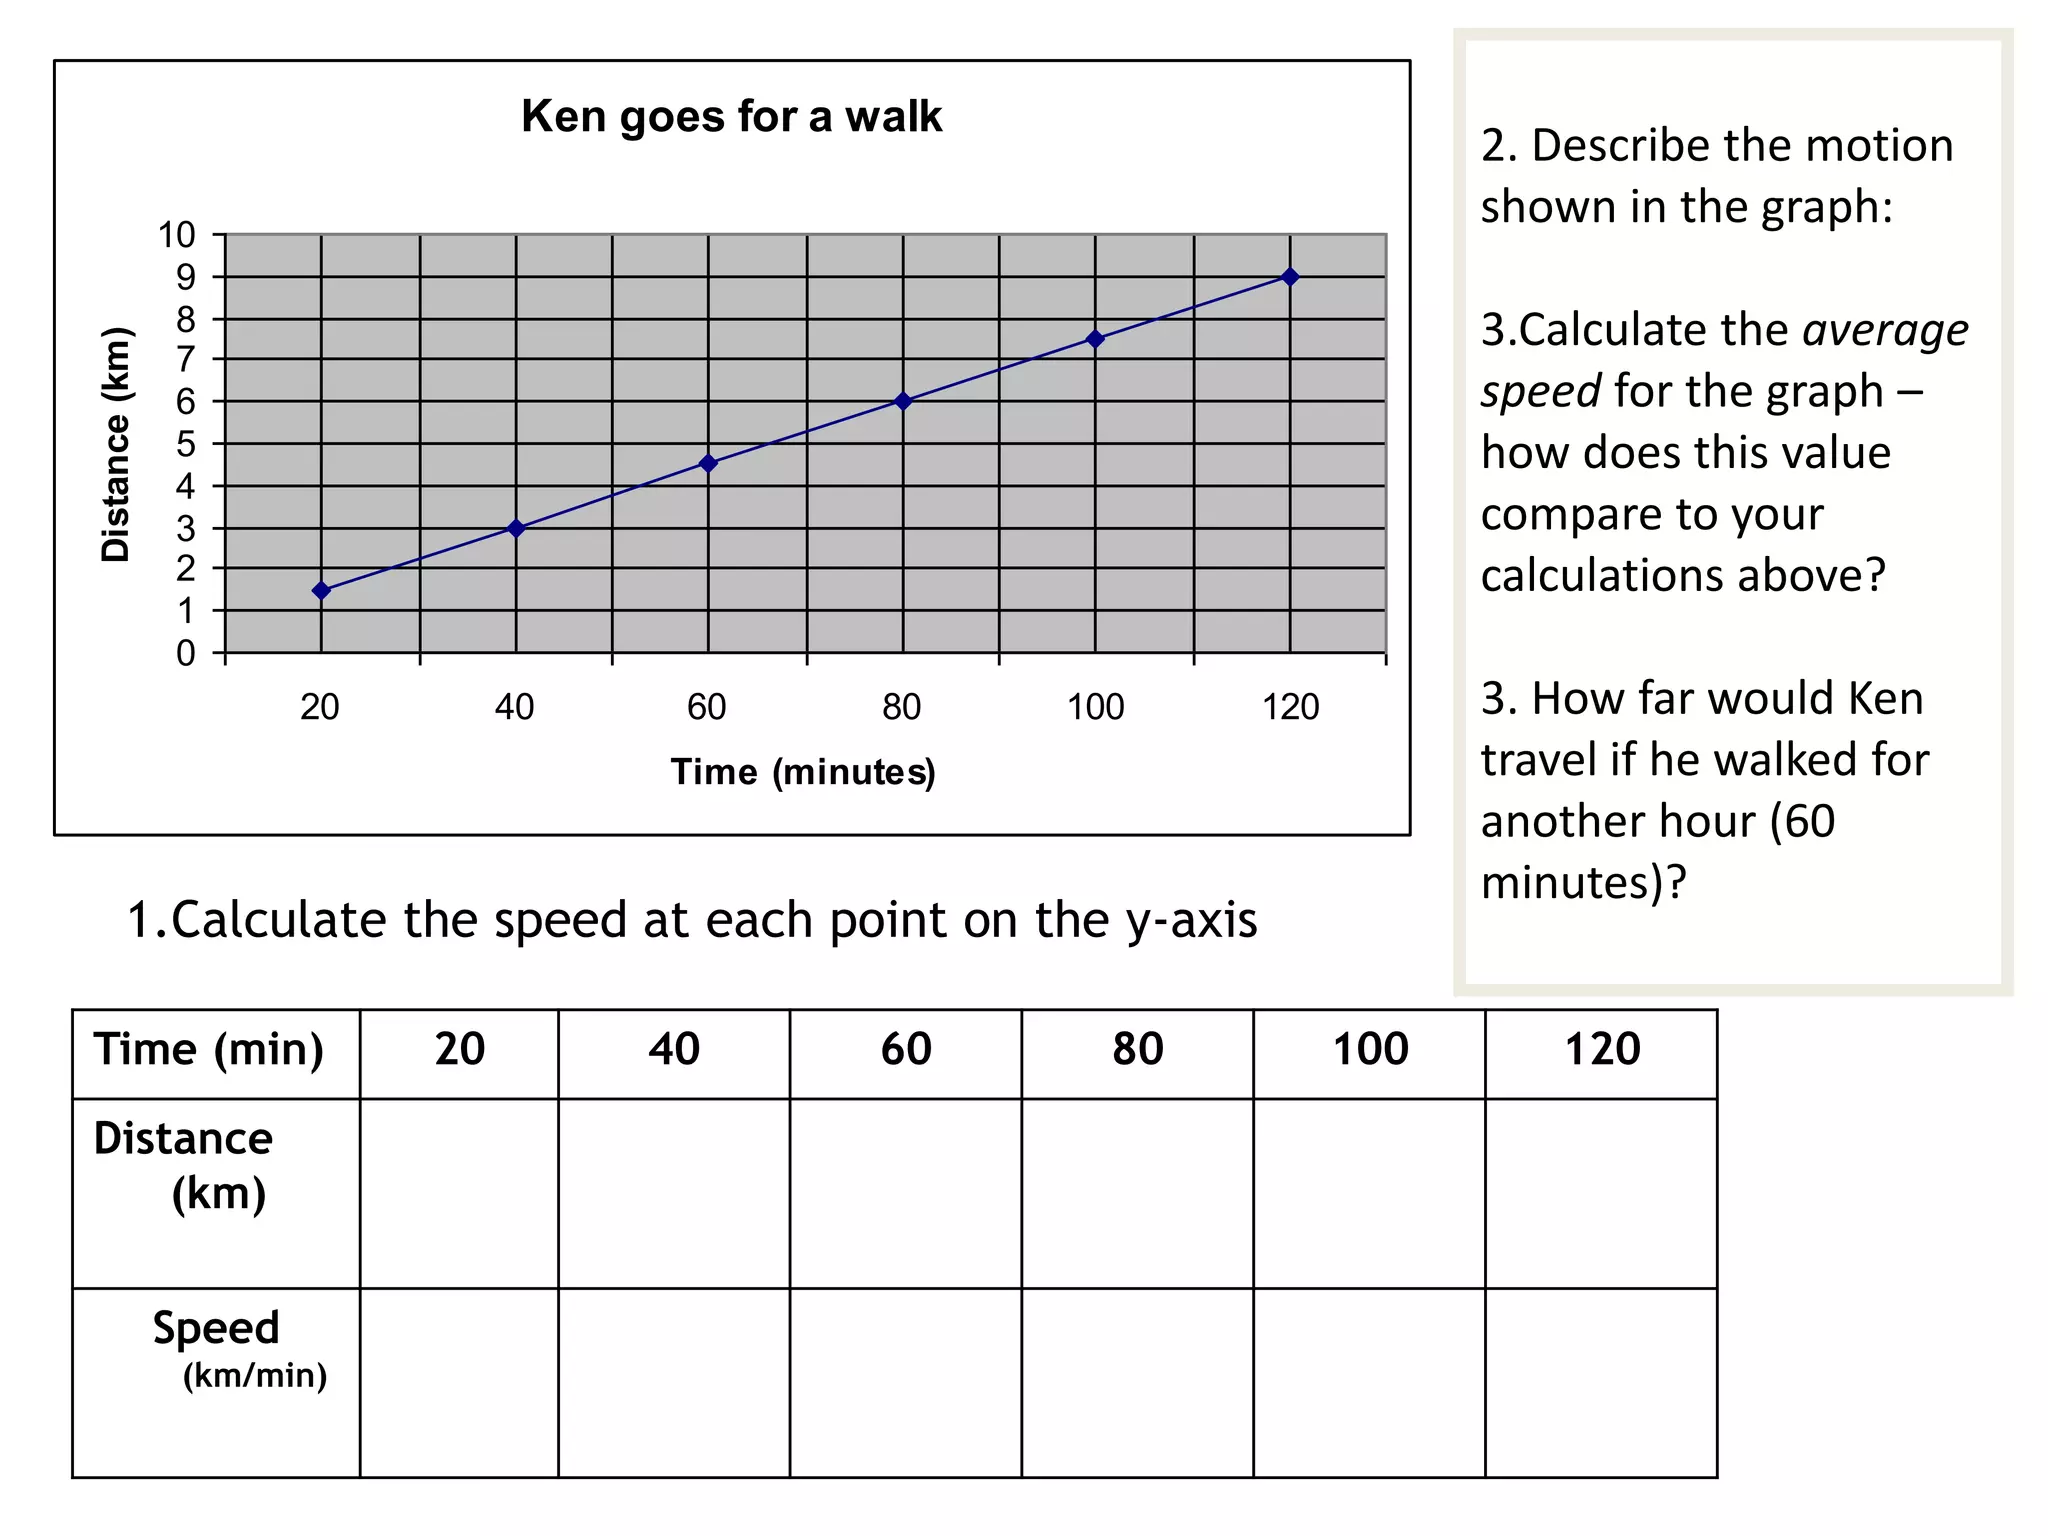
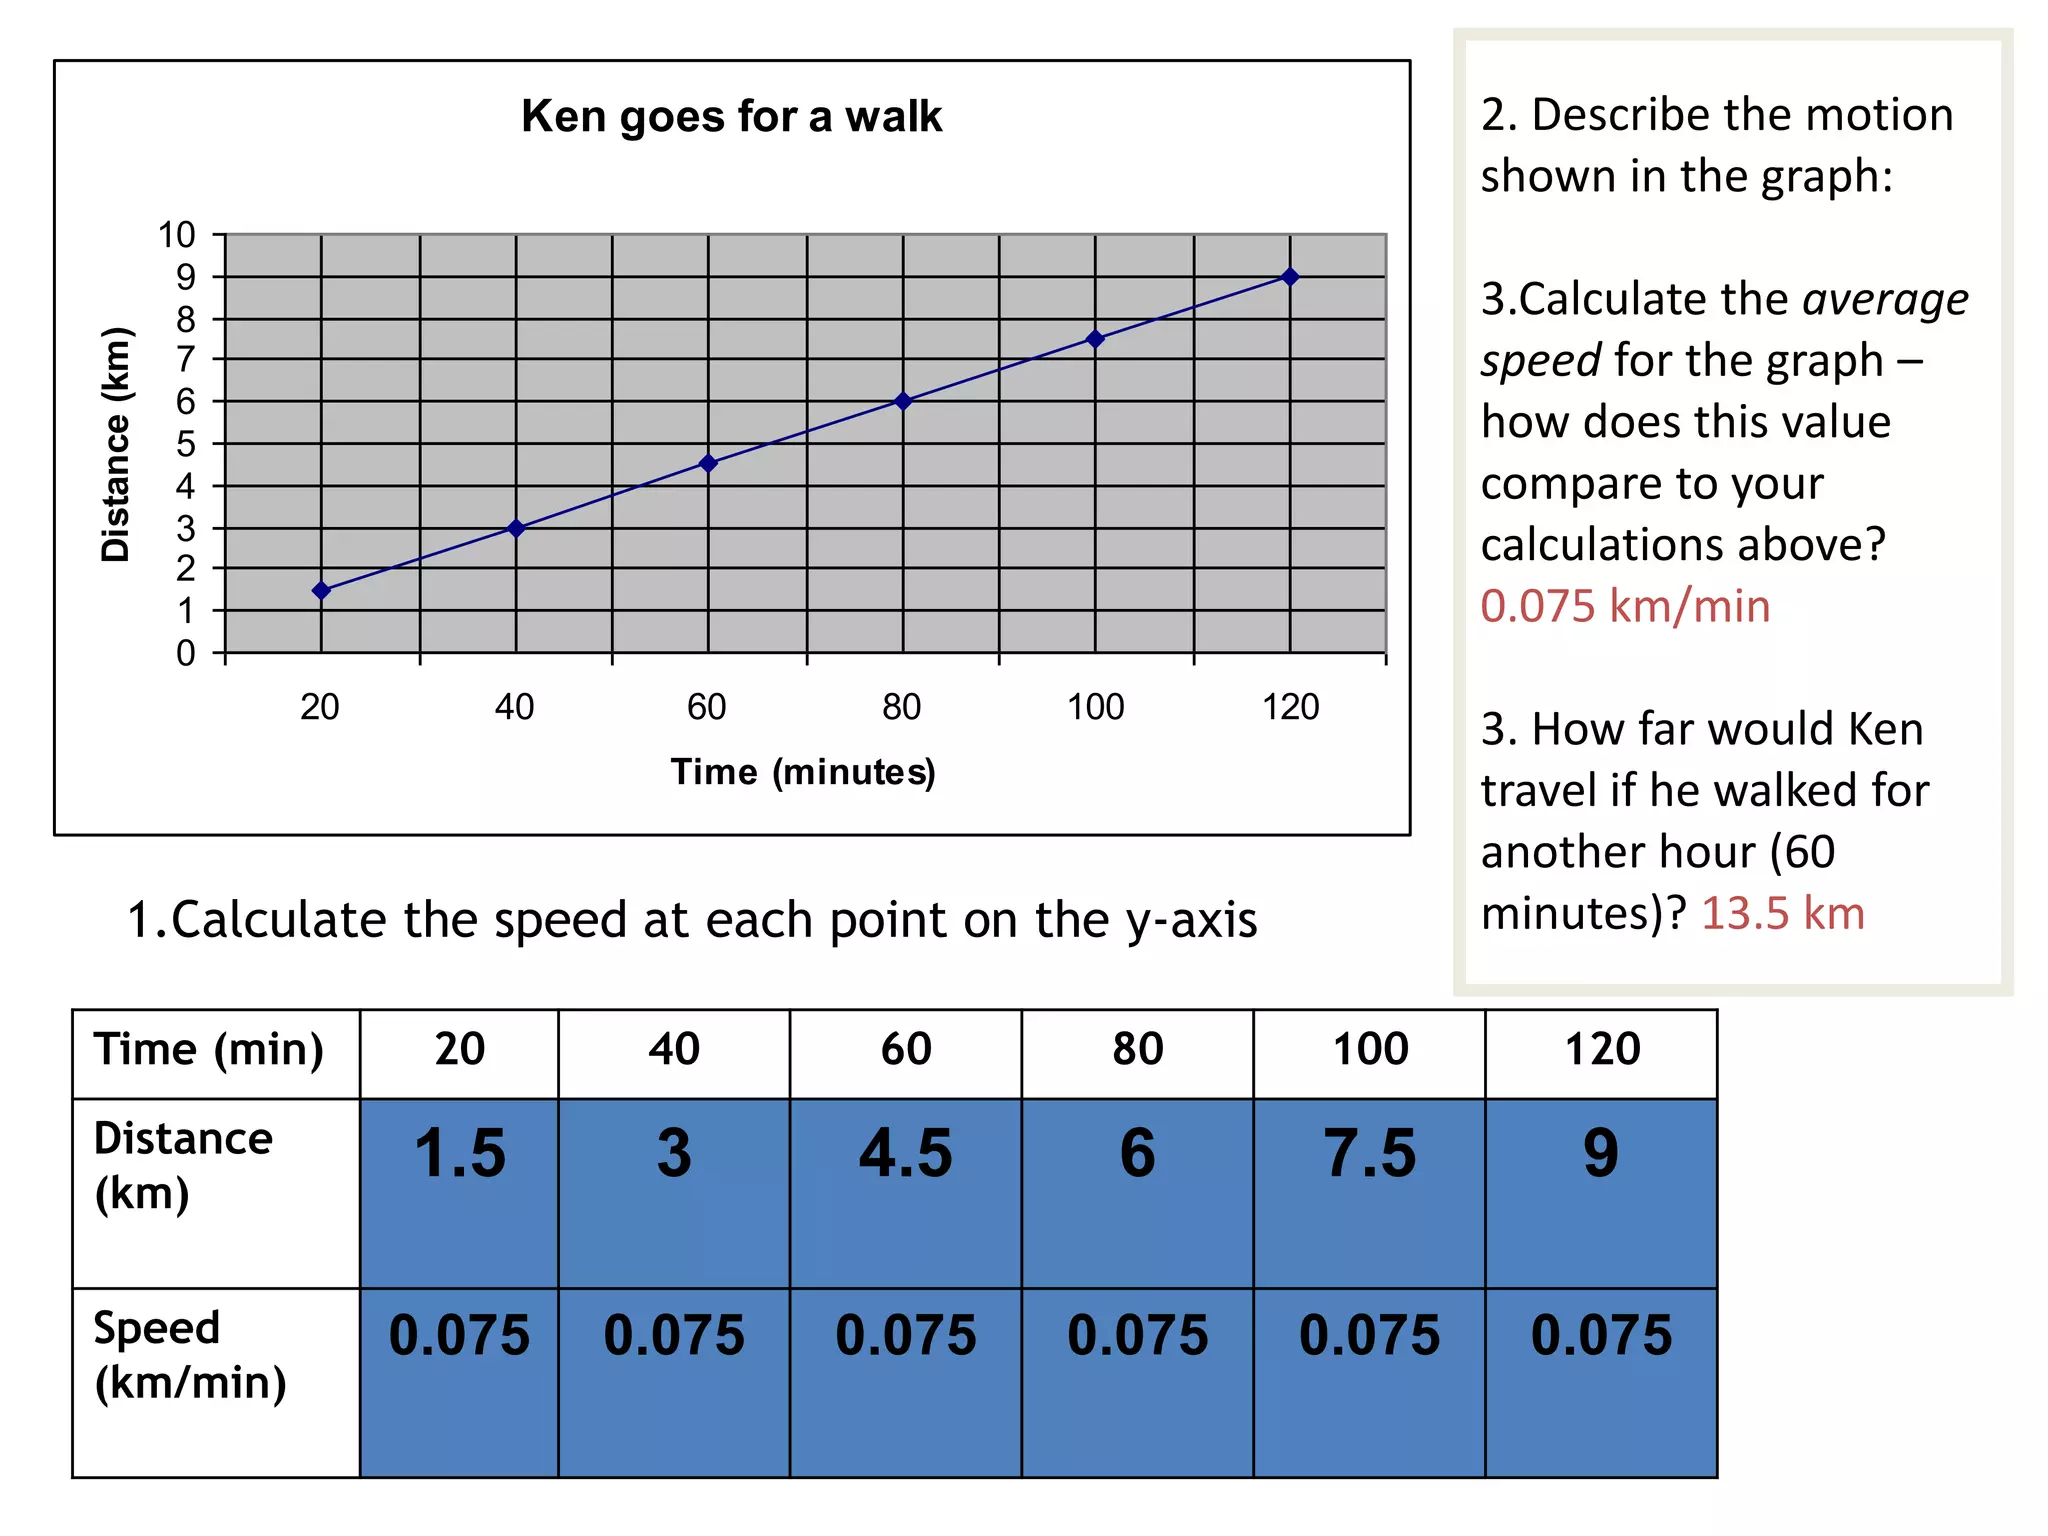
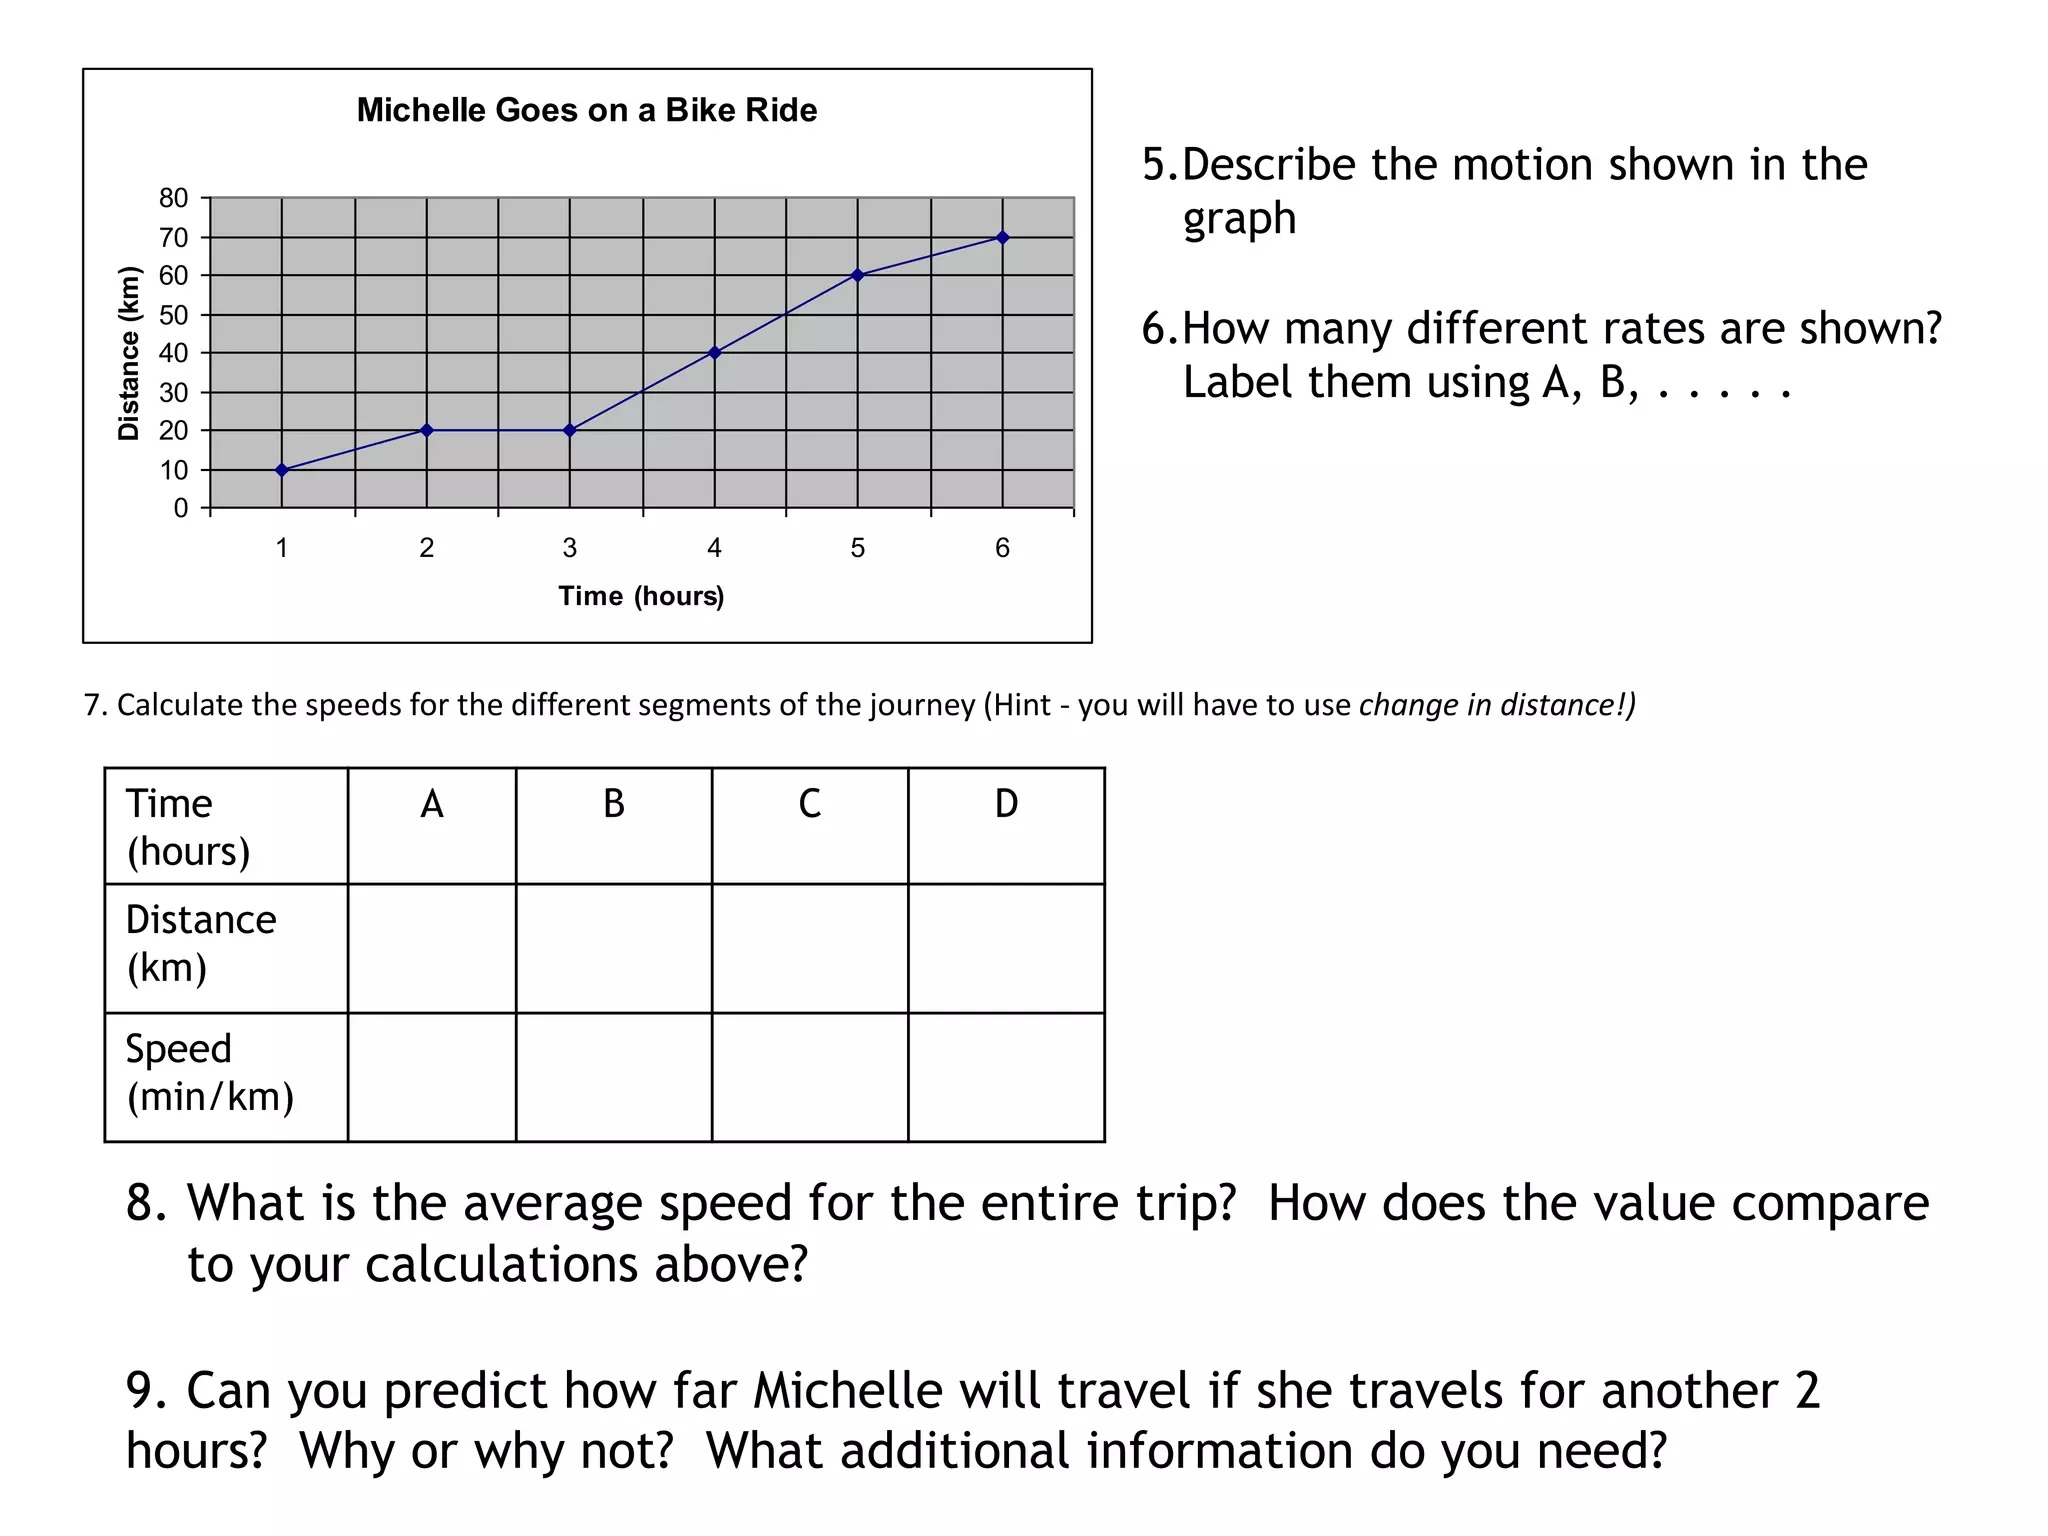
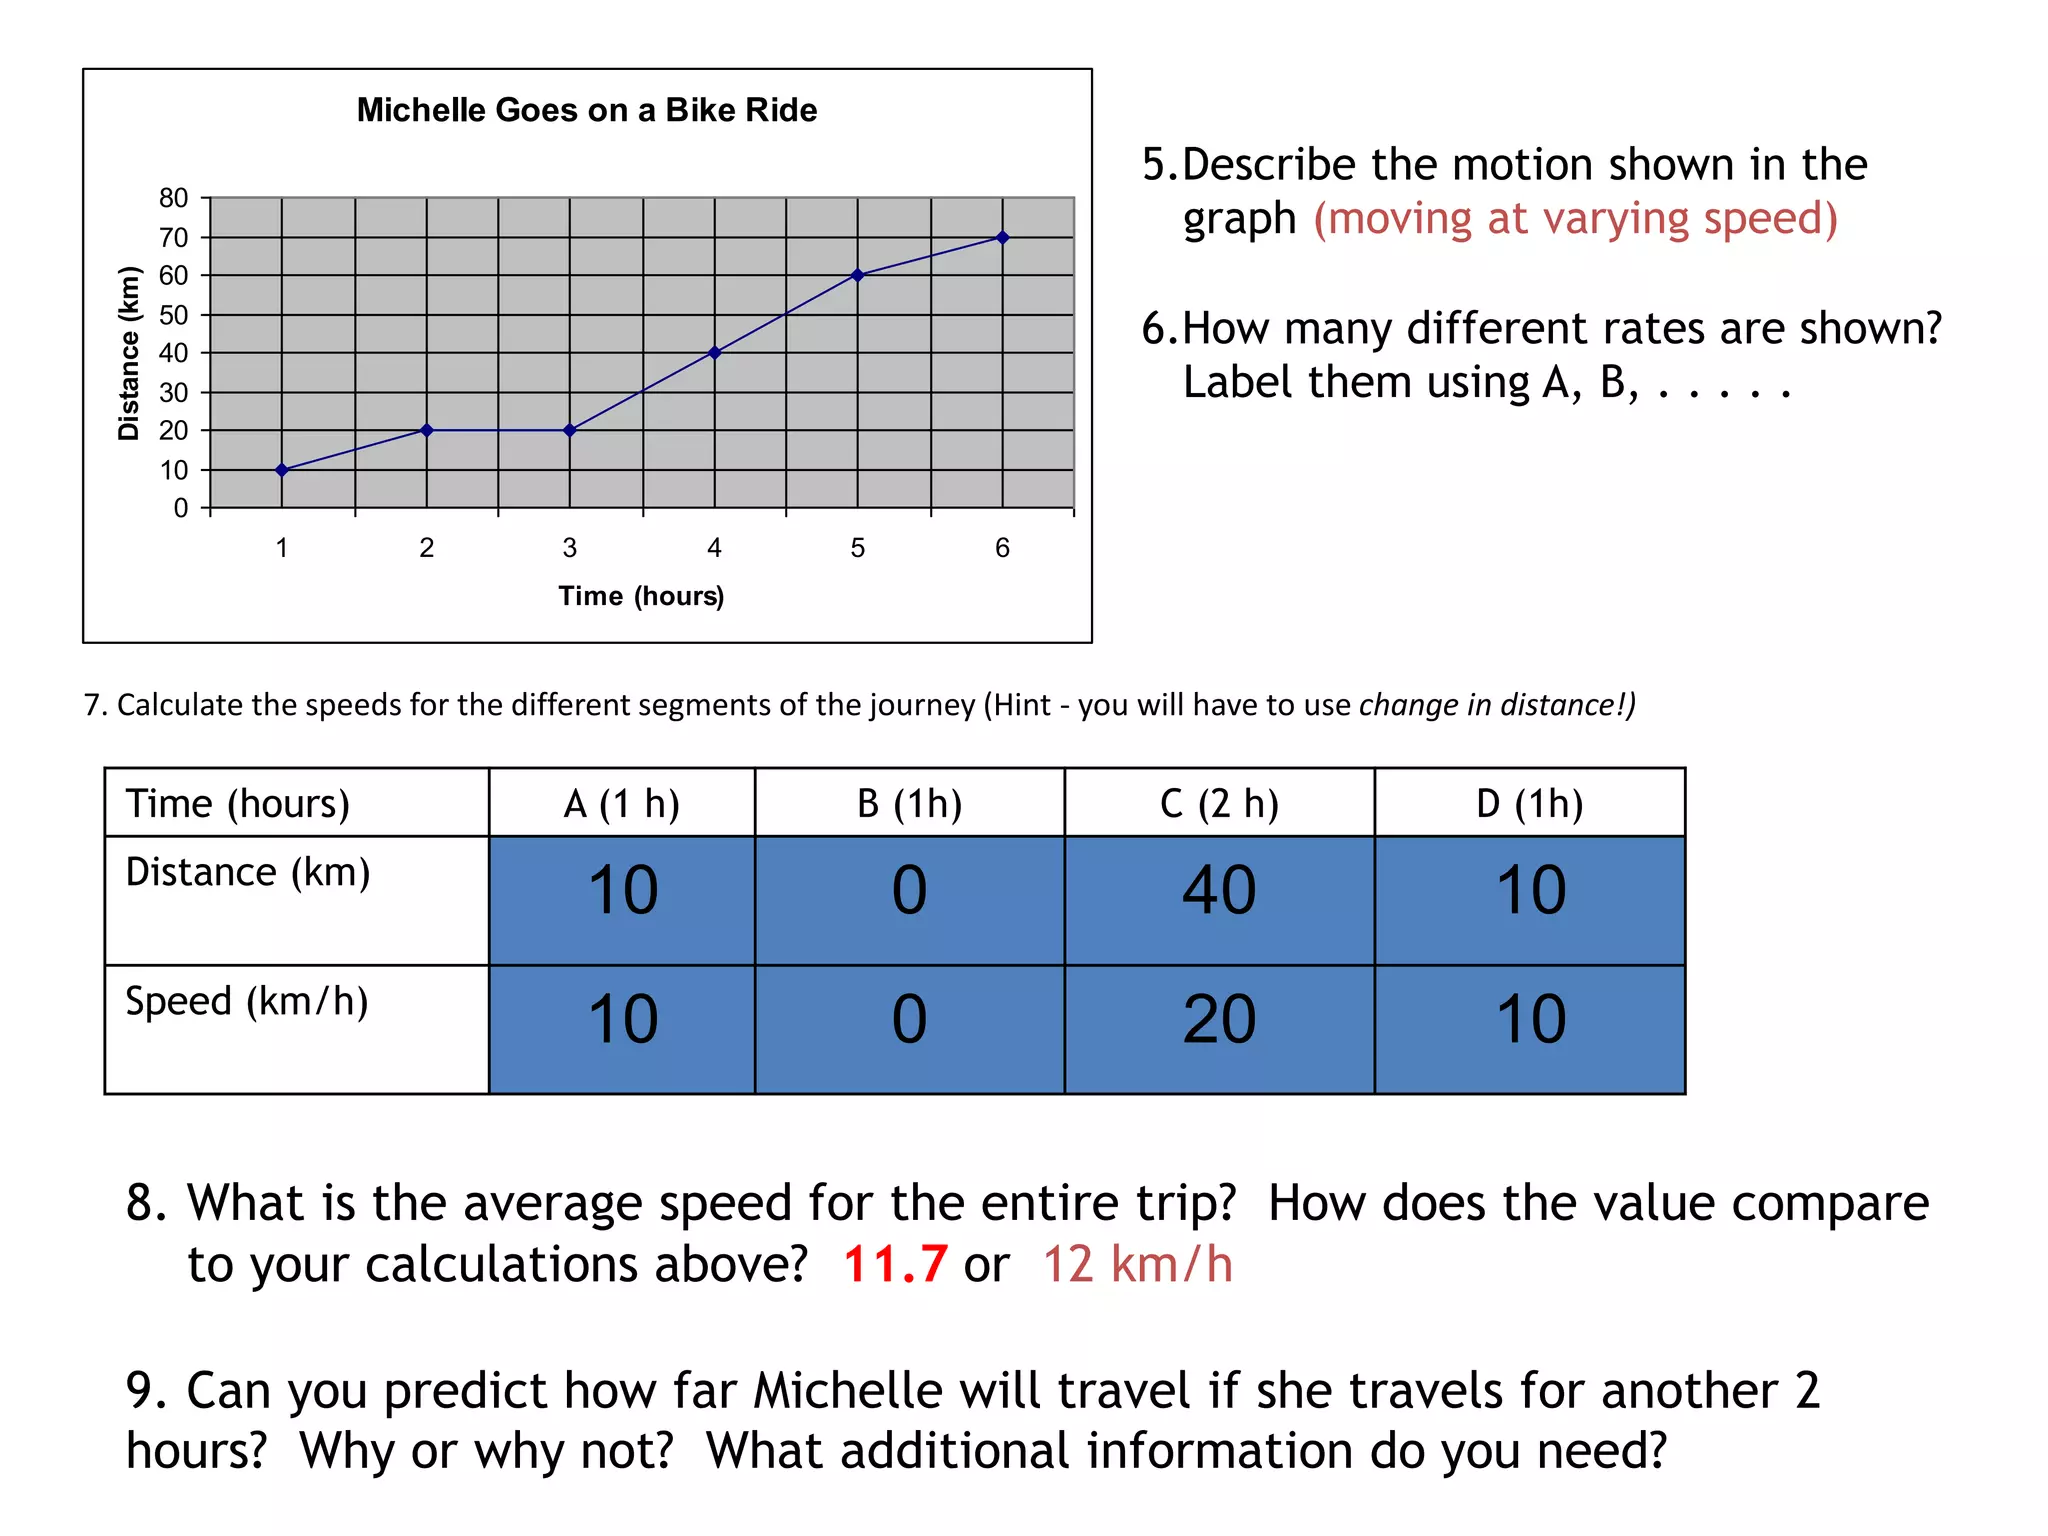
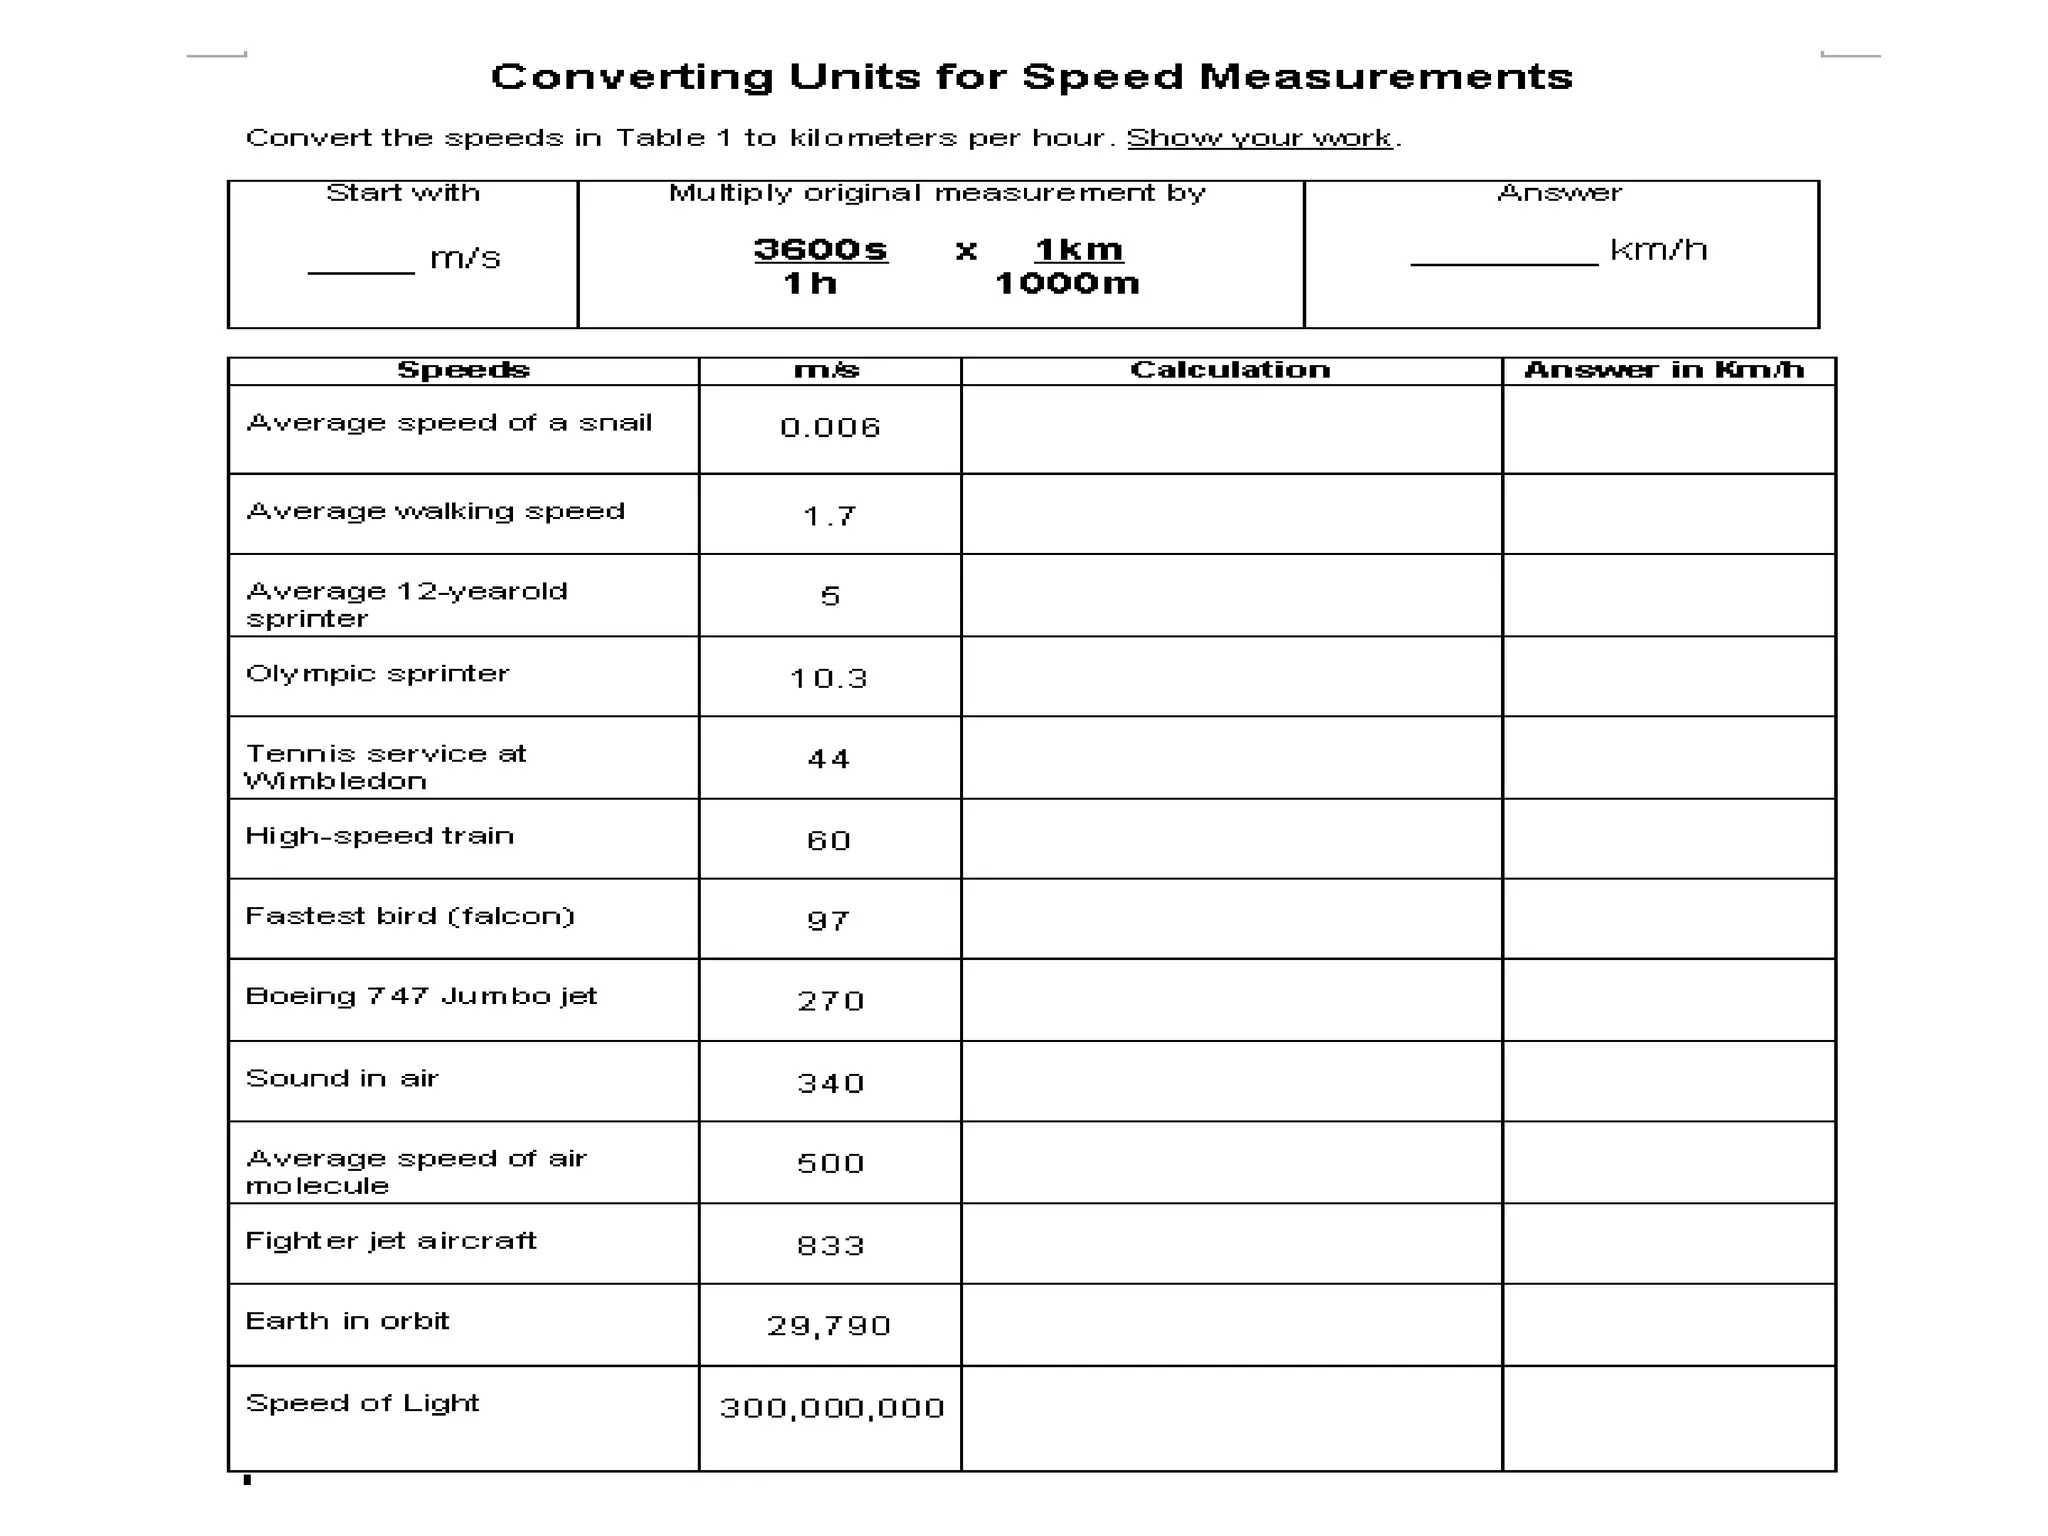
Constant Versus Average Speed
Ant #1 crawled 12 inches
in 1 second.
Ant #2 crawled 24 inches
in 1 second.
Compare the speed of the ants- which one
is faster? How does the distance compare?
DIRECTLY PROPORTIONAL
TO DISTANCE
Greater speed (faster)= more distance
Less speed (slower) = less distance
The top plane flew 220
meters in 1 second.
A bottom plane flew
220 meters in 2 seconds.
Compare their speeds-which plane
is faster? How do the times compare?
SPEED IS….
Inversely Proportional to
TIME
Greater speed, less time
Less speed, more time
CONSTANT SPEED
SPEED
THAT
DOES
NOT
CHANGE
CONSTANT
SPEED
AVERAGE SPEED
AVERAGE = total distance traveled
SPEED total time
AVERAGE SPEED
AVERAGE SPEED
A car travels 32 km during the first
2 hours. Then it travels 13 km in
the next hour. What is the average
speed of the car?
ANSWER: Avg speed= total distance/total time
total distance = 32 km + 13 km = 45 km
total time = 2 h + 1h = 3 hr
Avg speed = 45 km/3 hr
Avg speed = 15 km/hr
CONSTANT SPEED
Definitions:
A change in position in a certain amount of time is __________.
__________________ is the rate at which an object moves and is
determined by dividing ____________ by _____________.
_________________________ is speed that does not change.
_________________________ is calculated by dividing the total
distance by the total time.
SPEED
WORKSHEET
Complete for homework
Ken goes for a walk
0
1
2
3
4
5
6
7
8
9
10
20 40 60 80 100 120
Time (minutes)
Distance(km)
1.Calculate the speed at each point on the y-axis
Time (min) 20 40 60 80 100 120
Distance
(km)
Speed
(km/min)
2. Describe the motion
shown in the graph:
3.Calculate the average
speed for the graph –
how does this value
compare to your
calculations above?
3. How far would Ken
travel if he walked for
another hour (60
minutes)?
Ken goes for a walk
0
1
2
3
4
5
6
7
8
9
10
20 40 60 80 100 120
Time (minutes)
Distance(km)
1.Calculate the speed at each point on the y-axis
Time (min) 20 40 60 80 100 120
Distance
(km)
1.5 3 4.5 6 7.5 9
Speed
(km/min)
0.075 0.075 0.075 0.075 0.075 0.075
2. Describe the motion
shown in the graph:
3.Calculate the average
speed for the graph –
how does this value
compare to your
calculations above?
0.075 km/min
3. How far would Ken
travel if he walked for
another hour (60
minutes)? 13.5 km
Michelle Goes on a Bike Ride
0
10
20
30
40
50
60
70
80
1 2 3 4 5 6
Time (hours)
Distance(km)
5.Describe the motion shown in the
graph
6.How many different rates are shown?
Label them using A, B, . . . . .
Time
(hours)
A B C D
Distance
(km)
Speed
(min/km)
8. What is the average speed for the entire trip? How does the value compare
to your calculations above?
9. Can you predict how far Michelle will travel if she travels for another 2
hours? Why or why not? What additional information do you need?
7. Calculate the speeds for the different segments of the journey (Hint - you will have to use change in distance!)
Michelle Goes on a Bike Ride
0
10
20
30
40
50
60
70
80
1 2 3 4 5 6
Time (hours)
Distance(km)
5.Describe the motion shown in the
graph (moving at varying speed)
6.How many different rates are shown?
Label them using A, B, . . . . .
Time (hours) A (1 h) B (1h) C (2 h) D (1h)
Distance (km)
10 0 40 10
Speed (km/h)
10 0 20 10
8. What is the average speed for the entire trip? How does the value compare
to your calculations above? 11.7 or 12 km/h
9. Can you predict how far Michelle will travel if she travels for another 2
hours? Why or why not? What additional information do you need?
7. Calculate the speeds for the different segments of the journey (Hint - you will have to use change in distance!)
Constant vs Average speed

Constant vs Average speed

  • 1.
  • 2.
    Ant #1 crawled12 inches in 1 second. Ant #2 crawled 24 inches in 1 second. Compare the speed of the ants- which one is faster? How does the distance compare?
  • 3.
    DIRECTLY PROPORTIONAL TO DISTANCE Greaterspeed (faster)= more distance Less speed (slower) = less distance
  • 4.
    The top planeflew 220 meters in 1 second. A bottom plane flew 220 meters in 2 seconds. Compare their speeds-which plane is faster? How do the times compare?
  • 5.
    SPEED IS…. Inversely Proportionalto TIME Greater speed, less time Less speed, more time
  • 6.
  • 7.
  • 8.
    AVERAGE SPEED AVERAGE =total distance traveled SPEED total time
  • 9.
  • 10.
  • 11.
    A car travels32 km during the first 2 hours. Then it travels 13 km in the next hour. What is the average speed of the car? ANSWER: Avg speed= total distance/total time total distance = 32 km + 13 km = 45 km total time = 2 h + 1h = 3 hr Avg speed = 45 km/3 hr Avg speed = 15 km/hr
  • 12.
  • 13.
    Definitions: A change inposition in a certain amount of time is __________. __________________ is the rate at which an object moves and is determined by dividing ____________ by _____________. _________________________ is speed that does not change. _________________________ is calculated by dividing the total distance by the total time.
  • 15.
  • 16.
    Ken goes fora walk 0 1 2 3 4 5 6 7 8 9 10 20 40 60 80 100 120 Time (minutes) Distance(km) 1.Calculate the speed at each point on the y-axis Time (min) 20 40 60 80 100 120 Distance (km) Speed (km/min) 2. Describe the motion shown in the graph: 3.Calculate the average speed for the graph – how does this value compare to your calculations above? 3. How far would Ken travel if he walked for another hour (60 minutes)?
  • 17.
    Ken goes fora walk 0 1 2 3 4 5 6 7 8 9 10 20 40 60 80 100 120 Time (minutes) Distance(km) 1.Calculate the speed at each point on the y-axis Time (min) 20 40 60 80 100 120 Distance (km) 1.5 3 4.5 6 7.5 9 Speed (km/min) 0.075 0.075 0.075 0.075 0.075 0.075 2. Describe the motion shown in the graph: 3.Calculate the average speed for the graph – how does this value compare to your calculations above? 0.075 km/min 3. How far would Ken travel if he walked for another hour (60 minutes)? 13.5 km
  • 18.
    Michelle Goes ona Bike Ride 0 10 20 30 40 50 60 70 80 1 2 3 4 5 6 Time (hours) Distance(km) 5.Describe the motion shown in the graph 6.How many different rates are shown? Label them using A, B, . . . . . Time (hours) A B C D Distance (km) Speed (min/km) 8. What is the average speed for the entire trip? How does the value compare to your calculations above? 9. Can you predict how far Michelle will travel if she travels for another 2 hours? Why or why not? What additional information do you need? 7. Calculate the speeds for the different segments of the journey (Hint - you will have to use change in distance!)
  • 19.
    Michelle Goes ona Bike Ride 0 10 20 30 40 50 60 70 80 1 2 3 4 5 6 Time (hours) Distance(km) 5.Describe the motion shown in the graph (moving at varying speed) 6.How many different rates are shown? Label them using A, B, . . . . . Time (hours) A (1 h) B (1h) C (2 h) D (1h) Distance (km) 10 0 40 10 Speed (km/h) 10 0 20 10 8. What is the average speed for the entire trip? How does the value compare to your calculations above? 11.7 or 12 km/h 9. Can you predict how far Michelle will travel if she travels for another 2 hours? Why or why not? What additional information do you need? 7. Calculate the speeds for the different segments of the journey (Hint - you will have to use change in distance!)