Downloaded 144 times


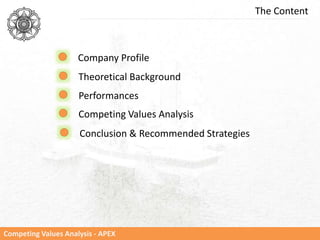


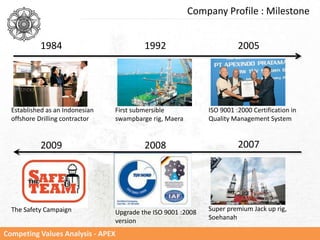
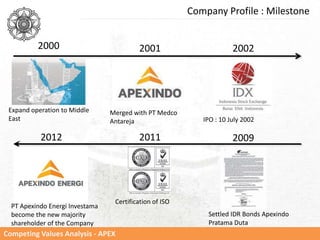

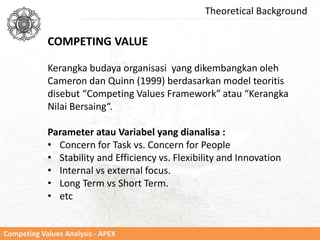
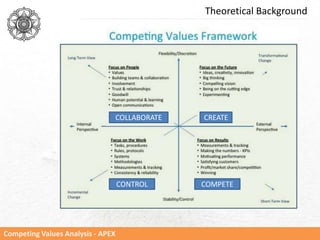
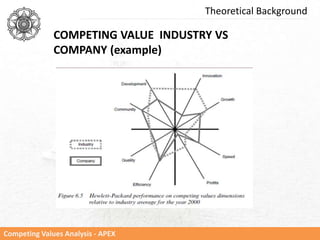

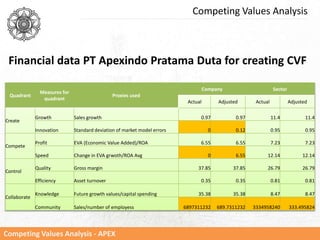
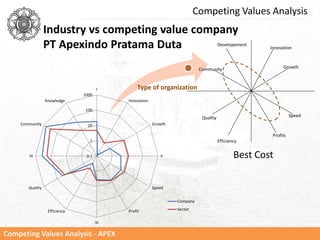

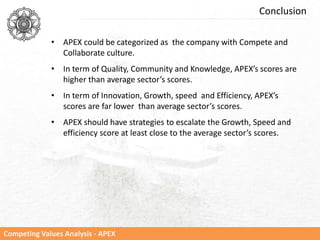
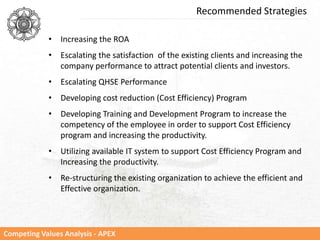
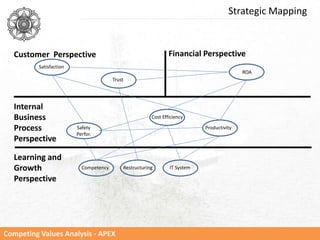
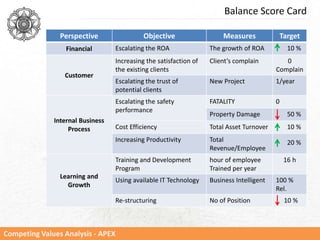


This document provides a summary of a case study analysis of PT Apexindo Pratama Duta using the Competing Values Framework. It includes a company profile, theoretical background on the Competing Values Framework, an analysis of the company's performance, a Competing Values analysis mapping the company, and recommendations. The analysis found that Apexindo's culture is focused on Compete and Collaborate. It recommends strategies to increase innovation, growth, and efficiency scores, such as improving ROA, costs, productivity, competency, and restructuring.