Download to read offline
![© 2023, IRJET | Impact Factor value: 8.226 | ISO 9001:2008 Certified Journal | Page 50
Predicting Flood Impacts: Analyzing Flood Dataset using Machine
Learning Algorithms
Naga Ravindra Babu M1, B Naresh2, A Satya Vamsi Kumar3, G Ganga Bhavani4, A Sai Ram5,G
Chakradhara Rao6
1Assoc. Prof., Dept. of Computer Science, B V Raju College, Bhimavaram, AP, India
2Assoc. Prof., Dept. of Computer Science, B V Raju College, Bhimavaram, AP, India
3Asst. Prof., Dept. of Computer Science, B V Raju College, Bhimavaram, AP, India
4Asst. Prof., Dept. of Computer Science, B V Raju College, Bhimavaram, AP, India
5Asst. Prof., Dept. of Computer Science, B V Raju College, Bhimavaram, AP, India
6Asst. Prof., Dept. of Computer Science, B V Raju College, Bhimavaram, AP, India
---------------------------------------------------------------------***---------------------------------------------------------------------
Abstract - Floods are one of the most destructive and
challenging to anticipate natural catastrophes. Thefrequency
or severity of floods has grown in recent years due to climate
change and urbanization, as have the associatedfatalitiesand
financial losses. Machine learning-based flood forecasting
models have slowly started to appear as a result of the fast
expansion of computing power. Richinformation isincludedin
these models since they were trained on historical data, which
is advantageous for data analysis and use. Machine-learning-
based models are more effective than the conventional
physical flood forecastingmodelinachievingsatisfyingresults.
This study provides a summary of contemporary machine
learning-based flood prediction techniquestoillustraterecent
developments in flood forecasting.
We list a range of current works in flood prediction and
construct the model based on several methodologies.
For flood warnings, flood reduction, or flood prevention,
machine learning (ML) models are useful. Machine-learning
(ML) addresses have become more well-liked in this regard
because to their minimal computing demands and
predominance of observational data.
Key Words: Flood, human injure, urbanization, Random
Forest, Support Vector, Neural Network etc.
1.INTRODUCTION
The number of natural and man-made disasters has grown
globally in recent years. The most common natural
catastrophe is a flood, which happens when an excess of
water submerges normally dry ground. Floods are typically
caused by protracted periods of intense rain, rapid
snowmelt, storm surges from tropical cyclones, or tsunamis
in coastal areas.
Floods may wreak havoc across a large area, causing
fatalities as well as damage to private property and vital
public health facilities. Worldwide, more than 2 billion
people were impacted by floods between 1998 and 2017.
Most at risk from floods are those who reside in floodplains,
in non-flood proof structures, lack access to warning
systems, or are unaware of the risk of flooding [1].
75% of those who pass away in flood catastrophes drown.
Disasters caused by flooding are occurring increasingly
often, and this tendency is predicted to continue. Flooding
increases the danger of drowning, especially in low- and
middle-income nations where residents live in flood-prone
locations and flood warning, evacuation, and protection
systems are still underdeveloped or insufficient [2].
2. LITERATURE SURVEY
The author of this research analyzed several machine
learning-based flood forecasting systems, including linear
regression, decision trees, and SVM-based approaches, as
well as deep learning-based algorithms like BP and LSTM
models. The study shows that the applicability of various
approaches varies. Furthermore, since the most recent
algorithmsarelargelyinfluencedbythesophisticatedmodels
in deep learning, this paper's conclusion from the current
research is that the advancementofdeeplearningtechnology
has a significant impact on further improving the accuracyof
flood prediction performance [3].
Based on historical rainfall datasets spanning 33 years, the
goal of this project was to develop a machine learning model
that can forecast floods in Kebbi state so that it may be
applied to other Nigerian states with high flood risk. In this
study, three machine learning algorithms—Decision Tree,
Logistic Regression, and Support Vector Classification
(SVR)—were assessed and their Accuracy, Recall, and
Receiver Operating Characteristics (ROC) scores were
compared. Whencomparedtotheothertwomethods,logistic
regression yields more accuratefindings and offersexcellent
performance accuracy and recall. The Decision Tree fared
better than the Support Vector Classifier as well. Due to
Decision Tree's above-average accuracy and below-average
recall ratings, it did pretty well [4].
This study introduces an innovative method for using the
ensemble model to estimate water level in relation to flood
International Research Journal of Engineering and Technology (IRJET) e-ISSN: 2395-0056
Volume: 10 Issue: 07 | Jul 2023 www.irjet.net p-ISSN: 2395-0072](https://image.slidesharecdn.com/irjet-v10i709-230815101725-3a53321d/85/Predicting-Flood-Impacts-Analyzing-Flood-Dataset-using-Machine-Learning-Algorithms-1-320.jpg)
![International Research Journal of Engineering and Technology (IRJET) e-ISSN: 2395-0056
Volume: 10 Issue: 07 | Jul 2023 www.irjet.net p-ISSN: 2395-0072
© 2023, IRJET | Impact Factor value: 8.226 | ISO 9001:2008 Certified Journal | Page 51
severity. Our method makes advantage of the most recent
advancements in machinelearningandtheInternetofThings
(IoT) to automate the analysis of flood data that might be
valuable in the mitigation ofnatural catastrophes. According
to research findings, ensemble learning is a more accurate
method of predicting the severity of flooding. With
sensitivity, specificity, and accuracy of 71.4%, 85.9%, and
81.13%, respectively, the experimental findings show that
ensemble learning utilising the Long-Short Term Memory
model and random forest outperformed individual models
[5].
The various model architectures and their performances are
shown in this research. Based on IoT data and weather
forecasts, machine learning models using deep learning
neural networks have been constructed to identify potential
risks [6].
3. PROPOSED METHODOLOGY
Based on your dataset and the goal of flood prediction, here
is a proposed methodology for analyzing and predicting
flood-related outcomes using machine learning:
Training Phase: The system is trained using the data from
the data set and the correct method of model fitting.
Testing Phase: The system is given inputs before its
functionality is evaluated. It is put to the test.
Fig: 1 System Architecture of flood
3.1. TECHNOLOGIES USED:
3.1.1 Python:
For building websites and apps as well as doing data
analysis, Python is a widely-liked and approachable
programming language. We can readily reusecodethanksto
the distinctive features of this high level programming
language. Python is not limited to any one area of study and
may be used to develop a wide range of original projectsand
programmes that are dynamic and interesting. Both the
dynamic typing and garbage collection are done [7].Some of
its characteristics include simple sharing and collaboration,
free access to computer resources.
3.1.2 Google Colab
Python projects and programmes may be written and run
using Google Colab, also referred to as Collaborator. We can
perform high-level programming,data analysis,andmachine
learning algorithms thanks to it [8].
3.2 DATASET COLLECTION, PRE-PROCESSING, AND
ANALYSIS
3.2.1 Data Collection
In this paper the data is collected from Kaggle. The data set
cointains a lot of information like starting date and end date
of floods and heavy rainfall occurred. And also the data set
cointains the information about number of days rain fall,
number humans injured, number of death occurred.
3.2.2 Pre-processing of Data
Pre-processing referstochangingoreliminatingunclean and
raw data by detecting missing or unnecessary elements of
the data and subsequently. Encoding Categorical Variables
like "maincause," are encode theminto numerical valuesfor
the machine learning algorithms to understand. One
common approach is one-hot encoding, where eachcategory
is represented by a binary value (0 or 1) in separate
columns.
3.2.3 Data Analysis
In this dataset, many columns data from across India has
collected. By using these columns data it is used to predict
the human injured, human deaths, animal deaths can be
predicted. By using this data set it is analysied how many
human injured, human deaths, animal deaths can be
forecasted.
4. IMPLEMENTATION
The model is tested in this stage using the predefined
machine learning classifiers. There have been a few models
created, and their correctness has been confirmed. For this
project, we're using the four classifiers indicated below.
Decision Tree: Calculate the accuracy of the
Decision Tree model by comparing the predicted
labels to the true labels of the test data.
Additionally, you can compute metrics such as
precision, recall, and F1-score for a more
comprehensive evaluation.
Random Forest: Similar to the Decision Tree,
compute the accuracy, precision, recall, and F1-
score of the Random Forest model based on the
predictions and true labels of the test data.](https://image.slidesharecdn.com/irjet-v10i709-230815101725-3a53321d/85/Predicting-Flood-Impacts-Analyzing-Flood-Dataset-using-Machine-Learning-Algorithms-2-320.jpg)
![International Research Journal of Engineering and Technology (IRJET) e-ISSN: 2395-0056
Volume: 10 Issue: 07 | Jul 2023 www.irjet.net p-ISSN: 2395-0072
© 2023, IRJET | Impact Factor value: 8.226 | ISO 9001:2008 Certified Journal | Page 55
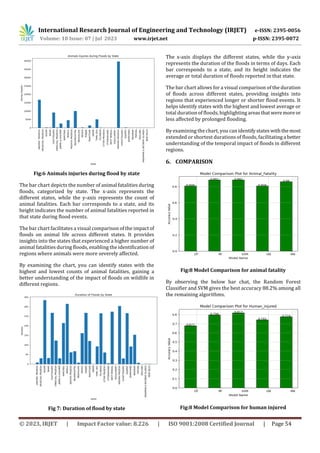
By observing the below bar chat, the SVM gives the best
accuracy 81.7% among all the remaining algorithms.
7. CONCLUSION
In conclusion, the project demonstrates the effectiveness of
machine learning algorithms in analyzing flood datasetsand
predicting flood impacts. The findings emphasize the
importance of usingadvancedalgorithmstoinformdecision-
making processes in flood management and response,
ultimately aiding in reducing the adverse effects of floodson
human life, animal welfare, and infrastructure.
REFERENCES
[1] World Health Organization.(n.d.).Floods.Retrievedfrom
https://www.who.int/health-topics/floods#tab=tab_1
[2] World Health Organization. (n.d.). Floods. In Health
topics. Retrieved Month Day, Year, from
https://www.who.int/health-topics/floods#tab=tab_2
[3] Di, Q., Jinbo, Q., & Mingti, C. (2022, October). Application
of Machine Learning in Flood Forecast: A Survey. In 2022
International Conferenceon VirtualReality, Human-Computer
Interaction and Artificial Intelligence (VRHCIAI) (pp. 177-
181). IEEE.
[4] Lawal, Z. K., Yassin, H., & Zakari, R. Y. (2021, December).
Flood prediction using machine learning models: a case
study of Kebbi state Nigeria. In 2021 IEEE Asia-Pacific
Conference on Computer Science and Data Engineering
(CSDE) (pp. 1-6). IEEE.
Z. K. Lawal, H. Yassin and R. Y. Zakari, "Flood Prediction
Using Machine Learning Models: A Case Study of KebbiState
Nigeria," 2021 IEEE Asia-Pacific Conference on Computer
Science and Data Engineering (CSDE), Brisbane, Australia,
2021, pp. 1-6, doi: 10.1109/CSDE53843.2021.9718497.
[5] Khalaf, M., Alaskar, H., Hussain, A. J.,Baker,T.,Maamar, Z.,
Buyya, R., ... & Al-Jumeily, D. (2020). IoT-enabled flood
severity prediction via ensemble machine learning
models. IEEE Access, 8, 70375-70386.
[6] Wang, Q. (2022, October). Machinelearningmodel design
for IoT-based flooding forecast. In 2022 International
Conference on Cyber-Enabled Distributed Computing and
Knowledge Discovery (CyberC) (pp. 97-103). IEEE.
[7] Python (programming language). (n.d.). In Wikipedia.
Retrieved May 8, 2023, from
https://en.wikipedia.org/wiki/Python_(programming_langu
age)
[8] Google. (n.d.). Frequently asked questions (FAQ).Google
Research.
https://research.google.com/colaboratory/faq.html
BIOGRAPHIES
Naga Ravindra Babu M working as
an Associate Professor in B V Raju
College, Bhimavaram, AP India. He
have hands on experienceon doing
web based projects using PHP and
MySQL and ML Projects.
B Naresh working as an Associate
Professor in B V Raju College,
Bhimavaram, AP India. He have
hands on experience on doing web
based projects using PHP and
MySQL.
A Satya Vamsi Kumar working as
an Asst.,Professor in B V Raju
College, Bhimavaram, AP India.
G Ganga Bhavani working as an
Asst.,Professor in B V Raju College,
Bhimavaram, AP India.
A Sai Ram working as an
Asst.,Professor in B V Raju College,
Bhimavaram, AP India.
G Chakradara Rao working as an
Asst.,Professor in B V Raju College,
Bhimavaram, AP India.](https://image.slidesharecdn.com/irjet-v10i709-230815101725-3a53321d/85/Predicting-Flood-Impacts-Analyzing-Flood-Dataset-using-Machine-Learning-Algorithms-6-320.jpg)

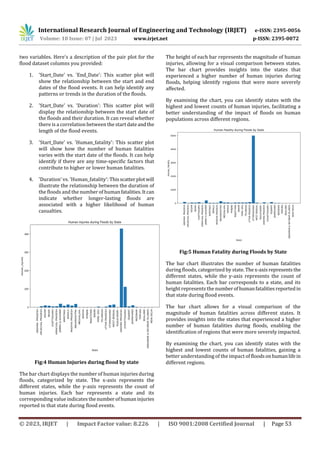
This document describes a study that uses machine learning algorithms to analyze flood data and predict flood impacts. The study collected flood data from various states in India containing information on start/end dates, duration, causes, affected districts/states, and casualties including human injuries and deaths as well as animal fatalities. Various machine learning models like decision trees, random forests, SVMs, and neural networks were trained on the data. The models' performance was evaluated based on metrics like accuracy, precision, recall, and F1-score. The results showed that some states experienced higher numbers of human/animal casualties from floods compared to others. Graphs and charts were used to analyze relationships between variables in the data and compare flood impacts like casualties and