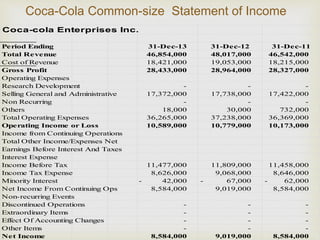
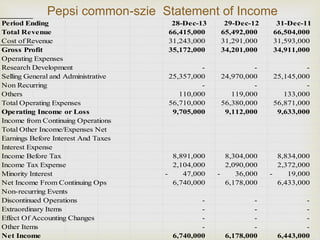
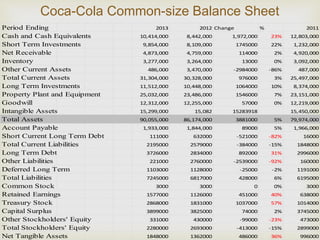
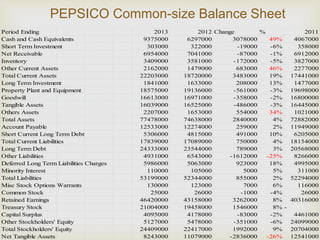
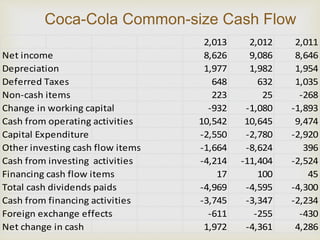
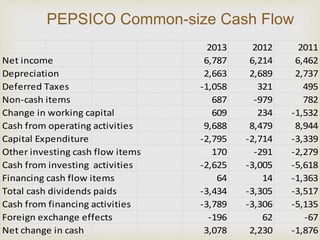
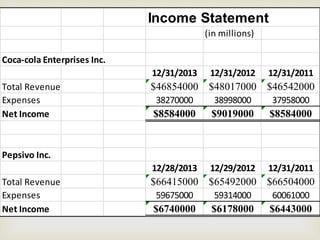
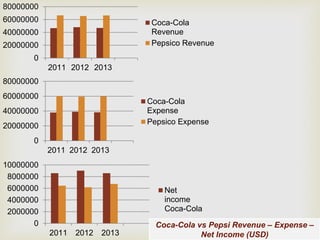
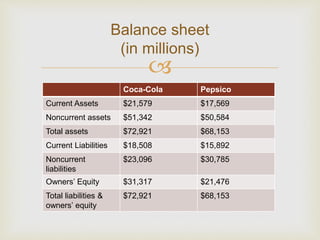
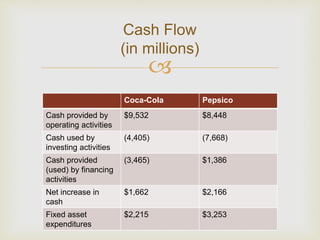
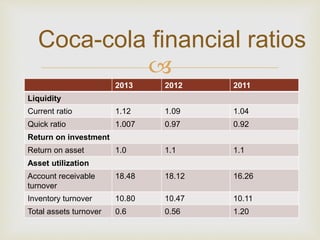
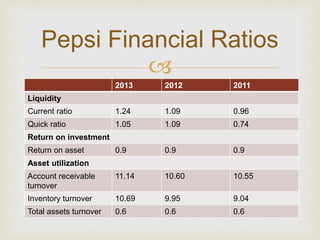
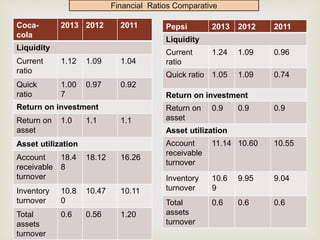
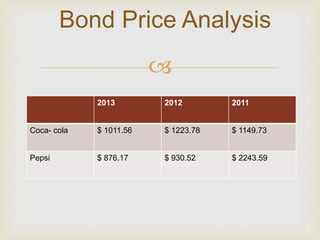
Members 
 
Truong Phuong Quyen 
Thai Thanh Quang 
Nguyen Minh Tan 
Le Vu Hoang Tuan
Outline 
 Introduction 
 Financial Analysis 
 Common-size analysis 
• Common-size income statement analysis 
• Common-size balance sheet analysis 
• Common-size cash flow analysis 
 Comparative analysis 
• Comparative income statement 
• Comparative balance sheet 
• Comparative cash flow 
 Financial ratio analysis 
 Conclusion
Introduction 
 
 Coca-Cola was 
founed in 1886 by Dr. 
John S Pemberton 
 The history of the 
world’s favourite drink
Introduction 
 
 Strong leaders in the high profitable soft 
drink/beverage industry. 
 Coca-Cola owns the best known 
worldwide, whereas Pepsico also has 
great brand-name recognition.
Financial Analysis 

Coca-Cola Common-size Statement of Income 
Coca-cola Enterprises Inc. 
Period Ending 31-Dec-13 31-Dec-12 31-Dec-11 
Total Revenue 46,854,000 48,017,000 46,542,000 
Cost of Revenue 18,421,000 19,053,000 18,215,000 
Gross Profit 28,433,000 28,964,000 28,327,000 
Operating Expenses 
Research Development - - - 
Selling General and Administrative 17,372,000 17,738,000 17,422,000 
Non Recurring - - - 
Others 18,000 30,000 732,000 
Total Operating Expenses 36,265,000 37,238,000 36,369,000 
Operating Income or Loss 10,589,000 10,779,000 10,173,000 
Income from Continuing Operations 
Total Other Income/Expenses Net 
Earnings Before Interest And Taxes 
Interest Expense 
Income Before Tax 11,477,000 11,809,000 11,458,000 
Income Tax Expense 8,626,000 9,068,000 8,646,000 
Minority Interest - 42,000 - 67,000 - 62,000 
Net Income From Continuing Ops 8,584,000 9,019,000 8,584,000 
Non-recurring Events 
Discontinued Operations - - - 
Extraordinary Items - - - 
Effect Of Accounting Changes - - - 
Other Items - - - 
Net Income 8,584,000 9,019,000 8,584,000
Pepsi common-szie Statement of Income 
Period Ending 28-Dec-13 29-Dec-12 31-Dec-11 
Total Revenue 66,415,000 65,492,000 66,504,000 
Cost of Revenue 31,243,000 31,291,000 31,593,000 
Gross Profit 35,172,000 34,201,000 34,911,000 
Operating Expenses 
Research Development - - - 
Selling General and Administrative 25,357,000 24,970,000 25,145,000 
Non Recurring - - - 
Others 110,000 119,000 133,000 
Total Operating Expenses 56,710,000 56,380,000 56,871,000 
Operating Income or Loss 9,705,000 9,112,000 9,633,000 
Income from Continuing Operations 
Total Other Income/Expenses Net 
Earnings Before Interest And Taxes 
Interest Expense 
Income Before Tax 8,891,000 8,304,000 8,834,000 
Income Tax Expense 2,104,000 2,090,000 2,372,000 
Minority Interest - 47,000 - 36,000 - 19,000 
Net Income From Continuing Ops 6,740,000 6,178,000 6,433,000 
Non-recurring Events 
Discontinued Operations - - - 
Extraordinary Items - - - 
Effect Of Accounting Changes - - - 
Other Items - - - 
Net Income 6,740,000 6,178,000 6,443,000
Coca-Cola Common-size Balance Sheet 
Period Ending 2013 2012 Change % 2011 
Cash and Cash Equivalents 10,414,000 8,442,000 1,972,000 23% 12,803,000 
Short Term Investments 9,854,000 8,109,000 1745000 22% 1,232,000 
Net Receivable 4,873,000 4,759,000 114000 2% 4,920,000 
Inventory 3,277,000 3,264,000 13000 0% 3,092,000 
Other Current Assets 486,000 3,470,000 -2984000 -86% 487,000 
Total Current Assets 31,304,000 30,328,000 976000 3% 25,497,000 
Long Term Investments 11,512,000 10,448,000 1064000 10% 8,374,000 
Property Plant and Equipment 25,032,000 23,486,000 1546000 7% 23,151,000 
Goodwill 12,312,000 12,255,000 57000 0% 12,219,000 
Intangible Assets 15,299,000 15,082 15283918 15,450,000 
Total Assets 90,055,000 86,174,000 3881000 5% 79,974,000 
Account Payable 1,933,000 1,844,000 89000 5% 1,966,000 
Short Current Long Term Debt 111000 632000 -521000 -82% 16000 
Total Current Liabilities 2195000 2579000 -384000 -15% 1848000 
Long Term Debt 3726000 2834000 892000 31% 2996000 
Other Liabilities 221000 2760000 -2539000 -92% 160000 
Deferred Long Term 1103000 1128000 -25000 -2% 1191000 
Total Liabilities 7245000 6817000 428000 6% 6195000 
Common Stock 3000 3000 0 0% 3000 
Retained Earnings 1577000 1126000 451000 40% 638000 
Treasury Stock 2868000 1831000 1037000 57% 1014000 
Capital Surplus 3899000 3825000 74000 2% 3745000 
Other Stockholders' Equity 331000 430000 -99000 -23% 473000 
Total Stockholders' Equity 2280000 2693000 -413000 -15% 2899000 
Net Tangible Assets 1848000 1362000 486000 36% 996000
PEPSICO Common-size Balance Sheet 
Period Ending 2013 2012 Change % 2011 
Cash and Cash Equivalents 9375000 6297000 3078000 49% 4067000 
Short Term Investment 303000 322000 -19000 -6% 358000 
Net Receivable 6954000 7041000 -87000 -1% 6912000 
Inventory 3409000 3581000 -172000 -5% 3827000 
Other Current Assets 2162000 1479000 683000 46% 2277000 
Total Current Assets 22203000 18720000 3483000 19% 17441000 
Long Term Investment 1841000 1633000 208000 13% 1477000 
Property Plant and Equipment 18575000 19136000 -561000 -3% 19698000 
Goodwill 16613000 16971000 -358000 -2% 16800000 
Tangible Assets 16039000 16525000 -486000 -3% 16445000 
Others Assets 2207000 1653000 554000 34% 1021000 
Total Assets 77478000 74638000 2840000 4% 72882000 
Account Payable 12533000 12274000 259000 2% 11949000 
Short Current Long Term Debt 5306000 4815000 491000 10% 6205000 
Total Current Liabilities 17839000 17089000 750000 4% 18154000 
Long Term Debt 24333000 23544000 789000 3% 20568000 
Other Liabilities 4931000 6543000 -1612000 -25% 8266000 
Deferred Long Term Liabilities Charges 5986000 5063000 923000 18% 4995000 
Minority Interest 110000 105000 5000 5% 311000 
Total Liabilities 53199000 52344000 855000 2% 52294000 
Misc Stock Options Warrants 130000 123000 7000 6% 116000 
Common Stock 25000 26000 -1000 -4% 26000 
Retained Earnings 46420000 43158000 3262000 8% 40316000 
Treasury Stock 21004000 19458000 1546000 8% - 
Capital Surplus 4095000 4178000 -83000 -2% 4461000 
Other Stockholders' Equity 5127000 5478000 -351000 -6% 24099000 
Total Stockholders' Equity 24409000 22417000 1992000 9% 20704000 
Net Tangible Assets 8243000 11079000 -2836000 -26% 12541000
Coca-Cola Common-size Cash Flow 
2,013 2,012 2,011 
Net income 8,626 9,086 8,646 
Depreciation 1,977 1,982 1,954 
Deferred Taxes 648 632 1,035 
Non-cash items 223 25 -268 
Change in working capital -932 -1,080 -1,893 
Cash from operating activities 10,542 10,645 9,474 
Capital Expenditure -2,550 -2,780 -2,920 
Other investing cash flow items -1,664 -8,624 396 
Cash from investing activities -4,214 -11,404 -2,524 
Financing cash flow items 17 100 45 
Total cash dividends paids -4,969 -4,595 -4,300 
Cash from financing activities -3,745 -3,347 -2,234 
Foreign exchange effects -611 -255 -430 
Net change in cash 1,972 -4,361 4,286
PEPSICO Common-size Cash Flow 
2013 2012 2011 
Net income 6,787 6,214 6,462 
Depreciation 2,663 2,689 2,737 
Deferred Taxes -1,058 321 495 
Non-cash items 687 -979 782 
Change in working capital 609 234 -1,532 
Cash from operating activities 9,688 8,479 8,944 
Capital Expenditure -2,795 -2,714 -3,339 
Other investing cash flow items 170 -291 -2,279 
Cash from investing activities -2,625 -3,005 -5,618 
Financing cash flow items 64 14 -1,363 
Total cash dividends paids -3,434 -3,305 -3,517 
Cash from financing activities -3,789 -3,306 -5,135 
Foreign exchange effects -196 62 -67 
Net change in cash 3,078 2,230 -1,876
Comparative Analysis 

Income Statement 
(in millions) 
Coca-cola Enterprises Inc. 
12/31/2013 12/31/2012 12/31/2011 
Total Revenue $46854000 $48017000 $46542000 
Expenses 38270000 38998000 37958000 
Net Income $8584000 $9019000 $8584000 
Pepsivo Inc. 
12/28/2013 12/29/2012 12/31/2011 
Total Revenue $66415000 $65492000 $66504000 
Expenses 59675000 59314000 60061000 
Net Income $6740000 $6178000 $6443000
80000000 
60000000 
40000000 
20000000 
0 
2011 2012 2013 
Coca-Cola 
Revenue 
Pepsico Revenue 
80000000 
60000000 
40000000 
20000000 
0 
2011 2012 2013 
Coca-Cola 
Expense 
Pepsico Expense 
10000000 
8000000 
6000000 
4000000 
2000000 
0 
2011 2012 2013 
Net 
income 
Coca-Cola 
Coca-Cola vs Pepsi Revenue – Expense – 
Net Income (USD)
Balance sheet 
(in millions) 
 
Coca-Cola Pepsico 
Current Assets $21,579 $17,569 
Noncurrent assets $51,342 $50,584 
Total assets $72,921 $68,153 
Current Liabilities $18,508 $15,892 
Noncurrent 
$23,096 $30,785 
liabilities 
Owners’ Equity $31,317 $21,476 
Total liabilities & 
$72,921 $68,153 
owners’ equity
Cash Flow 
(in millions) 
 
Coca-Cola Pepsico 
Cash provided by 
operating activities 
$9,532 $8,448 
Cash used by 
investing activities 
(4,405) (7,668) 
Cash provided 
(used) by financing 
activities 
(3,465) $1,386 
Net increase in 
cash 
$1,662 $2,166 
Fixed asset 
expenditures 
$2,215 $3,253
Financial Ratios Analysis 

Coca-cola financial ratios 
 
2013 2012 2011 
Liquidity 
Current ratio 1.12 1.09 1.04 
Quick ratio 1.007 0.97 0.92 
Return on investment 
Return on asset 1.0 1.1 1.1 
Asset utilization 
Account receivable 
turnover 
18.48 18.12 16.26 
Inventory turnover 10.80 10.47 10.11 
Total assets turnover 0.6 0.56 1.20
Pepsi Financial Ratios 
 
2013 2012 2011 
Liquidity 
Current ratio 1.24 1.09 0.96 
Quick ratio 1.05 1.09 0.74 
Return on investment 
Return on asset 0.9 0.9 0.9 
Asset utilization 
Account receivable 
turnover 
11.14 10.60 10.55 
Inventory turnover 10.69 9.95 9.04 
Total assets turnover 0.6 0.6 0.6
Financial Ratios Comparative 
Coca-cola 
2013 2012 2011 
Liquidity 
Current 
ratio 
1.12 1.09 1.04 
Quick 
ratio 
1.00 
7 
0.97 0.92 
Return on investment 
Return on 
asset 
1.0 1.1 1.1 
Asset utilization 
Account 
18.4 
receivable 
8 
turnover 
18.12 16.26 
Inventory 
turnover 
10.8 
0 
10.47 10.11 
Total 
assets 
turnover 
0.6 0.56 1.20 
Pepsi 2013 2012 2011 
Liquidity 
Current 
1.24 1.09 0.96 
ratio 
Quick ratio 1.05 1.09 0.74 
Return on investment 
Return on 
asset 
0.9 0.9 0.9 
Asset utilization 
Account 
receivable 
turnover 
11.14 10.60 10.55 
Inventory 
turnover 
10.6 
9 
9.95 9.04 
Total 
assets 
turnover 
0.6 0.6 0.6
Bond Price Analysis 
 
2013 2012 2011 
Coca- cola $ 1011.56 $ 1223.78 $ 1149.73 
Pepsi $ 876.17 $ 930.52 $ 2243.59
Conclusion 
 
 Strong industry players in soft drink/beverage 
industry 
 Strong leaders in the highly profitable soft 
drink/beverage industry 
 Coca-Cola possess the best recognized brand 
worldwide that incurred a lower average cost of 
sales. However, PepsiCo achieved even better 
average sales growth rate annually
Finance present

Finance present

  • 2.
    Members  TruongPhuong Quyen Thai Thanh Quang Nguyen Minh Tan Le Vu Hoang Tuan
  • 3.
    Outline  Introduction  Financial Analysis  Common-size analysis • Common-size income statement analysis • Common-size balance sheet analysis • Common-size cash flow analysis  Comparative analysis • Comparative income statement • Comparative balance sheet • Comparative cash flow  Financial ratio analysis  Conclusion
  • 4.
    Introduction  Coca-Cola was founed in 1886 by Dr. John S Pemberton  The history of the world’s favourite drink
  • 5.
    Introduction  Strong leaders in the high profitable soft drink/beverage industry.  Coca-Cola owns the best known worldwide, whereas Pepsico also has great brand-name recognition.
  • 6.
  • 7.
    Coca-Cola Common-size Statementof Income Coca-cola Enterprises Inc. Period Ending 31-Dec-13 31-Dec-12 31-Dec-11 Total Revenue 46,854,000 48,017,000 46,542,000 Cost of Revenue 18,421,000 19,053,000 18,215,000 Gross Profit 28,433,000 28,964,000 28,327,000 Operating Expenses Research Development - - - Selling General and Administrative 17,372,000 17,738,000 17,422,000 Non Recurring - - - Others 18,000 30,000 732,000 Total Operating Expenses 36,265,000 37,238,000 36,369,000 Operating Income or Loss 10,589,000 10,779,000 10,173,000 Income from Continuing Operations Total Other Income/Expenses Net Earnings Before Interest And Taxes Interest Expense Income Before Tax 11,477,000 11,809,000 11,458,000 Income Tax Expense 8,626,000 9,068,000 8,646,000 Minority Interest - 42,000 - 67,000 - 62,000 Net Income From Continuing Ops 8,584,000 9,019,000 8,584,000 Non-recurring Events Discontinued Operations - - - Extraordinary Items - - - Effect Of Accounting Changes - - - Other Items - - - Net Income 8,584,000 9,019,000 8,584,000
  • 8.
    Pepsi common-szie Statementof Income Period Ending 28-Dec-13 29-Dec-12 31-Dec-11 Total Revenue 66,415,000 65,492,000 66,504,000 Cost of Revenue 31,243,000 31,291,000 31,593,000 Gross Profit 35,172,000 34,201,000 34,911,000 Operating Expenses Research Development - - - Selling General and Administrative 25,357,000 24,970,000 25,145,000 Non Recurring - - - Others 110,000 119,000 133,000 Total Operating Expenses 56,710,000 56,380,000 56,871,000 Operating Income or Loss 9,705,000 9,112,000 9,633,000 Income from Continuing Operations Total Other Income/Expenses Net Earnings Before Interest And Taxes Interest Expense Income Before Tax 8,891,000 8,304,000 8,834,000 Income Tax Expense 2,104,000 2,090,000 2,372,000 Minority Interest - 47,000 - 36,000 - 19,000 Net Income From Continuing Ops 6,740,000 6,178,000 6,433,000 Non-recurring Events Discontinued Operations - - - Extraordinary Items - - - Effect Of Accounting Changes - - - Other Items - - - Net Income 6,740,000 6,178,000 6,443,000
  • 9.
    Coca-Cola Common-size BalanceSheet Period Ending 2013 2012 Change % 2011 Cash and Cash Equivalents 10,414,000 8,442,000 1,972,000 23% 12,803,000 Short Term Investments 9,854,000 8,109,000 1745000 22% 1,232,000 Net Receivable 4,873,000 4,759,000 114000 2% 4,920,000 Inventory 3,277,000 3,264,000 13000 0% 3,092,000 Other Current Assets 486,000 3,470,000 -2984000 -86% 487,000 Total Current Assets 31,304,000 30,328,000 976000 3% 25,497,000 Long Term Investments 11,512,000 10,448,000 1064000 10% 8,374,000 Property Plant and Equipment 25,032,000 23,486,000 1546000 7% 23,151,000 Goodwill 12,312,000 12,255,000 57000 0% 12,219,000 Intangible Assets 15,299,000 15,082 15283918 15,450,000 Total Assets 90,055,000 86,174,000 3881000 5% 79,974,000 Account Payable 1,933,000 1,844,000 89000 5% 1,966,000 Short Current Long Term Debt 111000 632000 -521000 -82% 16000 Total Current Liabilities 2195000 2579000 -384000 -15% 1848000 Long Term Debt 3726000 2834000 892000 31% 2996000 Other Liabilities 221000 2760000 -2539000 -92% 160000 Deferred Long Term 1103000 1128000 -25000 -2% 1191000 Total Liabilities 7245000 6817000 428000 6% 6195000 Common Stock 3000 3000 0 0% 3000 Retained Earnings 1577000 1126000 451000 40% 638000 Treasury Stock 2868000 1831000 1037000 57% 1014000 Capital Surplus 3899000 3825000 74000 2% 3745000 Other Stockholders' Equity 331000 430000 -99000 -23% 473000 Total Stockholders' Equity 2280000 2693000 -413000 -15% 2899000 Net Tangible Assets 1848000 1362000 486000 36% 996000
  • 10.
    PEPSICO Common-size BalanceSheet Period Ending 2013 2012 Change % 2011 Cash and Cash Equivalents 9375000 6297000 3078000 49% 4067000 Short Term Investment 303000 322000 -19000 -6% 358000 Net Receivable 6954000 7041000 -87000 -1% 6912000 Inventory 3409000 3581000 -172000 -5% 3827000 Other Current Assets 2162000 1479000 683000 46% 2277000 Total Current Assets 22203000 18720000 3483000 19% 17441000 Long Term Investment 1841000 1633000 208000 13% 1477000 Property Plant and Equipment 18575000 19136000 -561000 -3% 19698000 Goodwill 16613000 16971000 -358000 -2% 16800000 Tangible Assets 16039000 16525000 -486000 -3% 16445000 Others Assets 2207000 1653000 554000 34% 1021000 Total Assets 77478000 74638000 2840000 4% 72882000 Account Payable 12533000 12274000 259000 2% 11949000 Short Current Long Term Debt 5306000 4815000 491000 10% 6205000 Total Current Liabilities 17839000 17089000 750000 4% 18154000 Long Term Debt 24333000 23544000 789000 3% 20568000 Other Liabilities 4931000 6543000 -1612000 -25% 8266000 Deferred Long Term Liabilities Charges 5986000 5063000 923000 18% 4995000 Minority Interest 110000 105000 5000 5% 311000 Total Liabilities 53199000 52344000 855000 2% 52294000 Misc Stock Options Warrants 130000 123000 7000 6% 116000 Common Stock 25000 26000 -1000 -4% 26000 Retained Earnings 46420000 43158000 3262000 8% 40316000 Treasury Stock 21004000 19458000 1546000 8% - Capital Surplus 4095000 4178000 -83000 -2% 4461000 Other Stockholders' Equity 5127000 5478000 -351000 -6% 24099000 Total Stockholders' Equity 24409000 22417000 1992000 9% 20704000 Net Tangible Assets 8243000 11079000 -2836000 -26% 12541000
  • 11.
    Coca-Cola Common-size CashFlow 2,013 2,012 2,011 Net income 8,626 9,086 8,646 Depreciation 1,977 1,982 1,954 Deferred Taxes 648 632 1,035 Non-cash items 223 25 -268 Change in working capital -932 -1,080 -1,893 Cash from operating activities 10,542 10,645 9,474 Capital Expenditure -2,550 -2,780 -2,920 Other investing cash flow items -1,664 -8,624 396 Cash from investing activities -4,214 -11,404 -2,524 Financing cash flow items 17 100 45 Total cash dividends paids -4,969 -4,595 -4,300 Cash from financing activities -3,745 -3,347 -2,234 Foreign exchange effects -611 -255 -430 Net change in cash 1,972 -4,361 4,286
  • 12.
    PEPSICO Common-size CashFlow 2013 2012 2011 Net income 6,787 6,214 6,462 Depreciation 2,663 2,689 2,737 Deferred Taxes -1,058 321 495 Non-cash items 687 -979 782 Change in working capital 609 234 -1,532 Cash from operating activities 9,688 8,479 8,944 Capital Expenditure -2,795 -2,714 -3,339 Other investing cash flow items 170 -291 -2,279 Cash from investing activities -2,625 -3,005 -5,618 Financing cash flow items 64 14 -1,363 Total cash dividends paids -3,434 -3,305 -3,517 Cash from financing activities -3,789 -3,306 -5,135 Foreign exchange effects -196 62 -67 Net change in cash 3,078 2,230 -1,876
  • 13.
  • 14.
    Income Statement (inmillions) Coca-cola Enterprises Inc. 12/31/2013 12/31/2012 12/31/2011 Total Revenue $46854000 $48017000 $46542000 Expenses 38270000 38998000 37958000 Net Income $8584000 $9019000 $8584000 Pepsivo Inc. 12/28/2013 12/29/2012 12/31/2011 Total Revenue $66415000 $65492000 $66504000 Expenses 59675000 59314000 60061000 Net Income $6740000 $6178000 $6443000
  • 15.
    80000000 60000000 40000000 20000000 0 2011 2012 2013 Coca-Cola Revenue Pepsico Revenue 80000000 60000000 40000000 20000000 0 2011 2012 2013 Coca-Cola Expense Pepsico Expense 10000000 8000000 6000000 4000000 2000000 0 2011 2012 2013 Net income Coca-Cola Coca-Cola vs Pepsi Revenue – Expense – Net Income (USD)
  • 16.
    Balance sheet (inmillions)  Coca-Cola Pepsico Current Assets $21,579 $17,569 Noncurrent assets $51,342 $50,584 Total assets $72,921 $68,153 Current Liabilities $18,508 $15,892 Noncurrent $23,096 $30,785 liabilities Owners’ Equity $31,317 $21,476 Total liabilities & $72,921 $68,153 owners’ equity
  • 17.
    Cash Flow (inmillions)  Coca-Cola Pepsico Cash provided by operating activities $9,532 $8,448 Cash used by investing activities (4,405) (7,668) Cash provided (used) by financing activities (3,465) $1,386 Net increase in cash $1,662 $2,166 Fixed asset expenditures $2,215 $3,253
  • 18.
  • 19.
    Coca-cola financial ratios  2013 2012 2011 Liquidity Current ratio 1.12 1.09 1.04 Quick ratio 1.007 0.97 0.92 Return on investment Return on asset 1.0 1.1 1.1 Asset utilization Account receivable turnover 18.48 18.12 16.26 Inventory turnover 10.80 10.47 10.11 Total assets turnover 0.6 0.56 1.20
  • 20.
    Pepsi Financial Ratios  2013 2012 2011 Liquidity Current ratio 1.24 1.09 0.96 Quick ratio 1.05 1.09 0.74 Return on investment Return on asset 0.9 0.9 0.9 Asset utilization Account receivable turnover 11.14 10.60 10.55 Inventory turnover 10.69 9.95 9.04 Total assets turnover 0.6 0.6 0.6
  • 21.
    Financial Ratios Comparative Coca-cola 2013 2012 2011 Liquidity Current ratio 1.12 1.09 1.04 Quick ratio 1.00 7 0.97 0.92 Return on investment Return on asset 1.0 1.1 1.1 Asset utilization Account 18.4 receivable 8 turnover 18.12 16.26 Inventory turnover 10.8 0 10.47 10.11 Total assets turnover 0.6 0.56 1.20 Pepsi 2013 2012 2011 Liquidity Current 1.24 1.09 0.96 ratio Quick ratio 1.05 1.09 0.74 Return on investment Return on asset 0.9 0.9 0.9 Asset utilization Account receivable turnover 11.14 10.60 10.55 Inventory turnover 10.6 9 9.95 9.04 Total assets turnover 0.6 0.6 0.6
  • 22.
    Bond Price Analysis  2013 2012 2011 Coca- cola $ 1011.56 $ 1223.78 $ 1149.73 Pepsi $ 876.17 $ 930.52 $ 2243.59
  • 23.
    Conclusion  Strong industry players in soft drink/beverage industry  Strong leaders in the highly profitable soft drink/beverage industry  Coca-Cola possess the best recognized brand worldwide that incurred a lower average cost of sales. However, PepsiCo achieved even better average sales growth rate annually