Downloaded 1,155 times
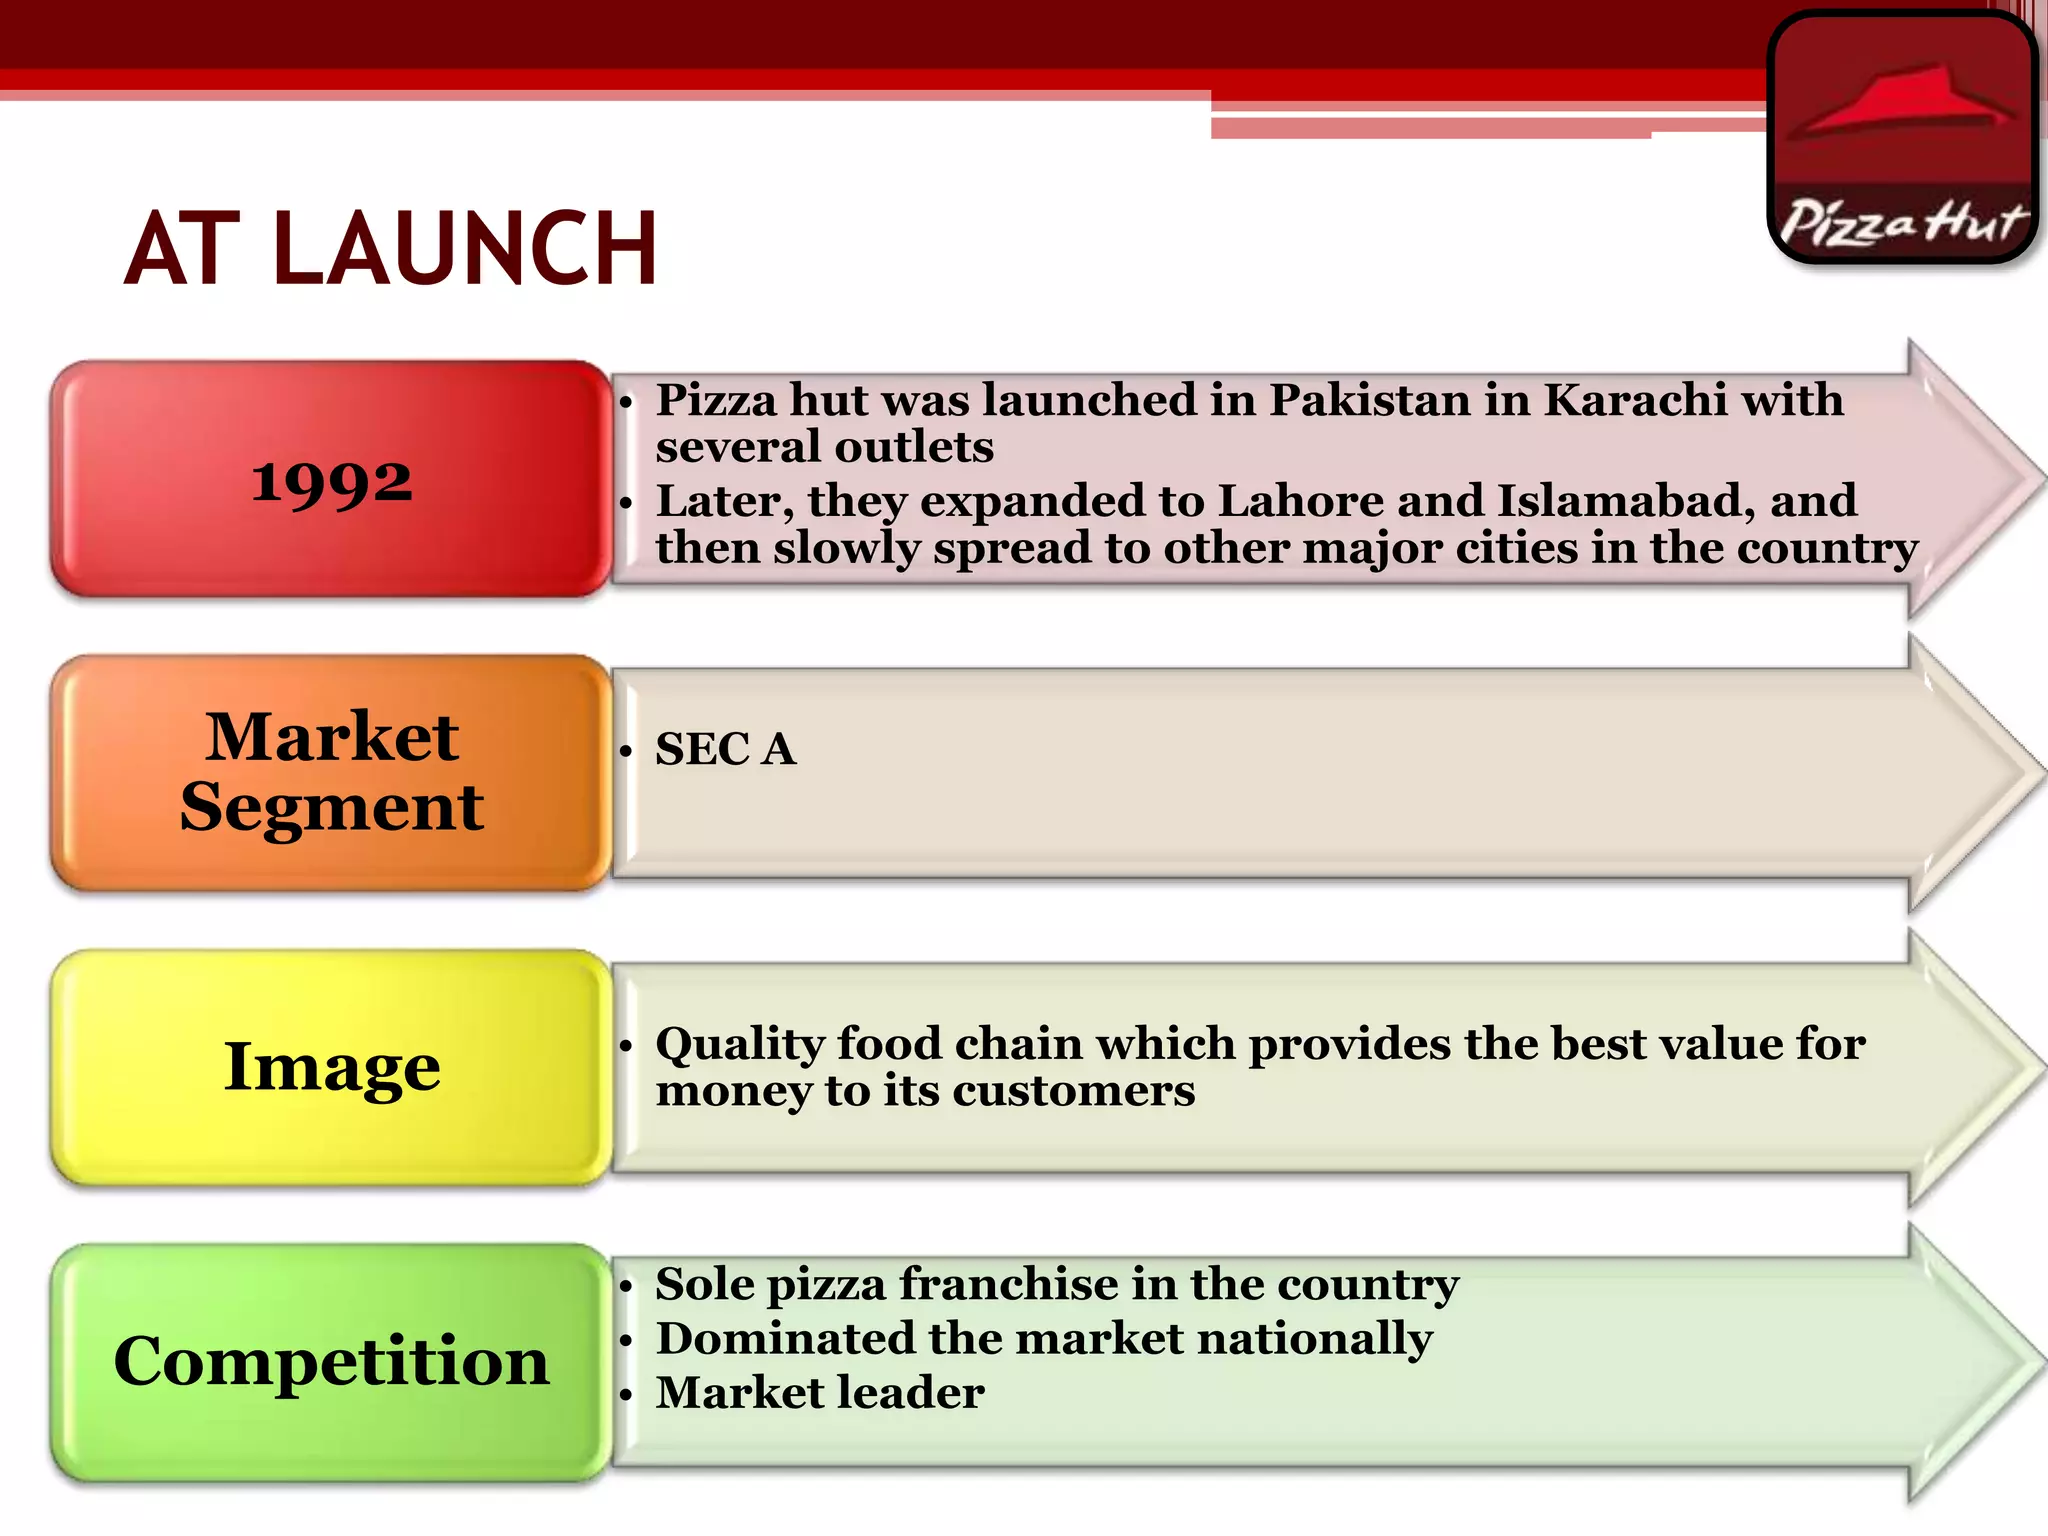
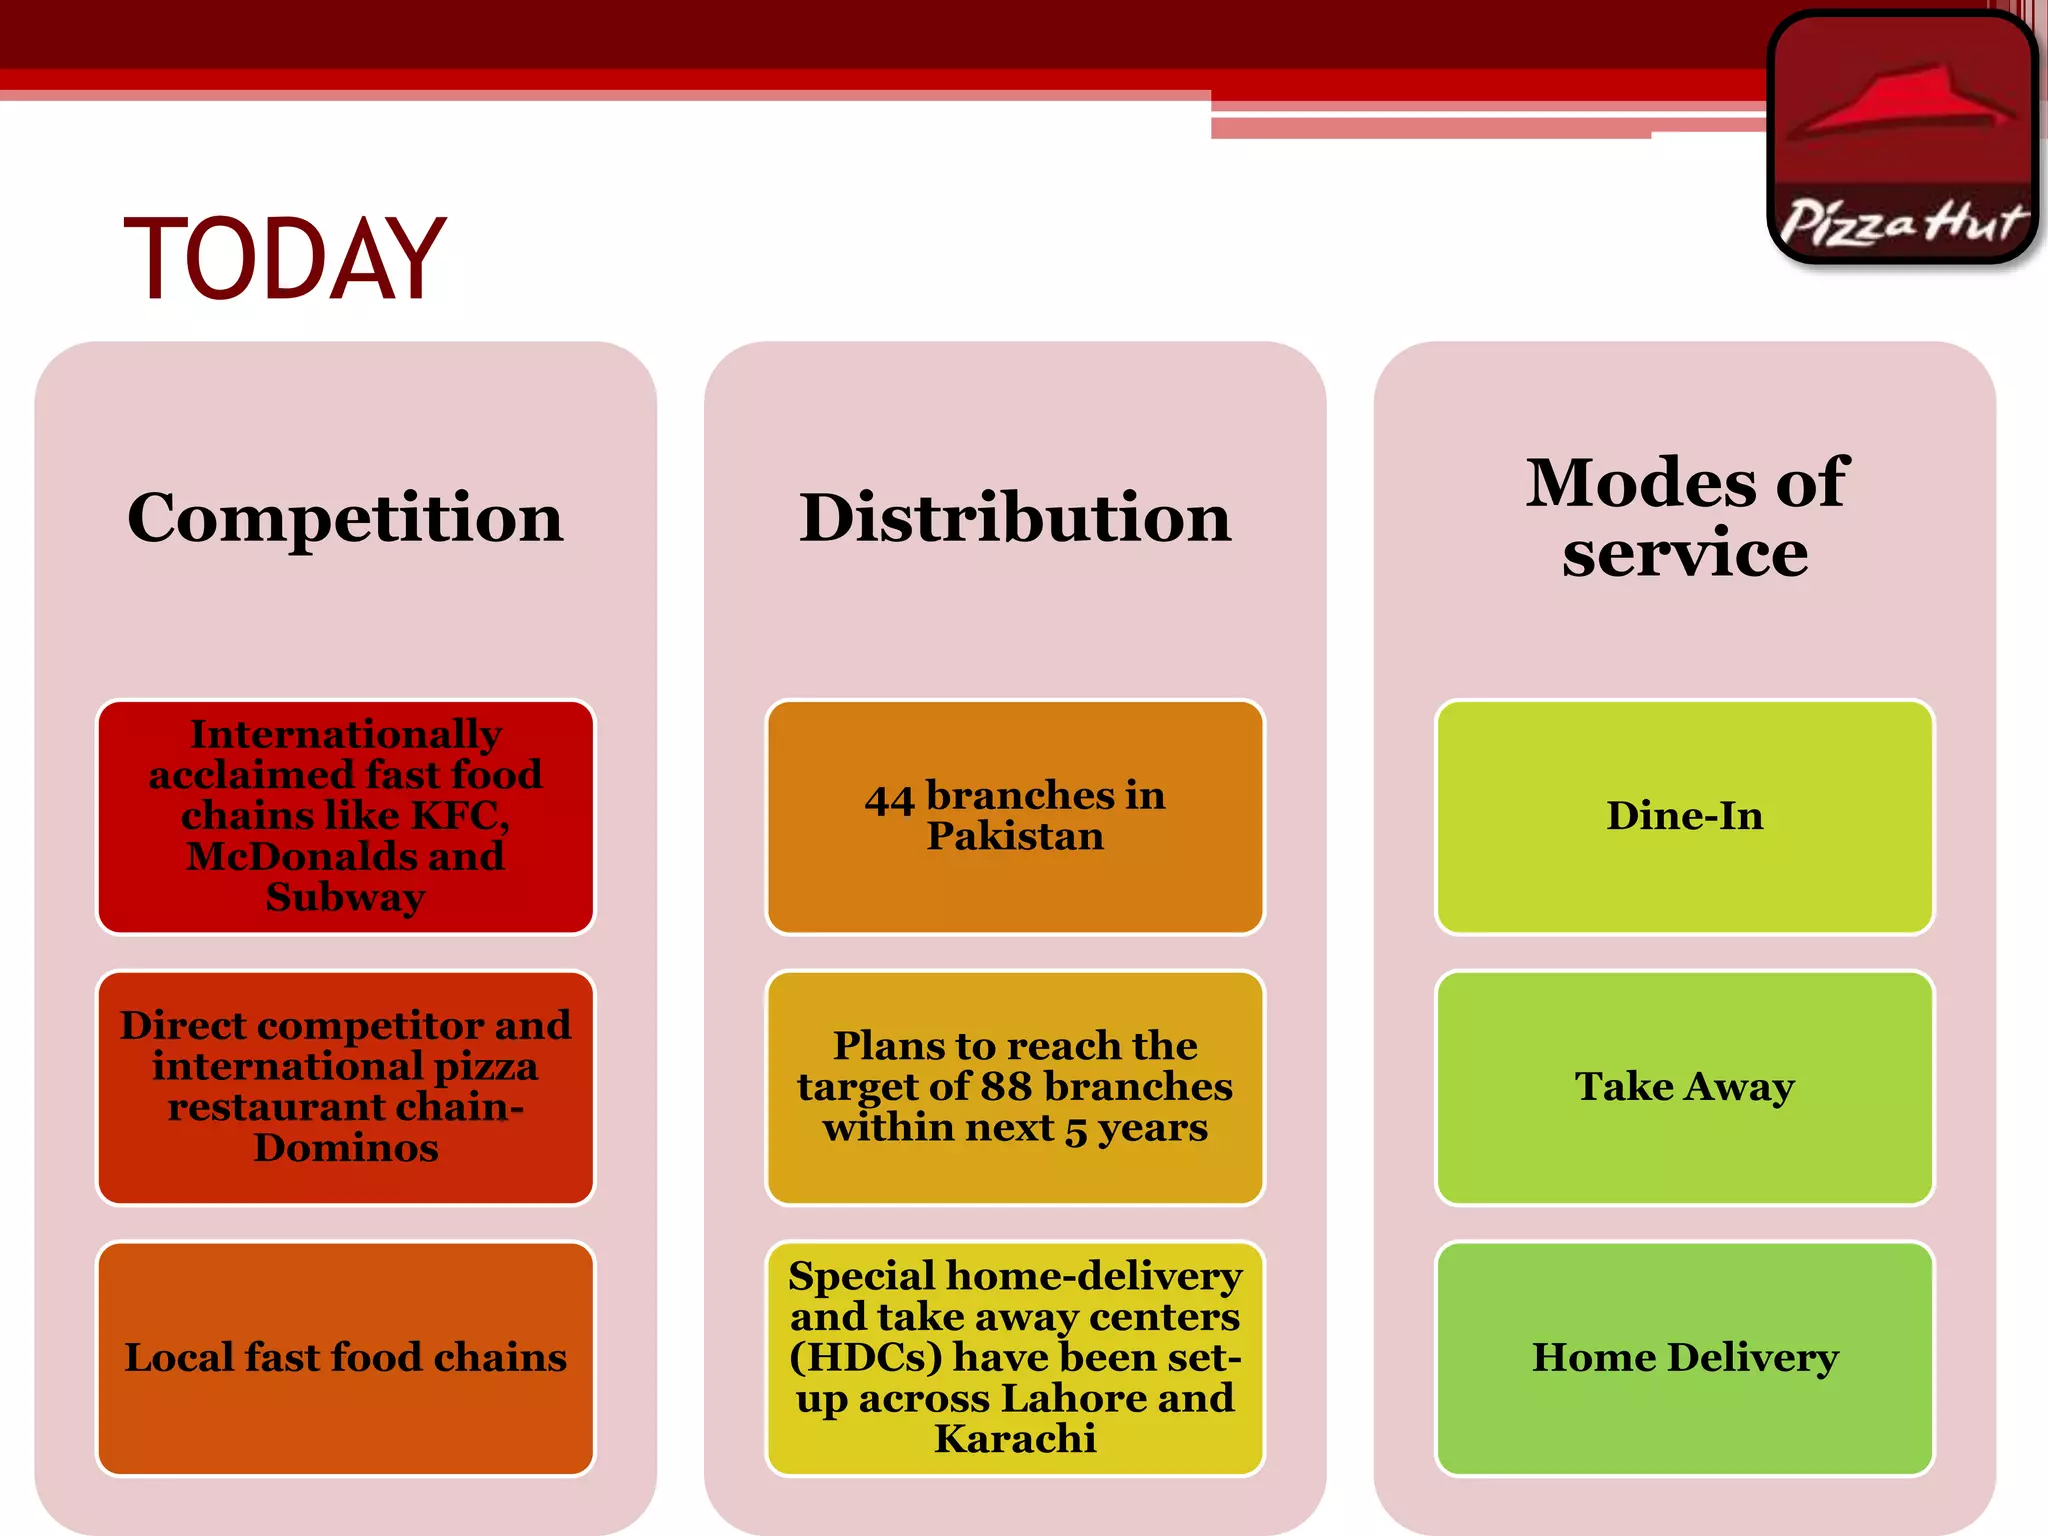
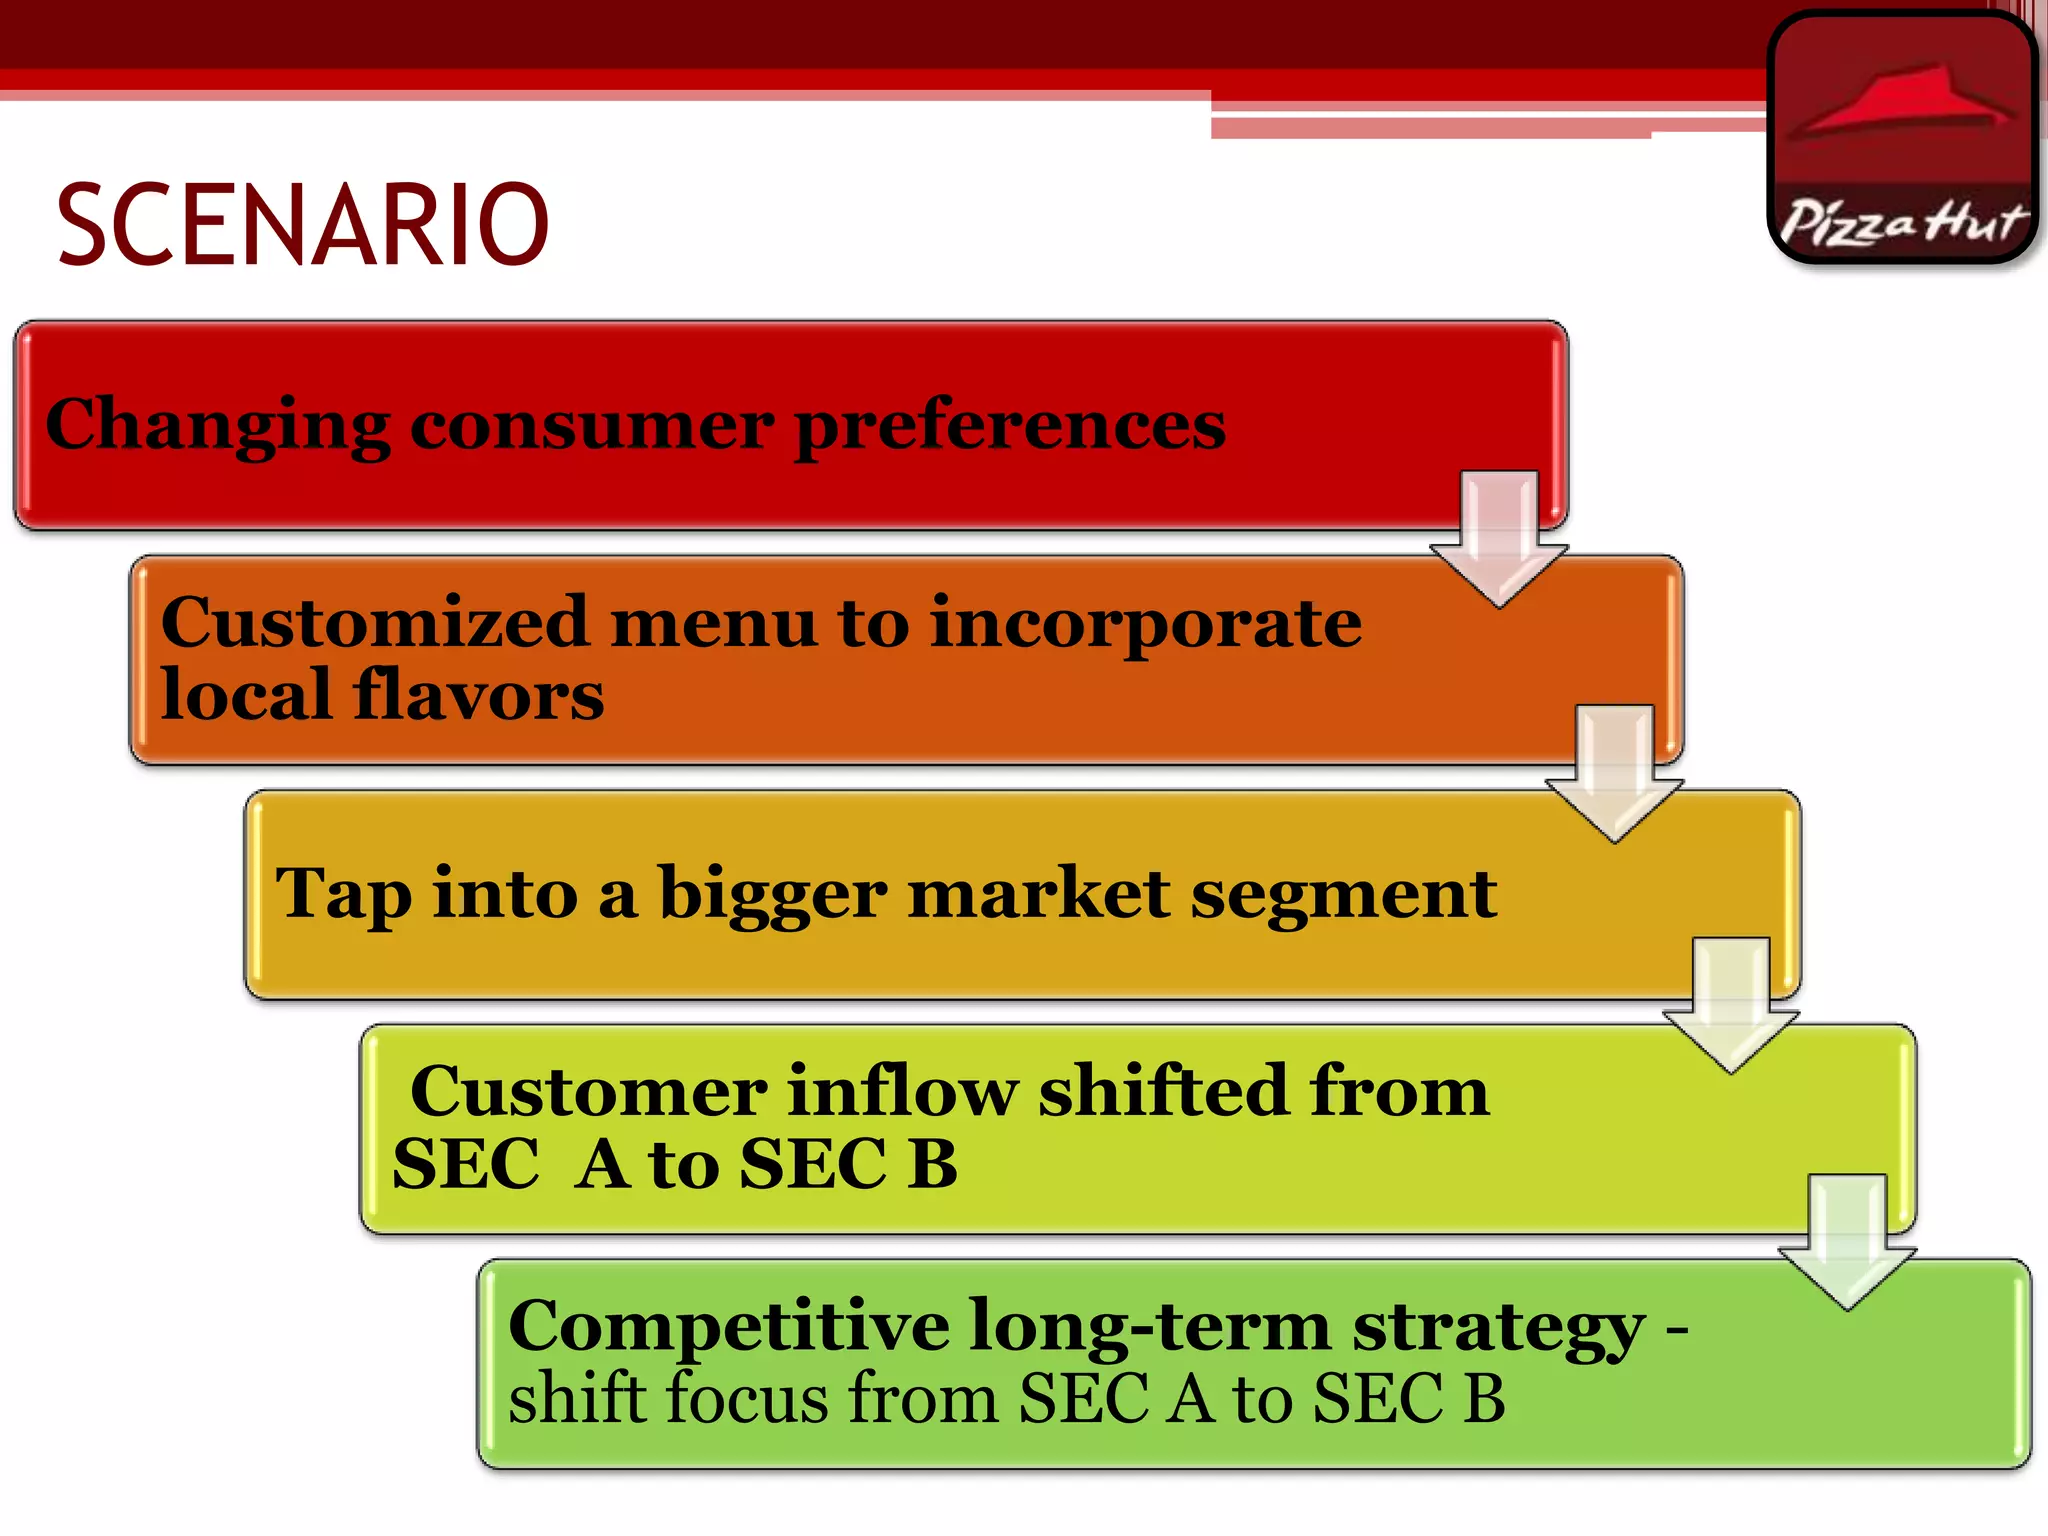
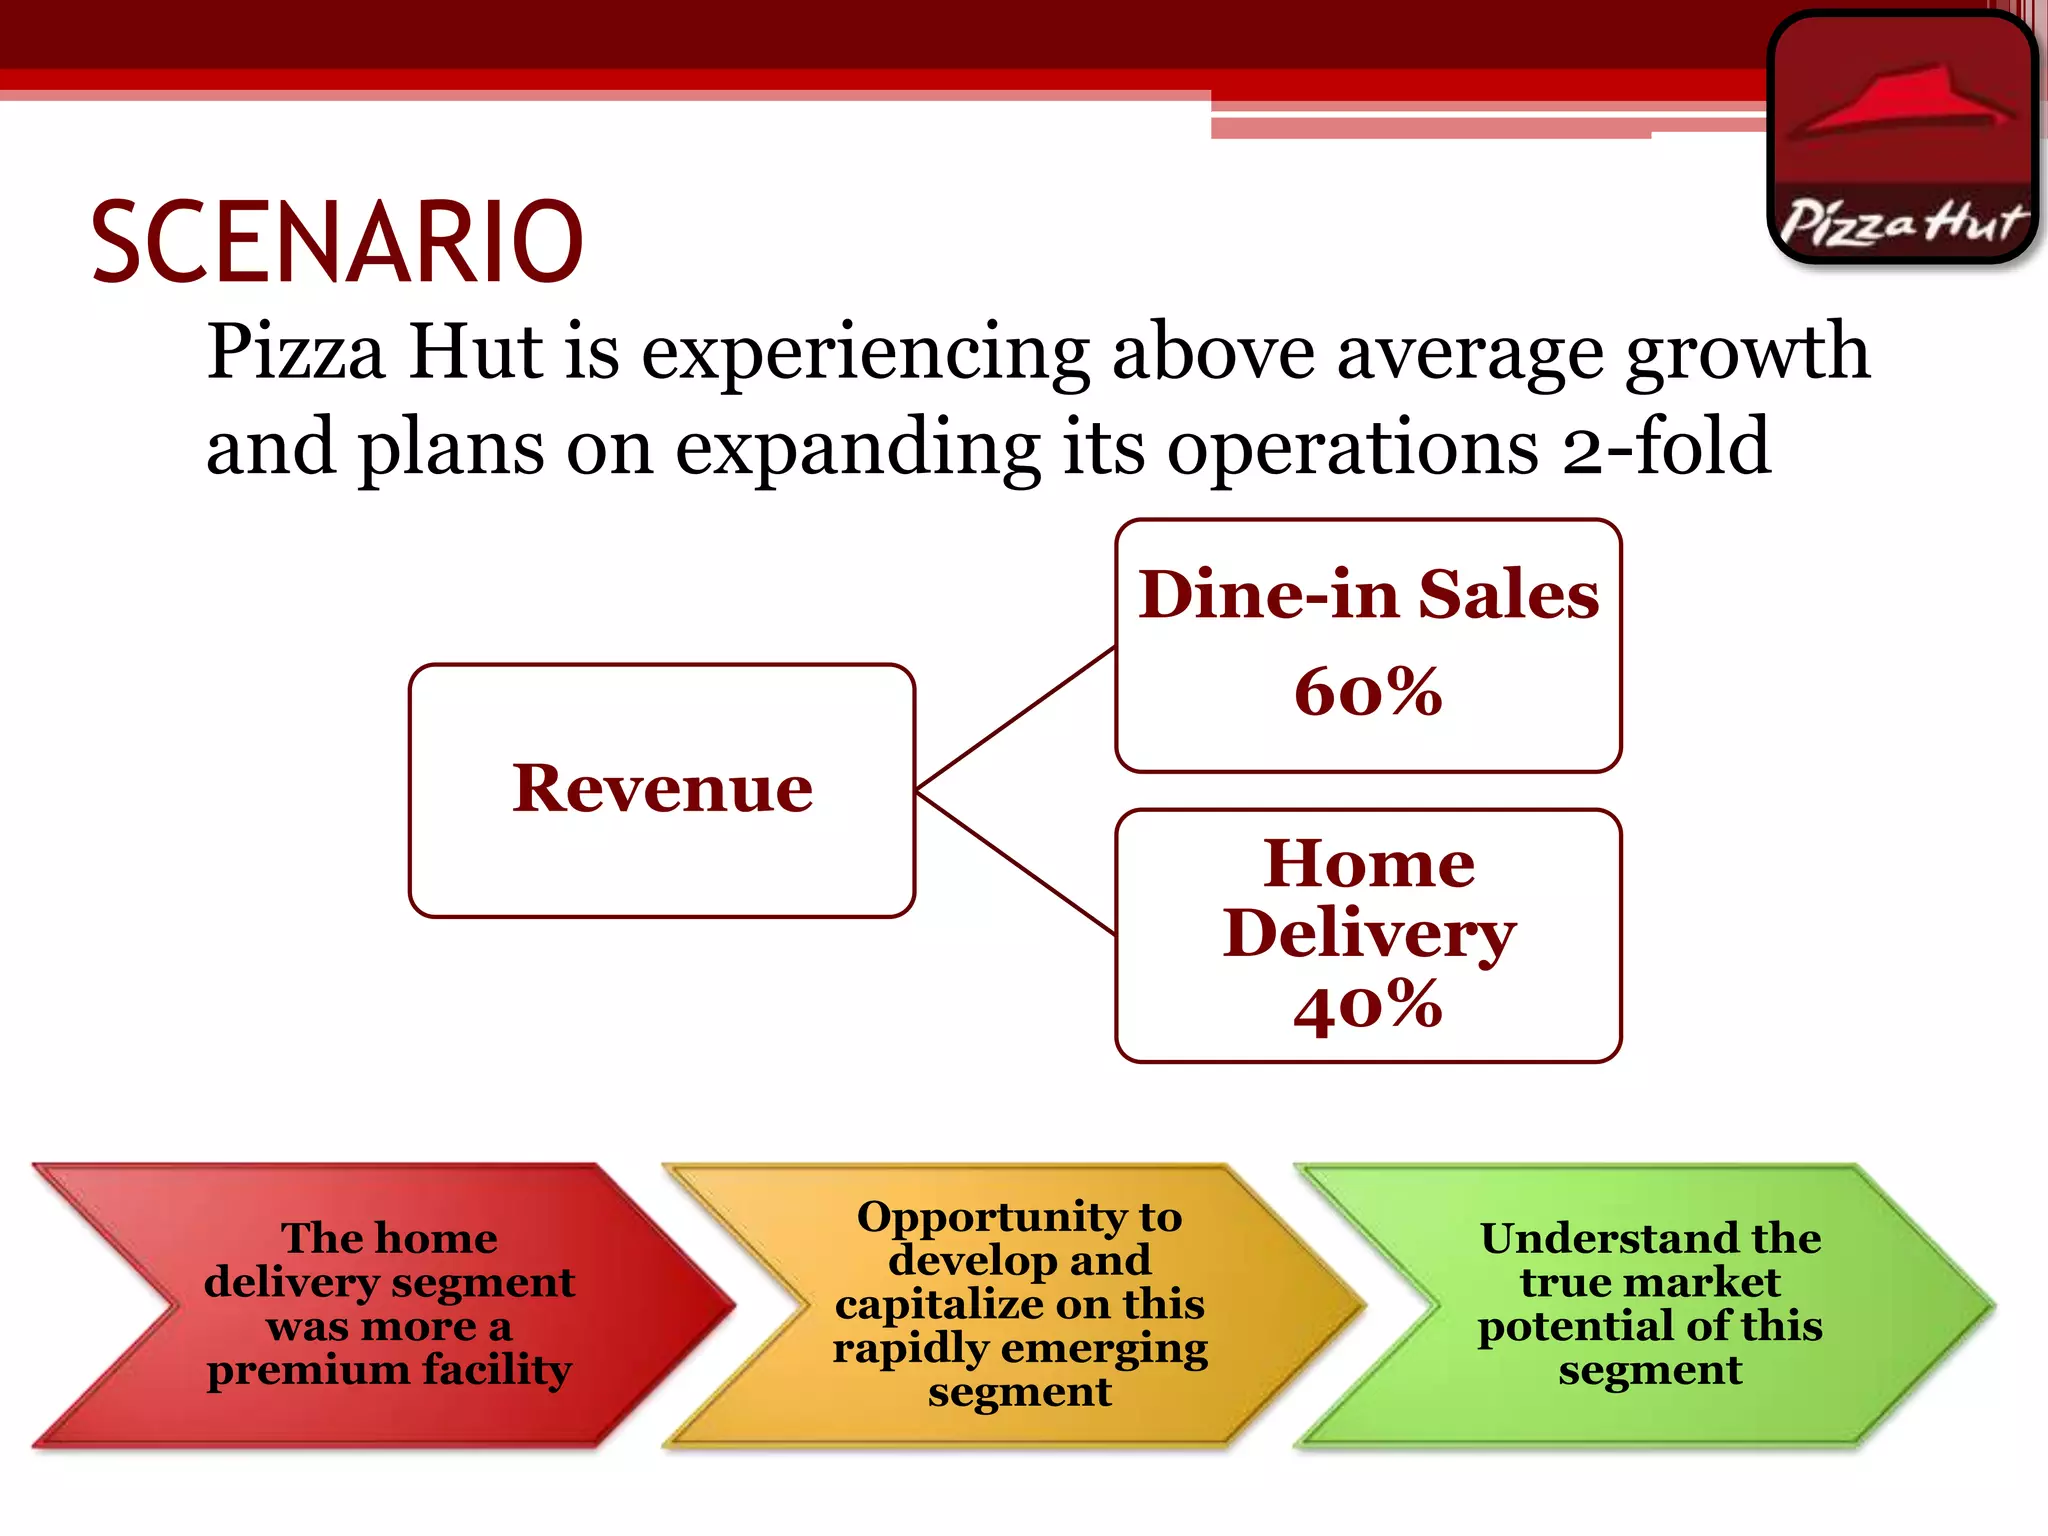
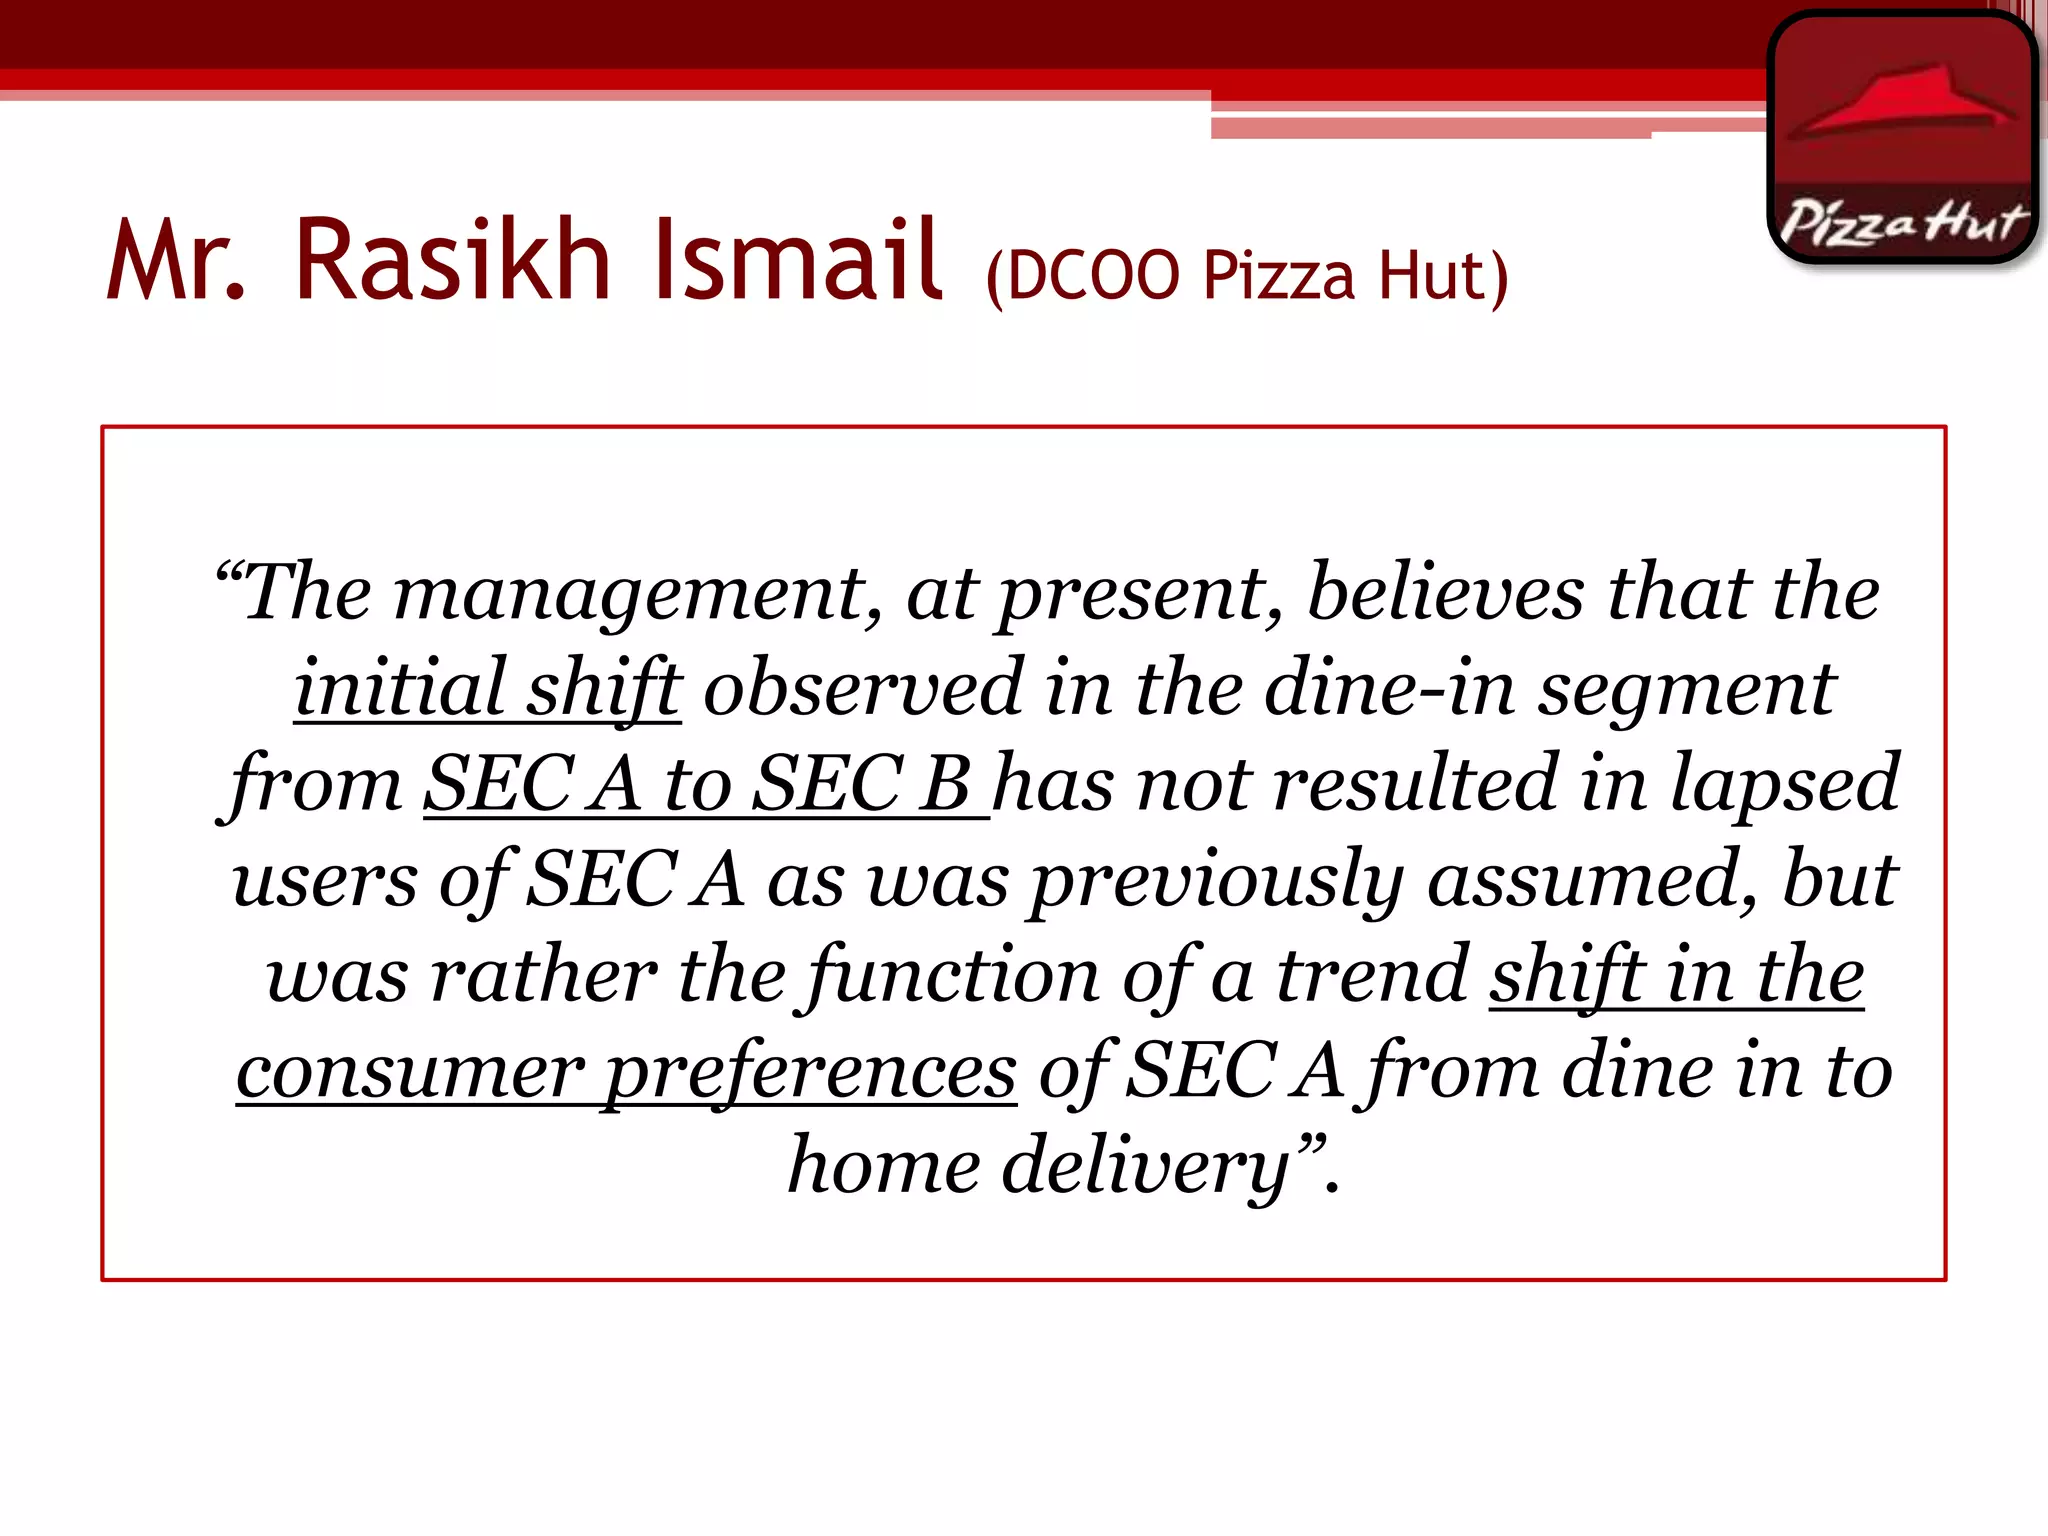
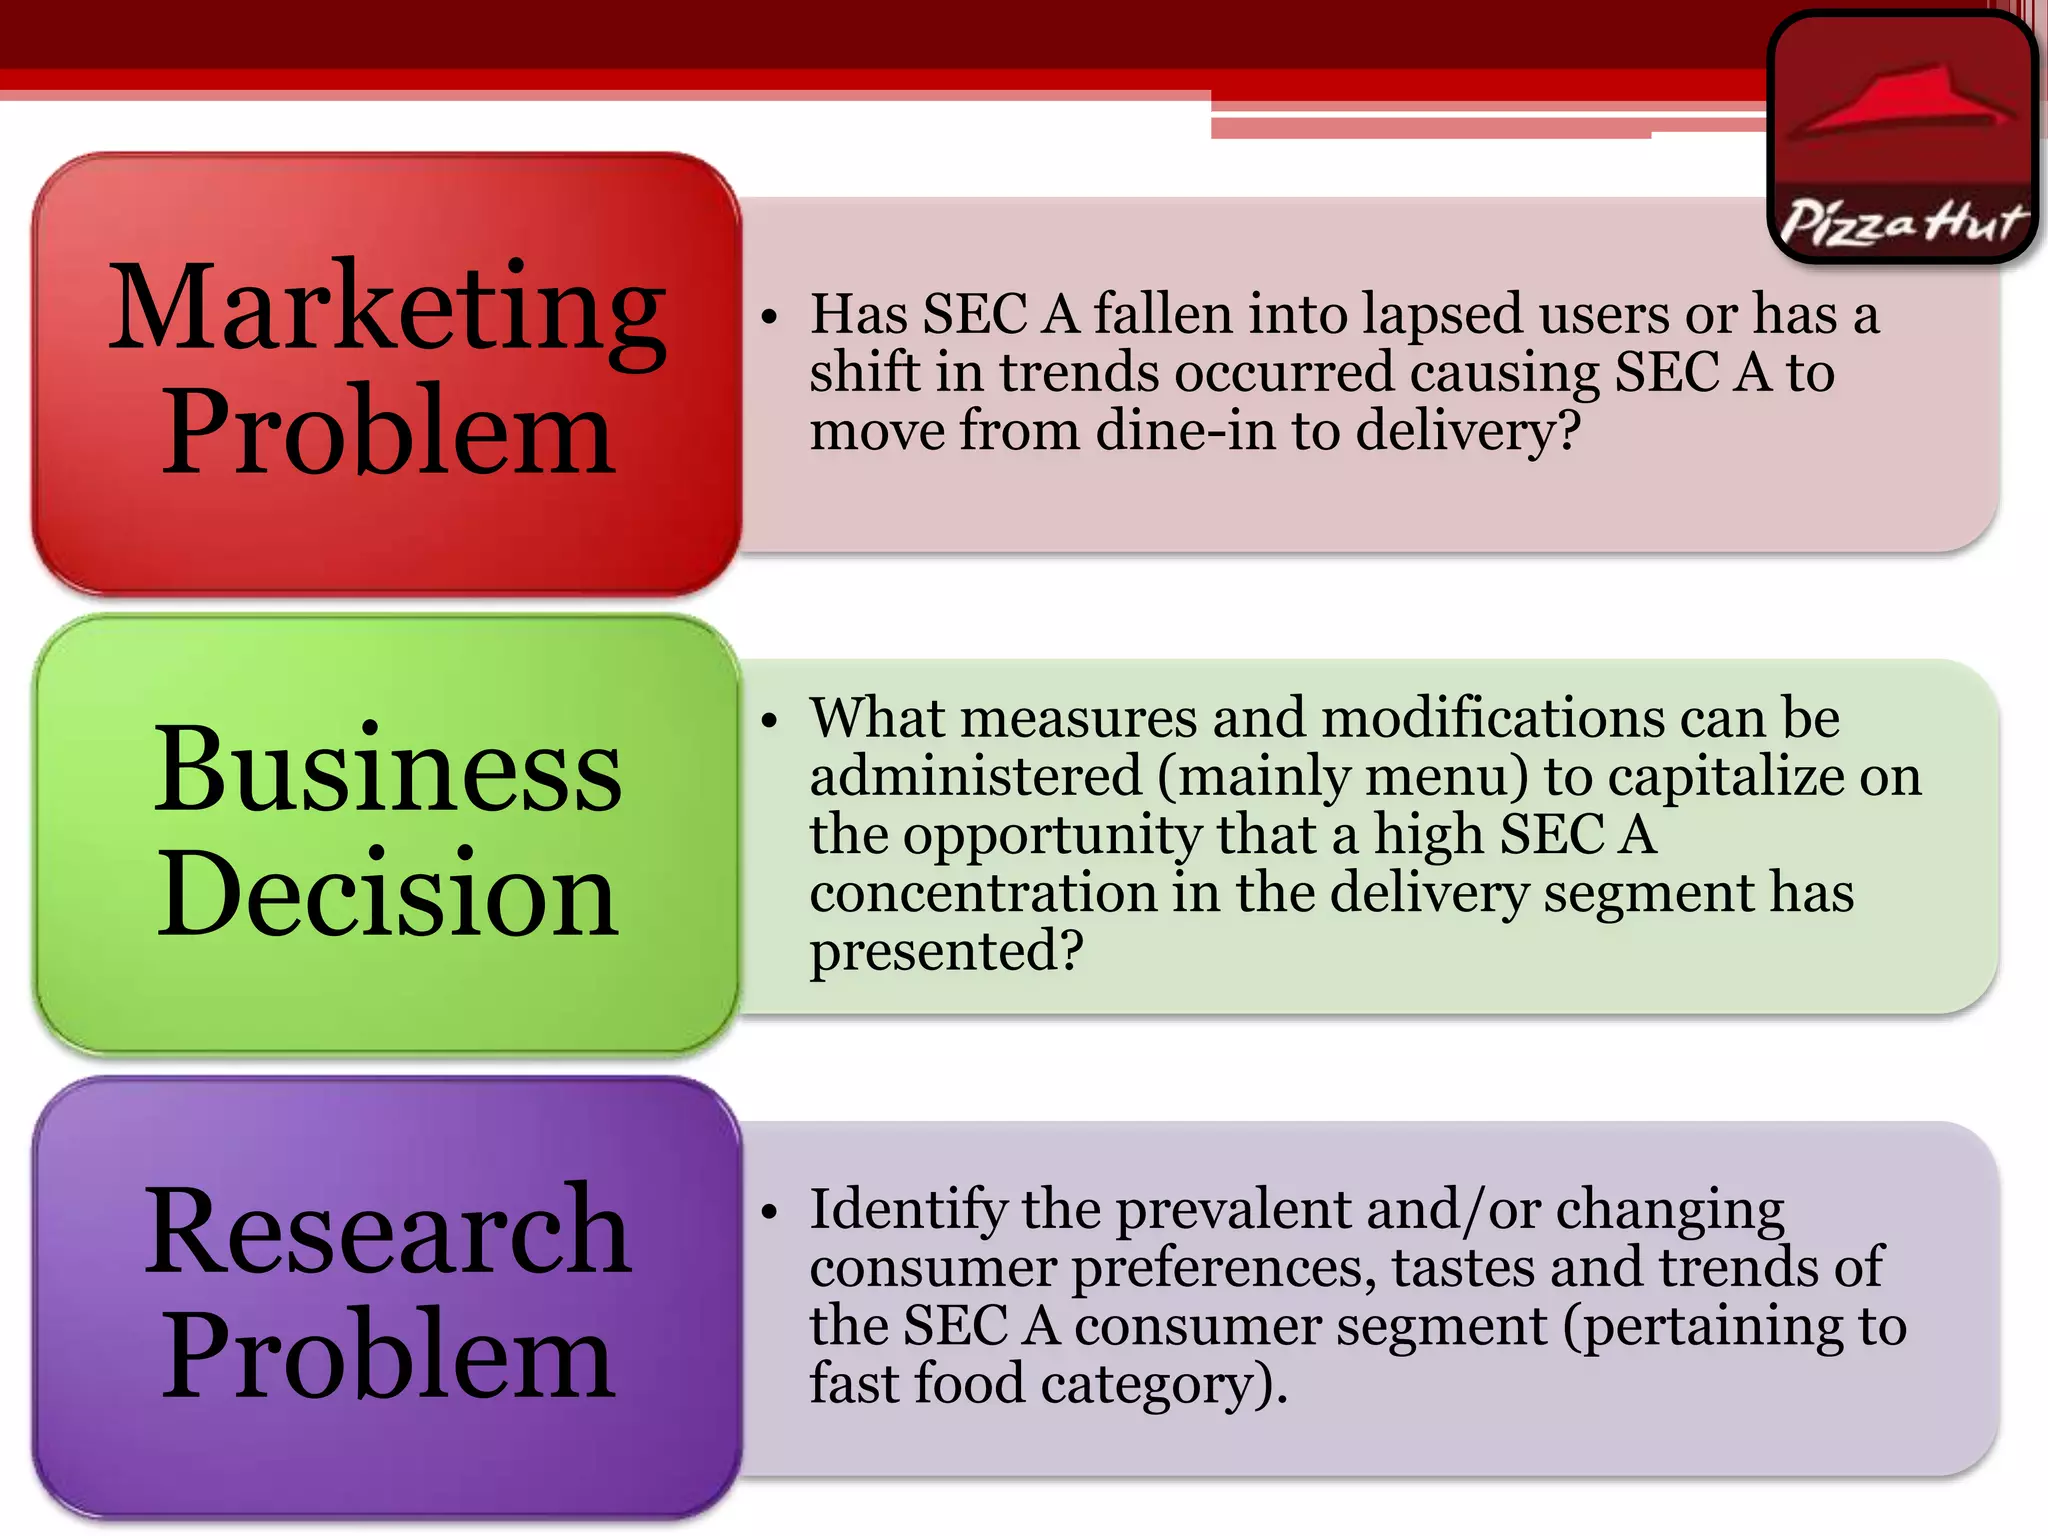
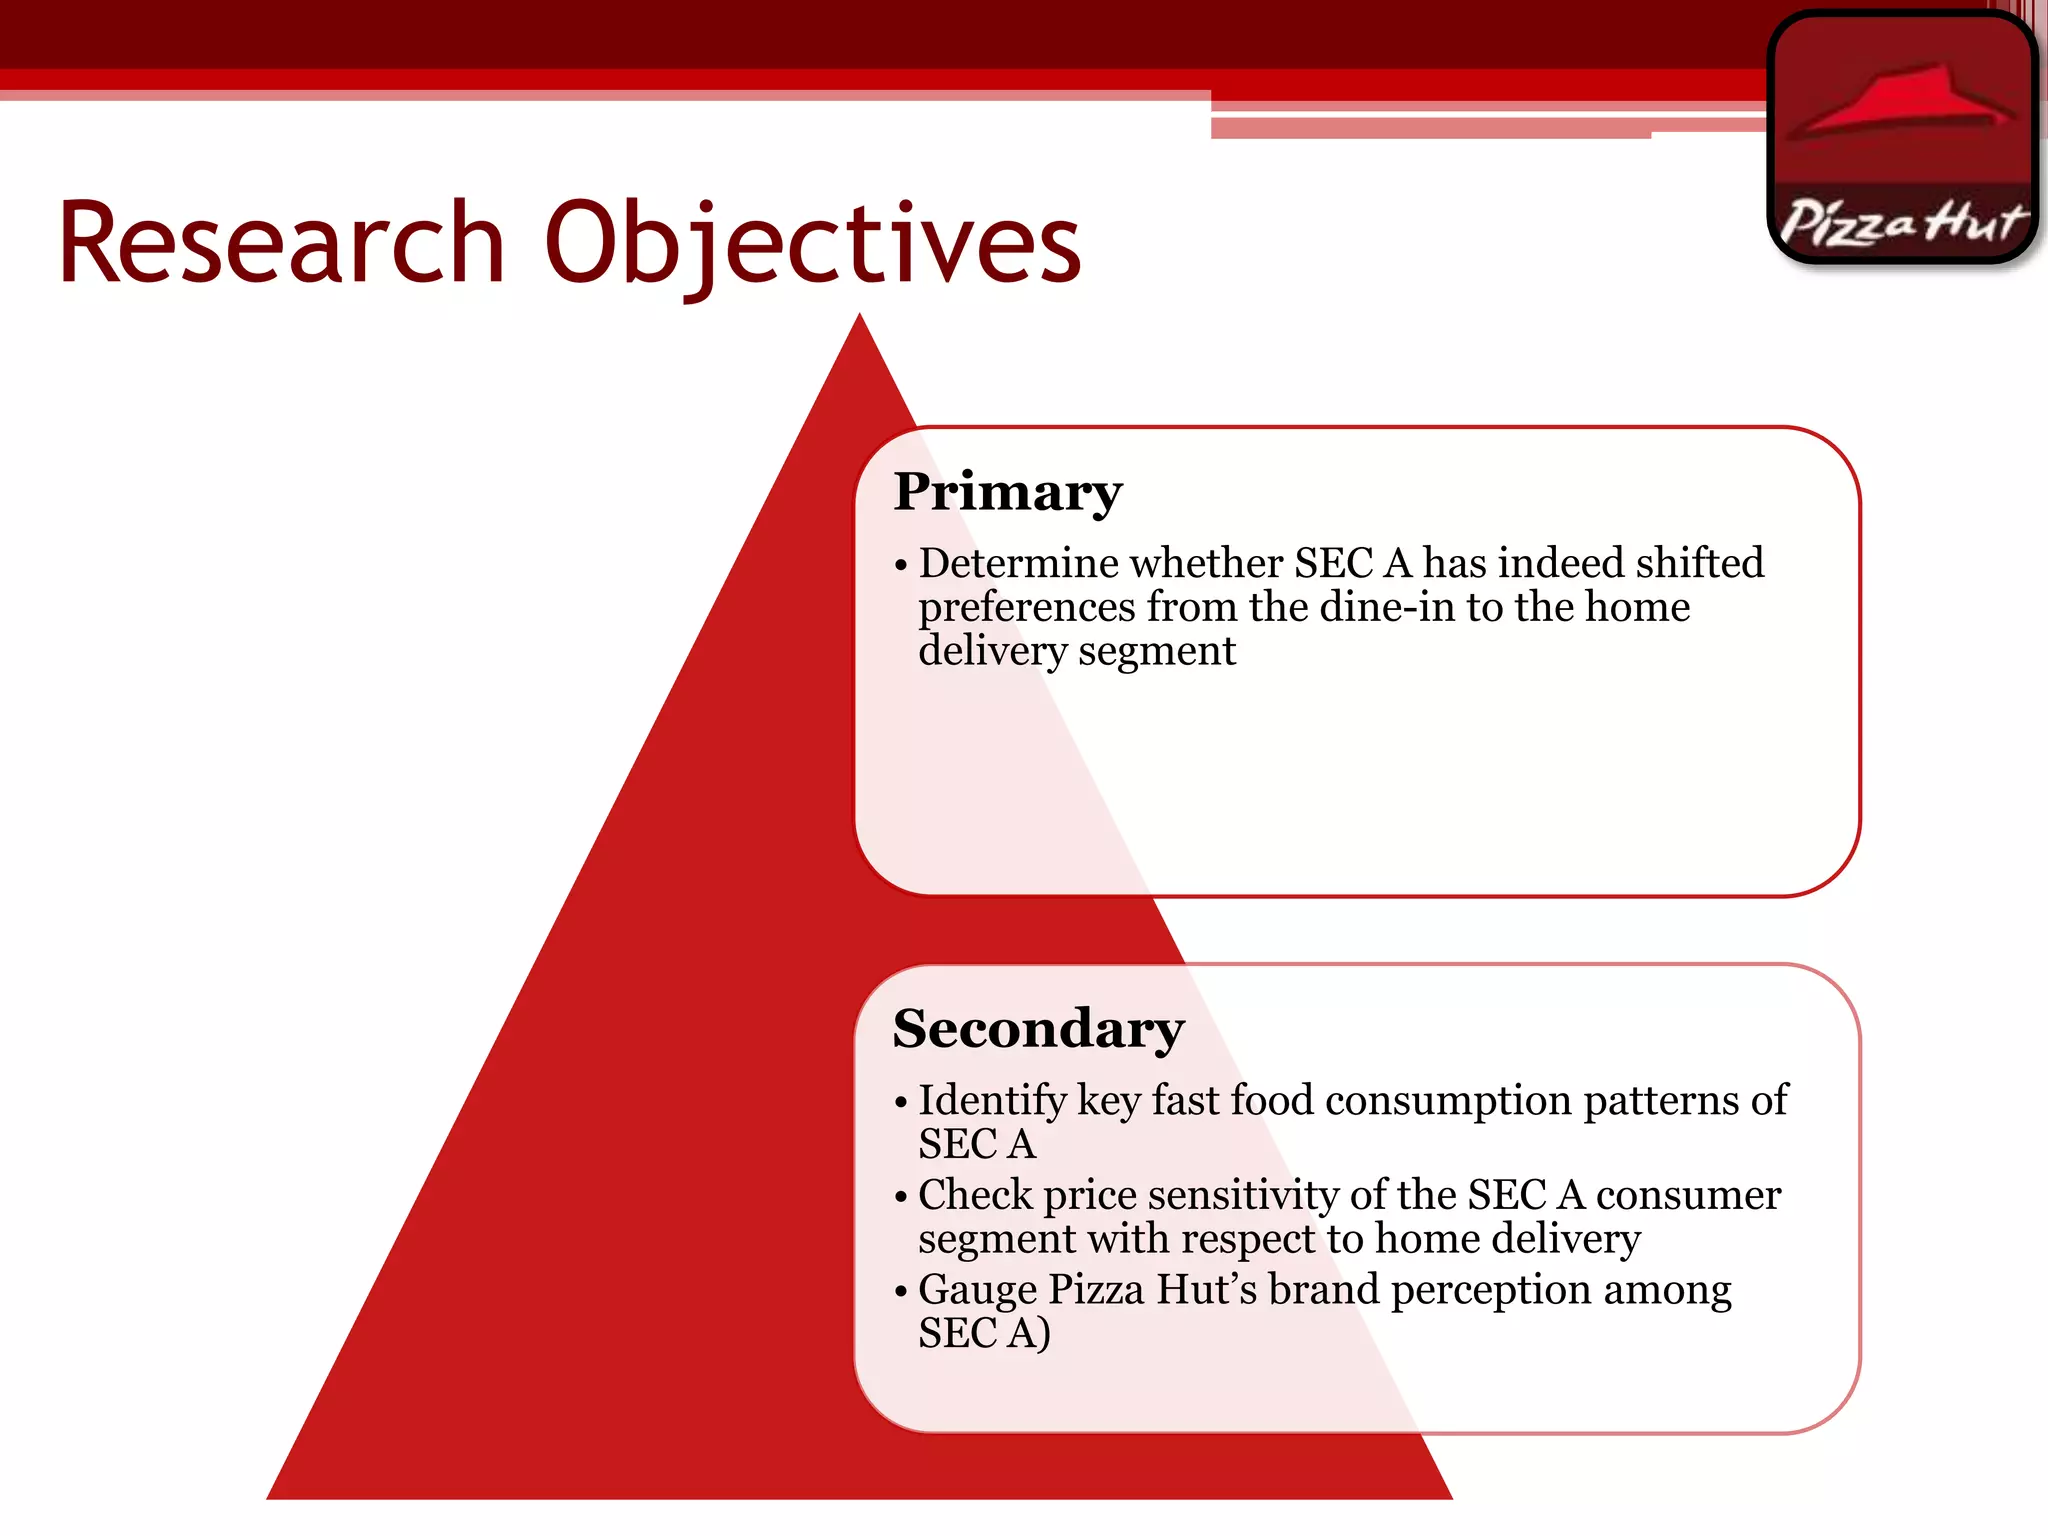
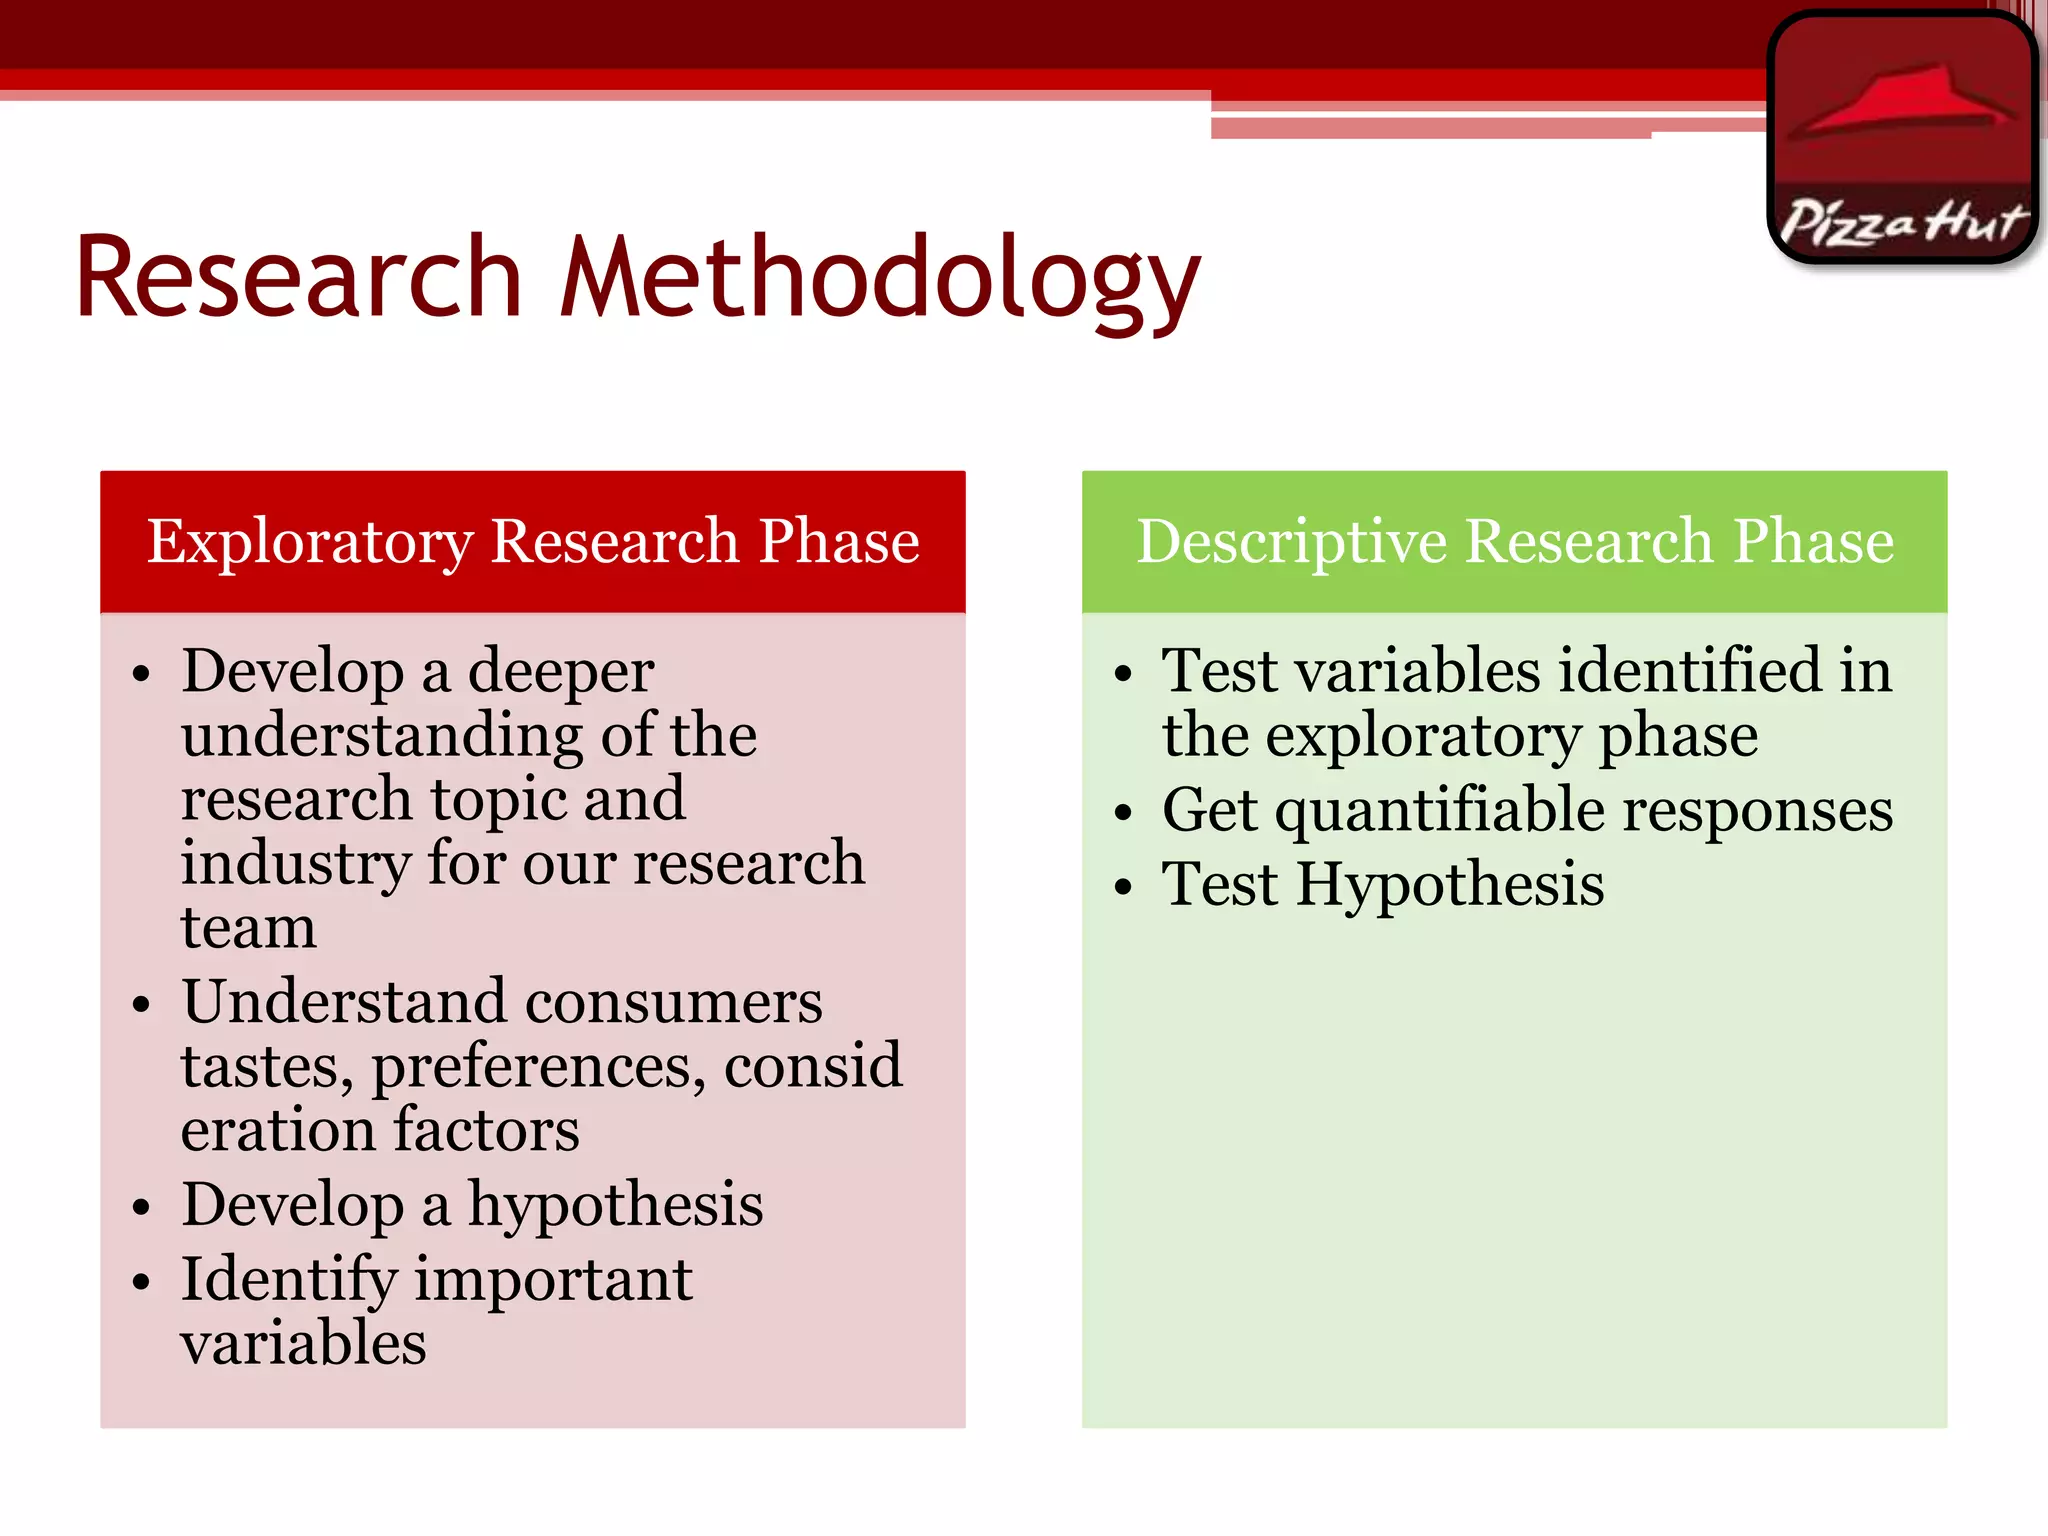
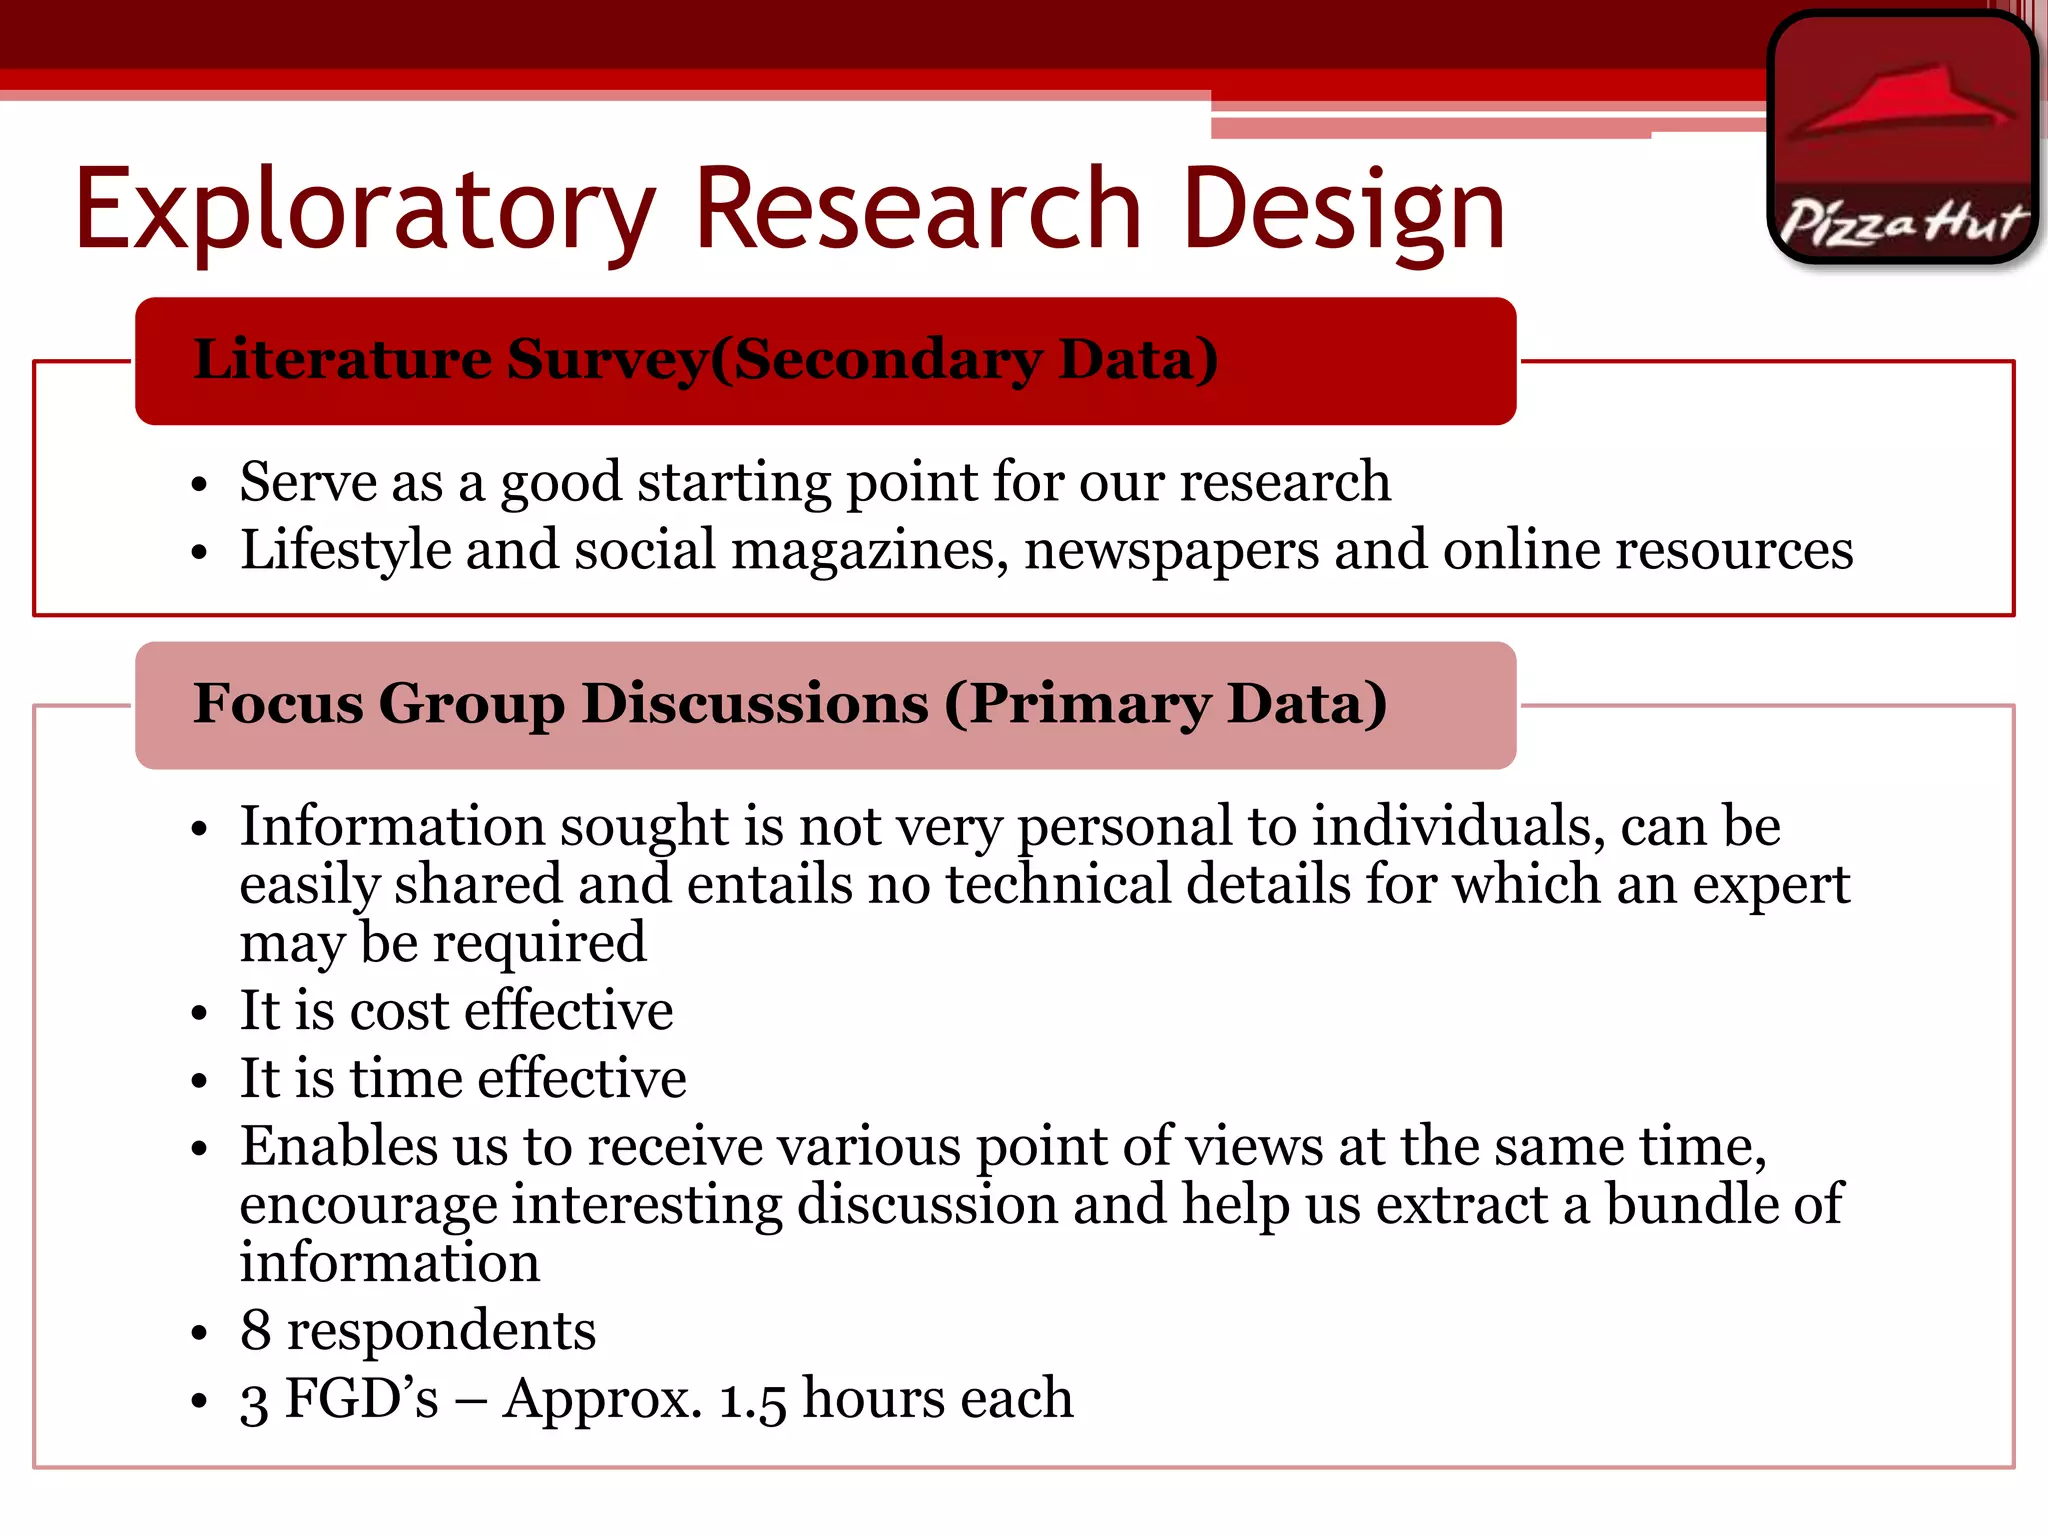
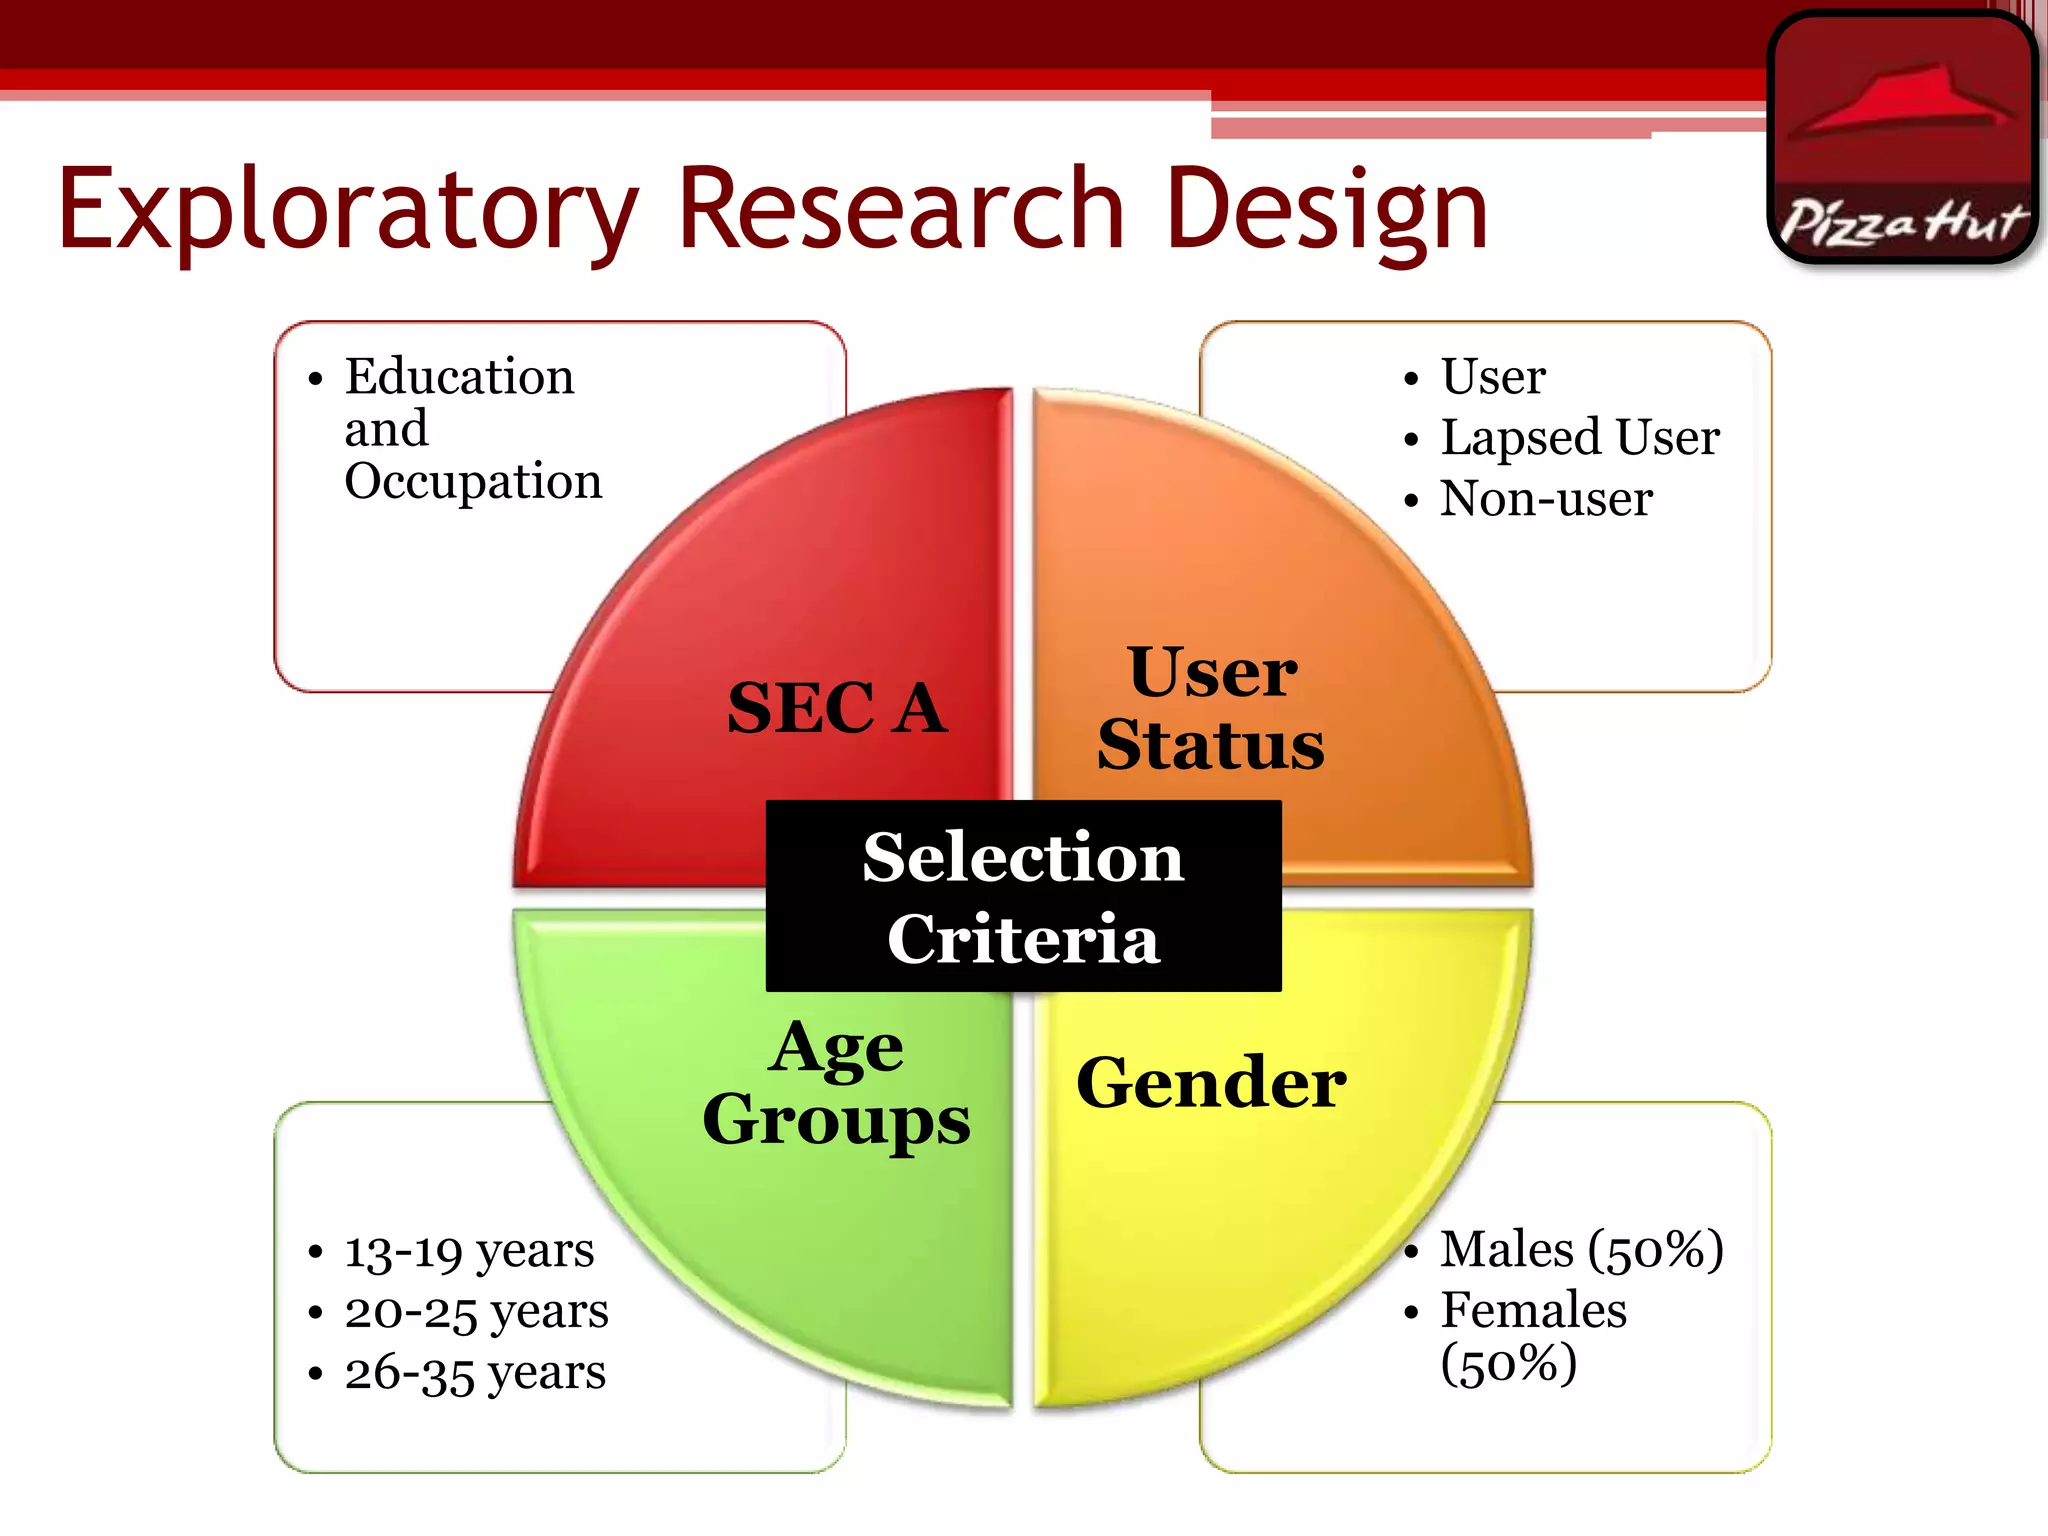
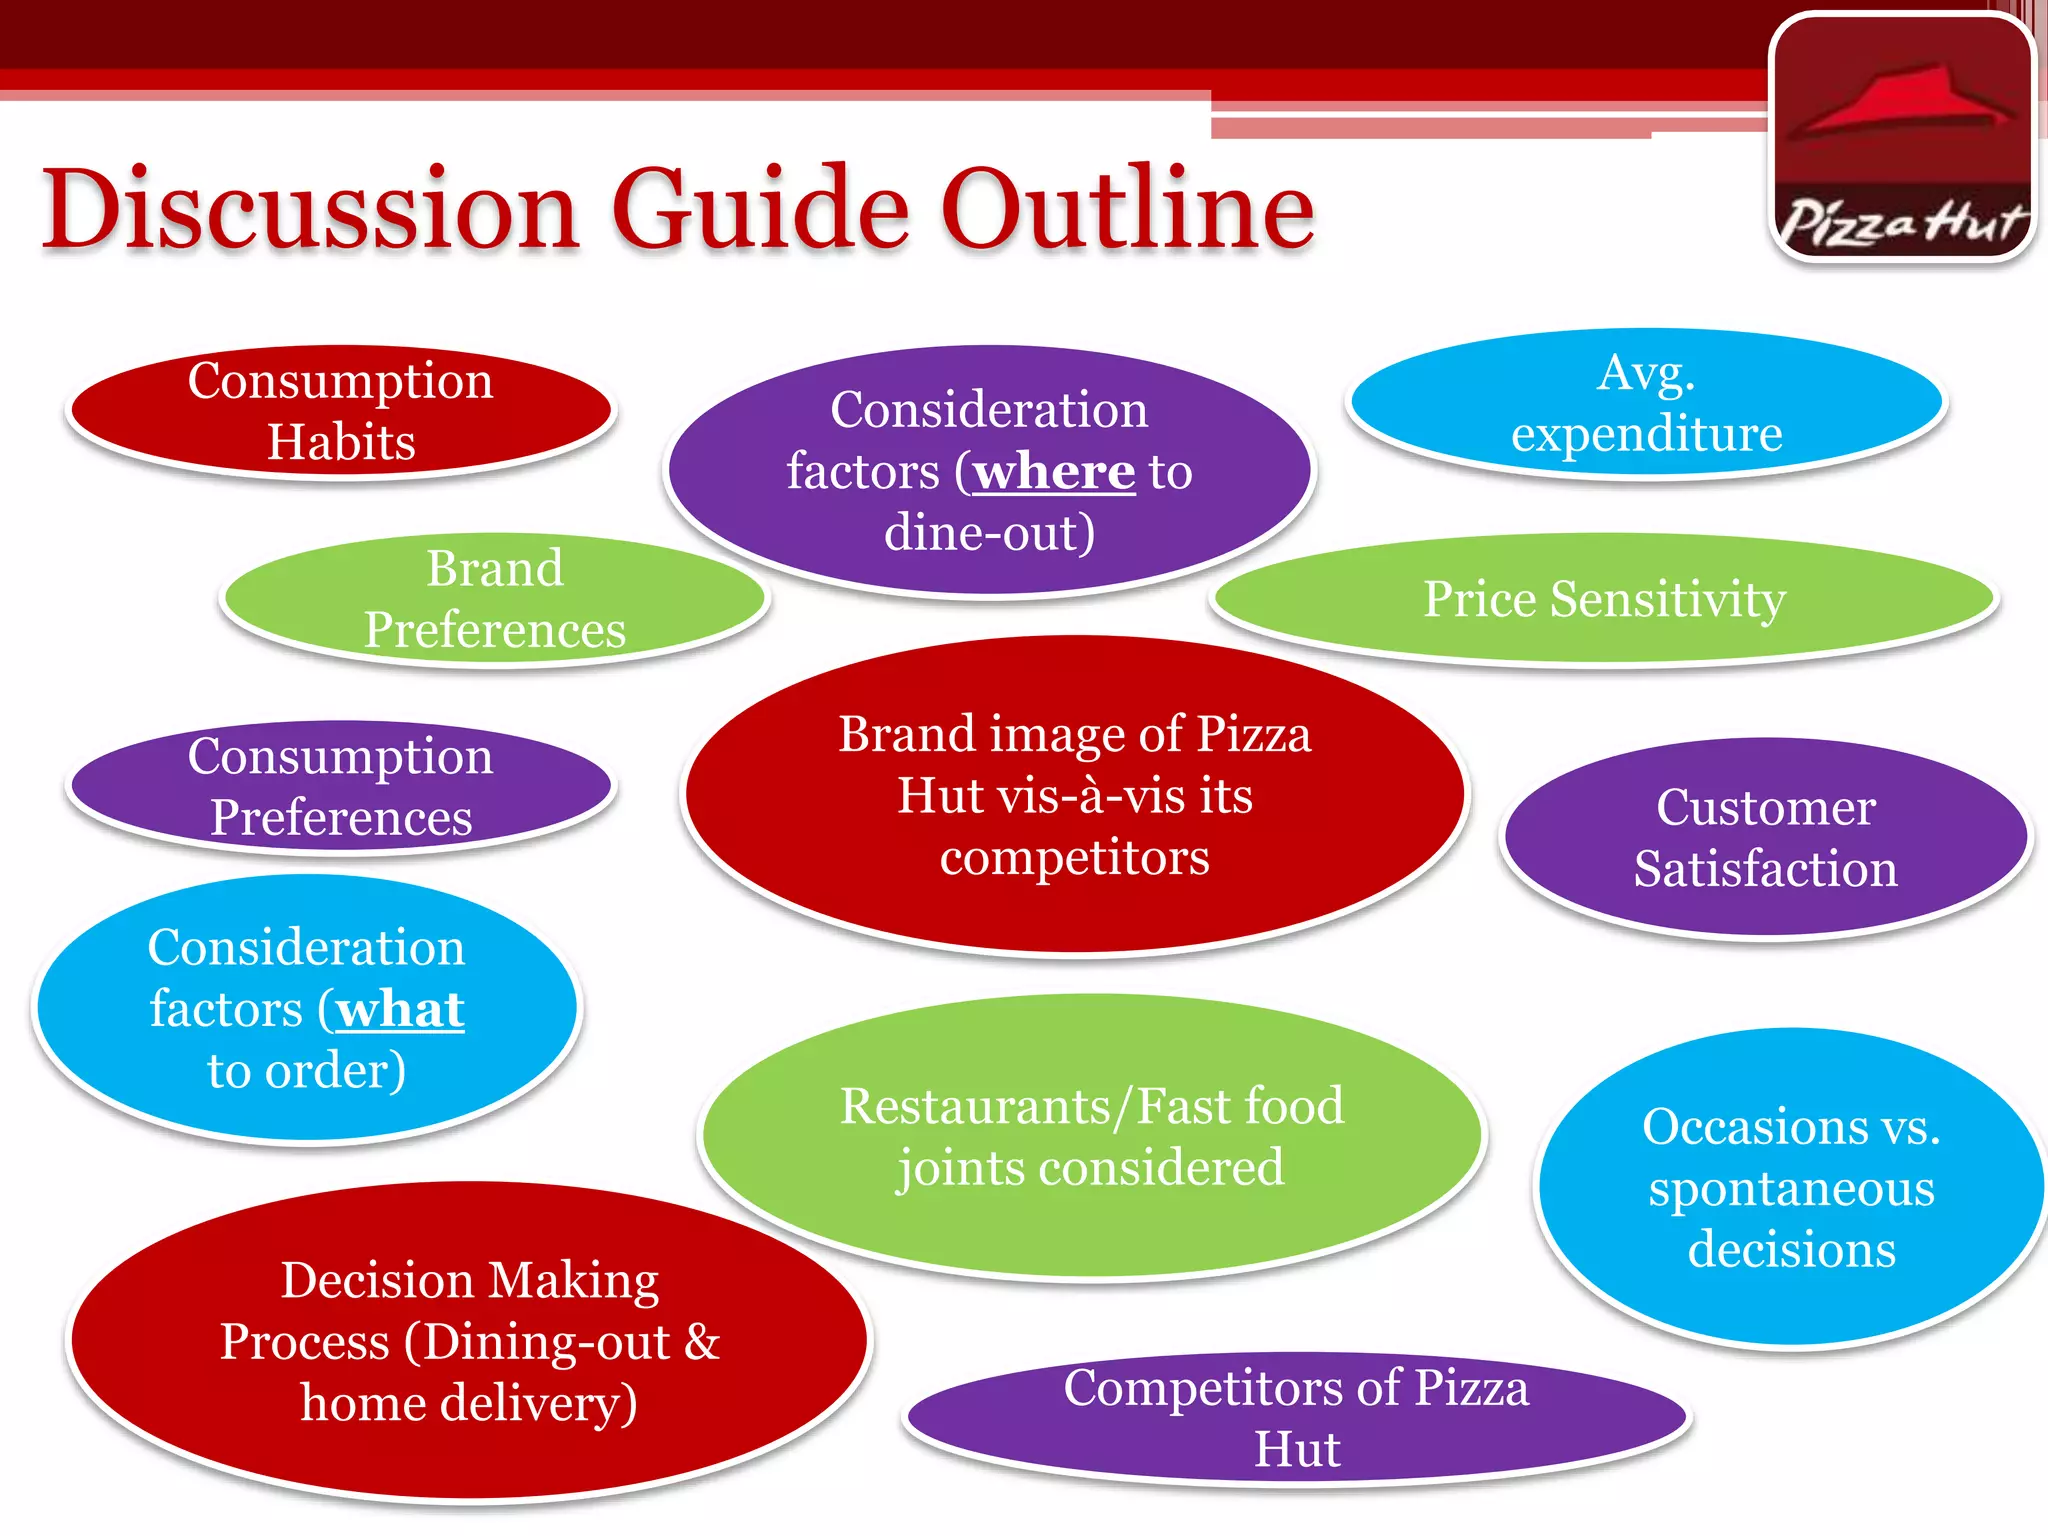
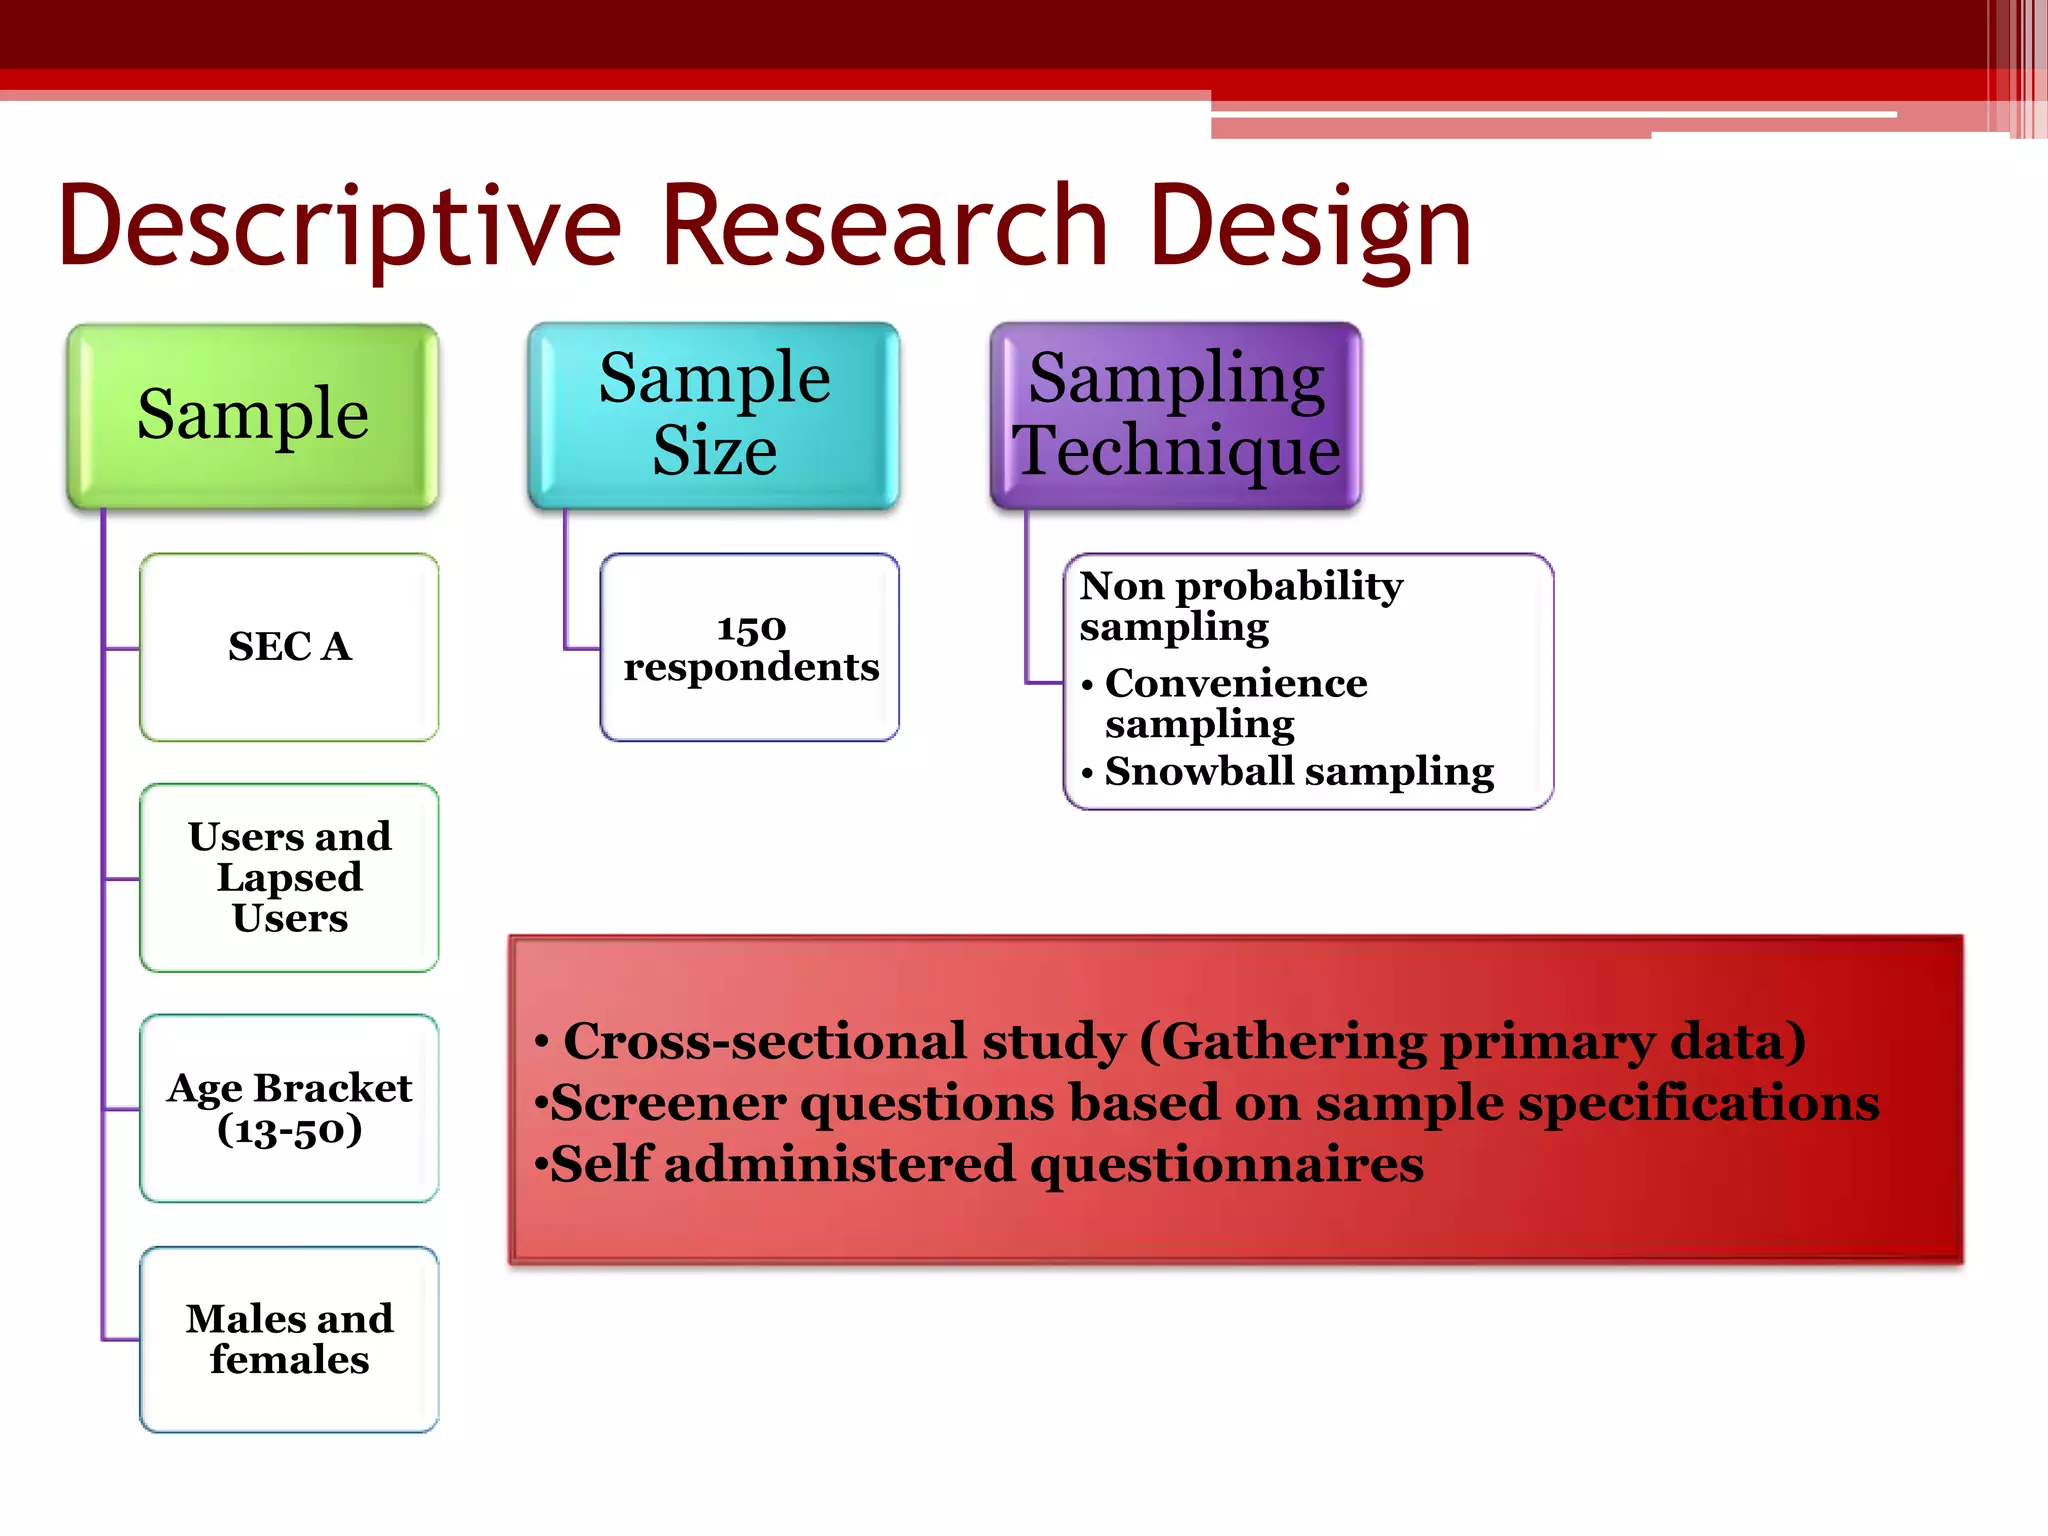

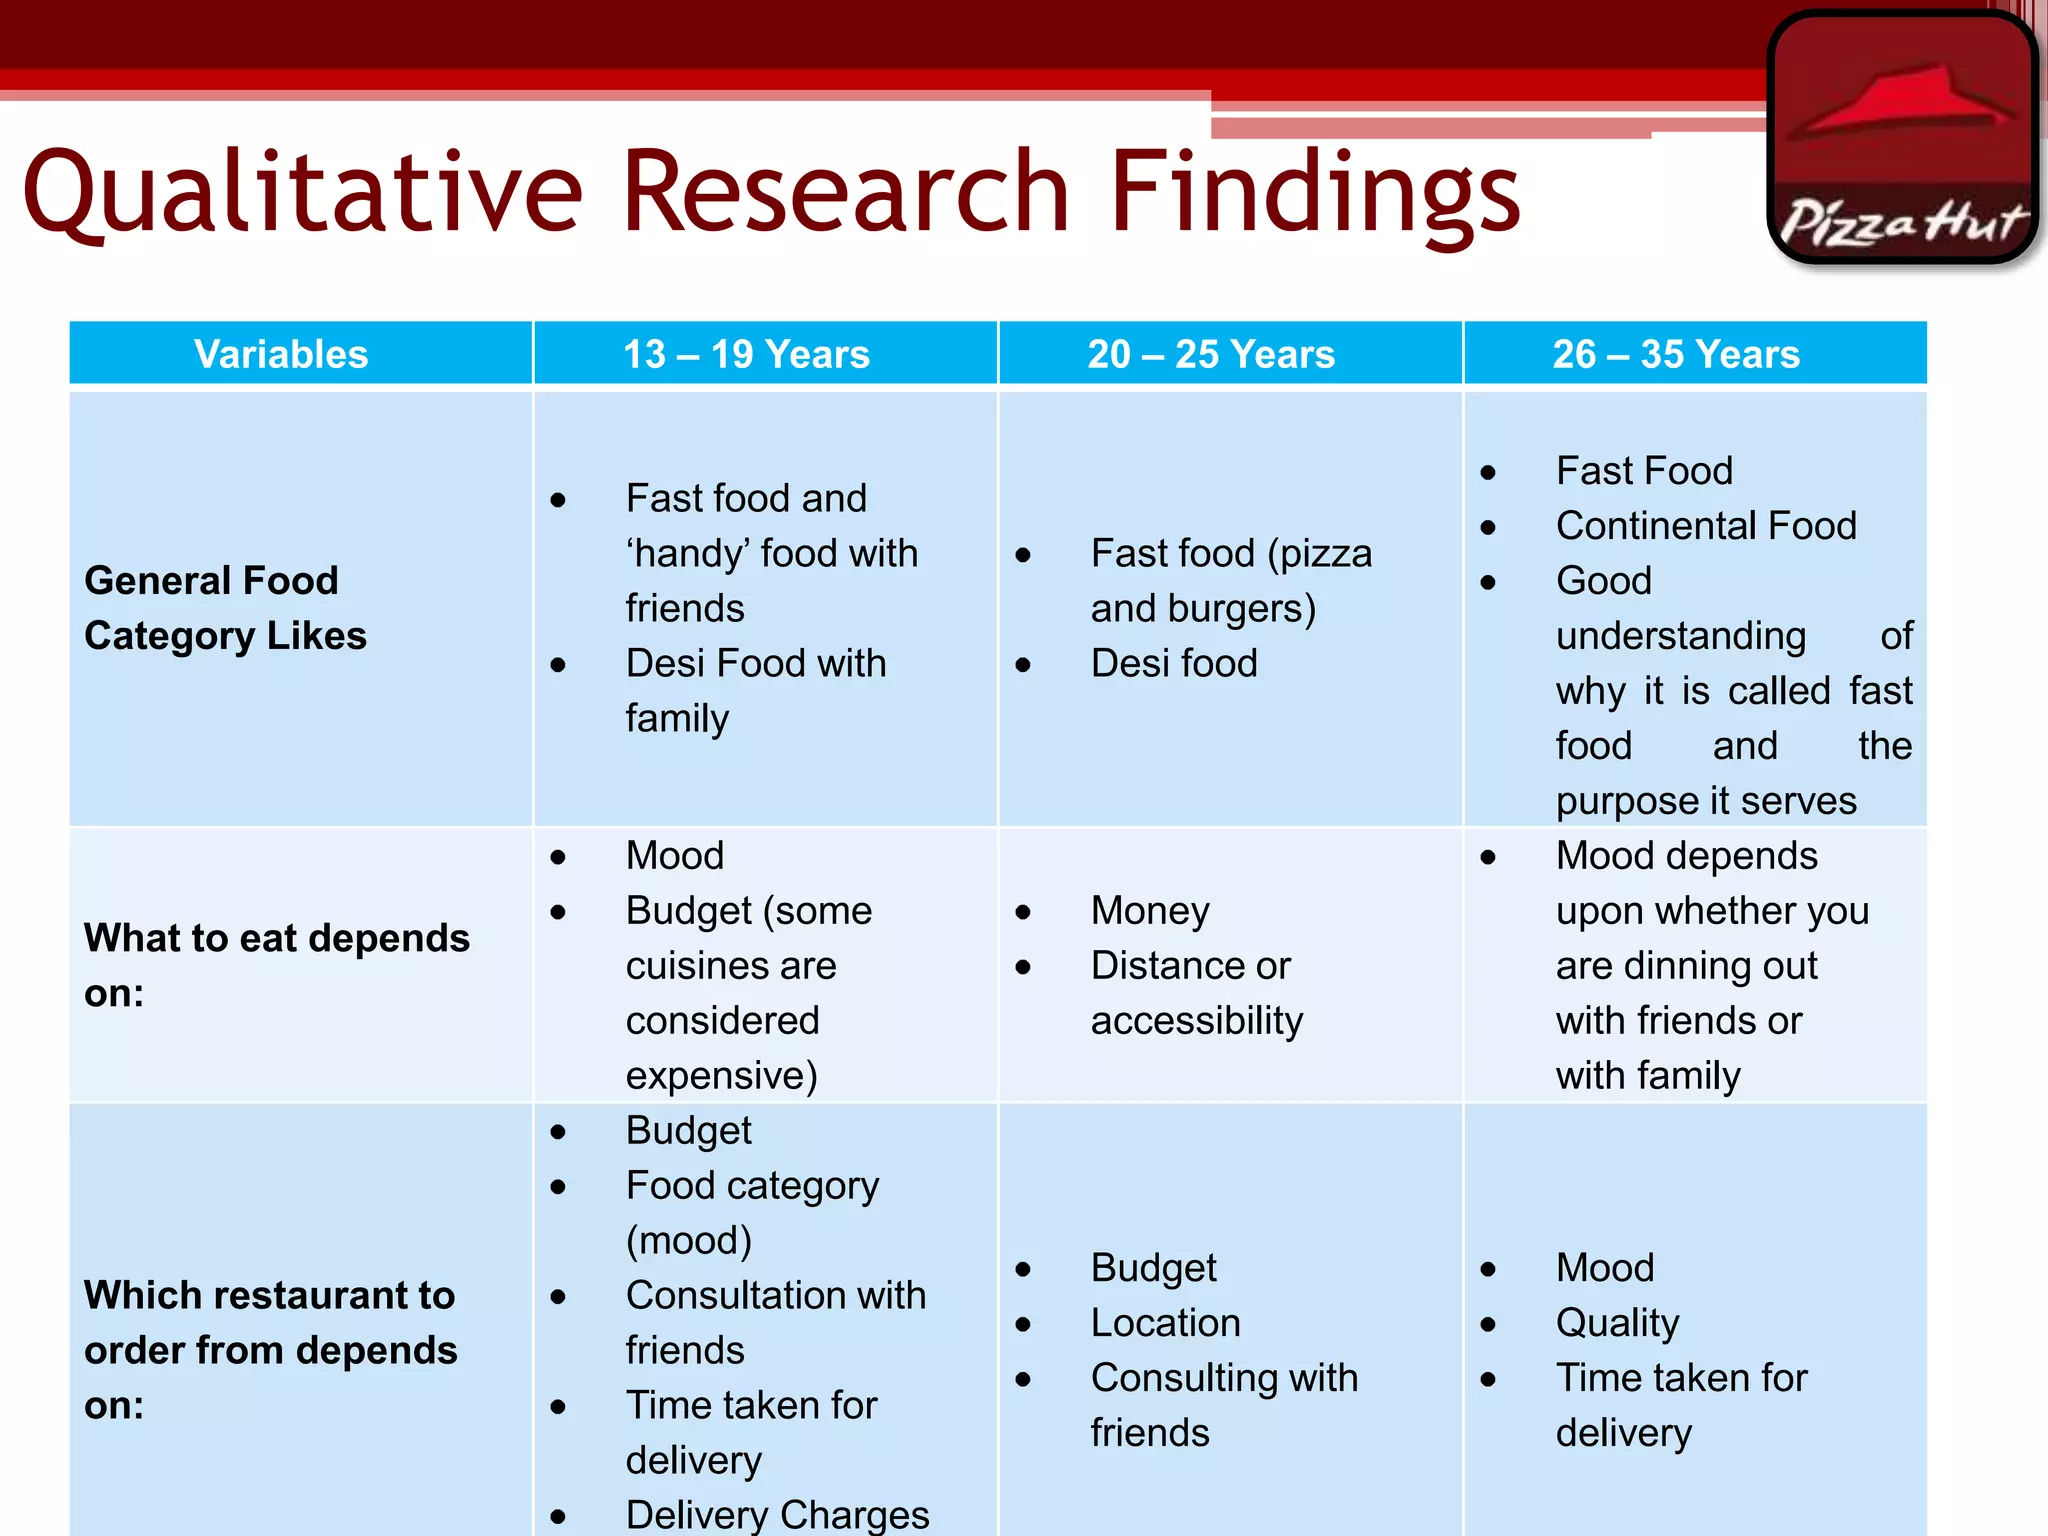
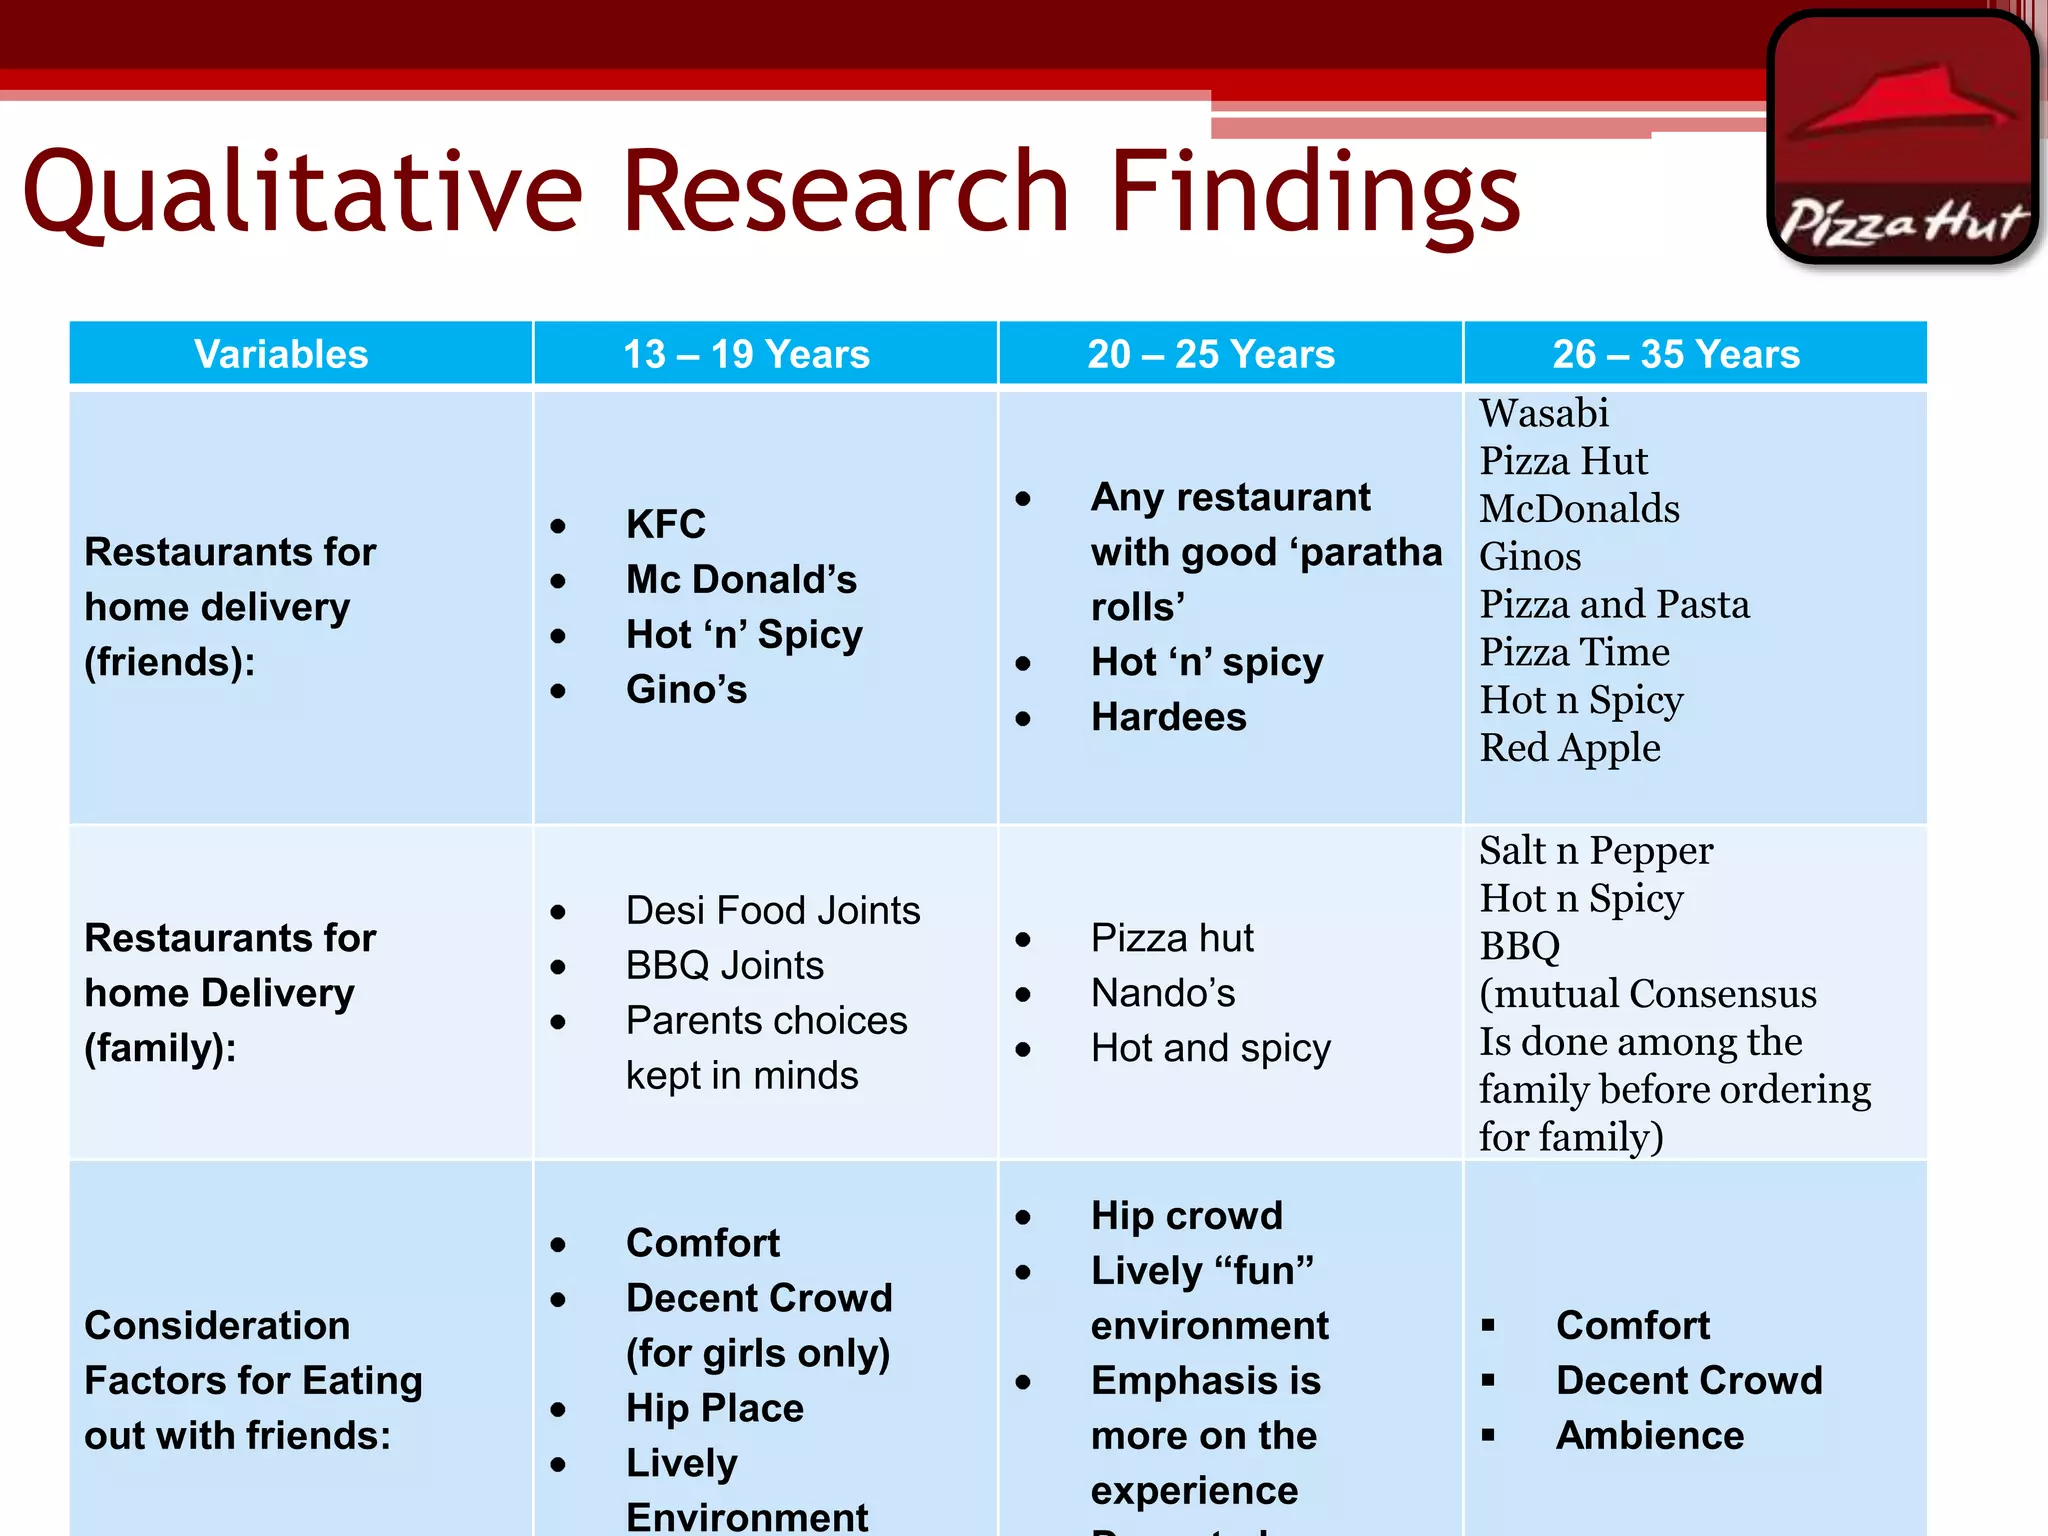
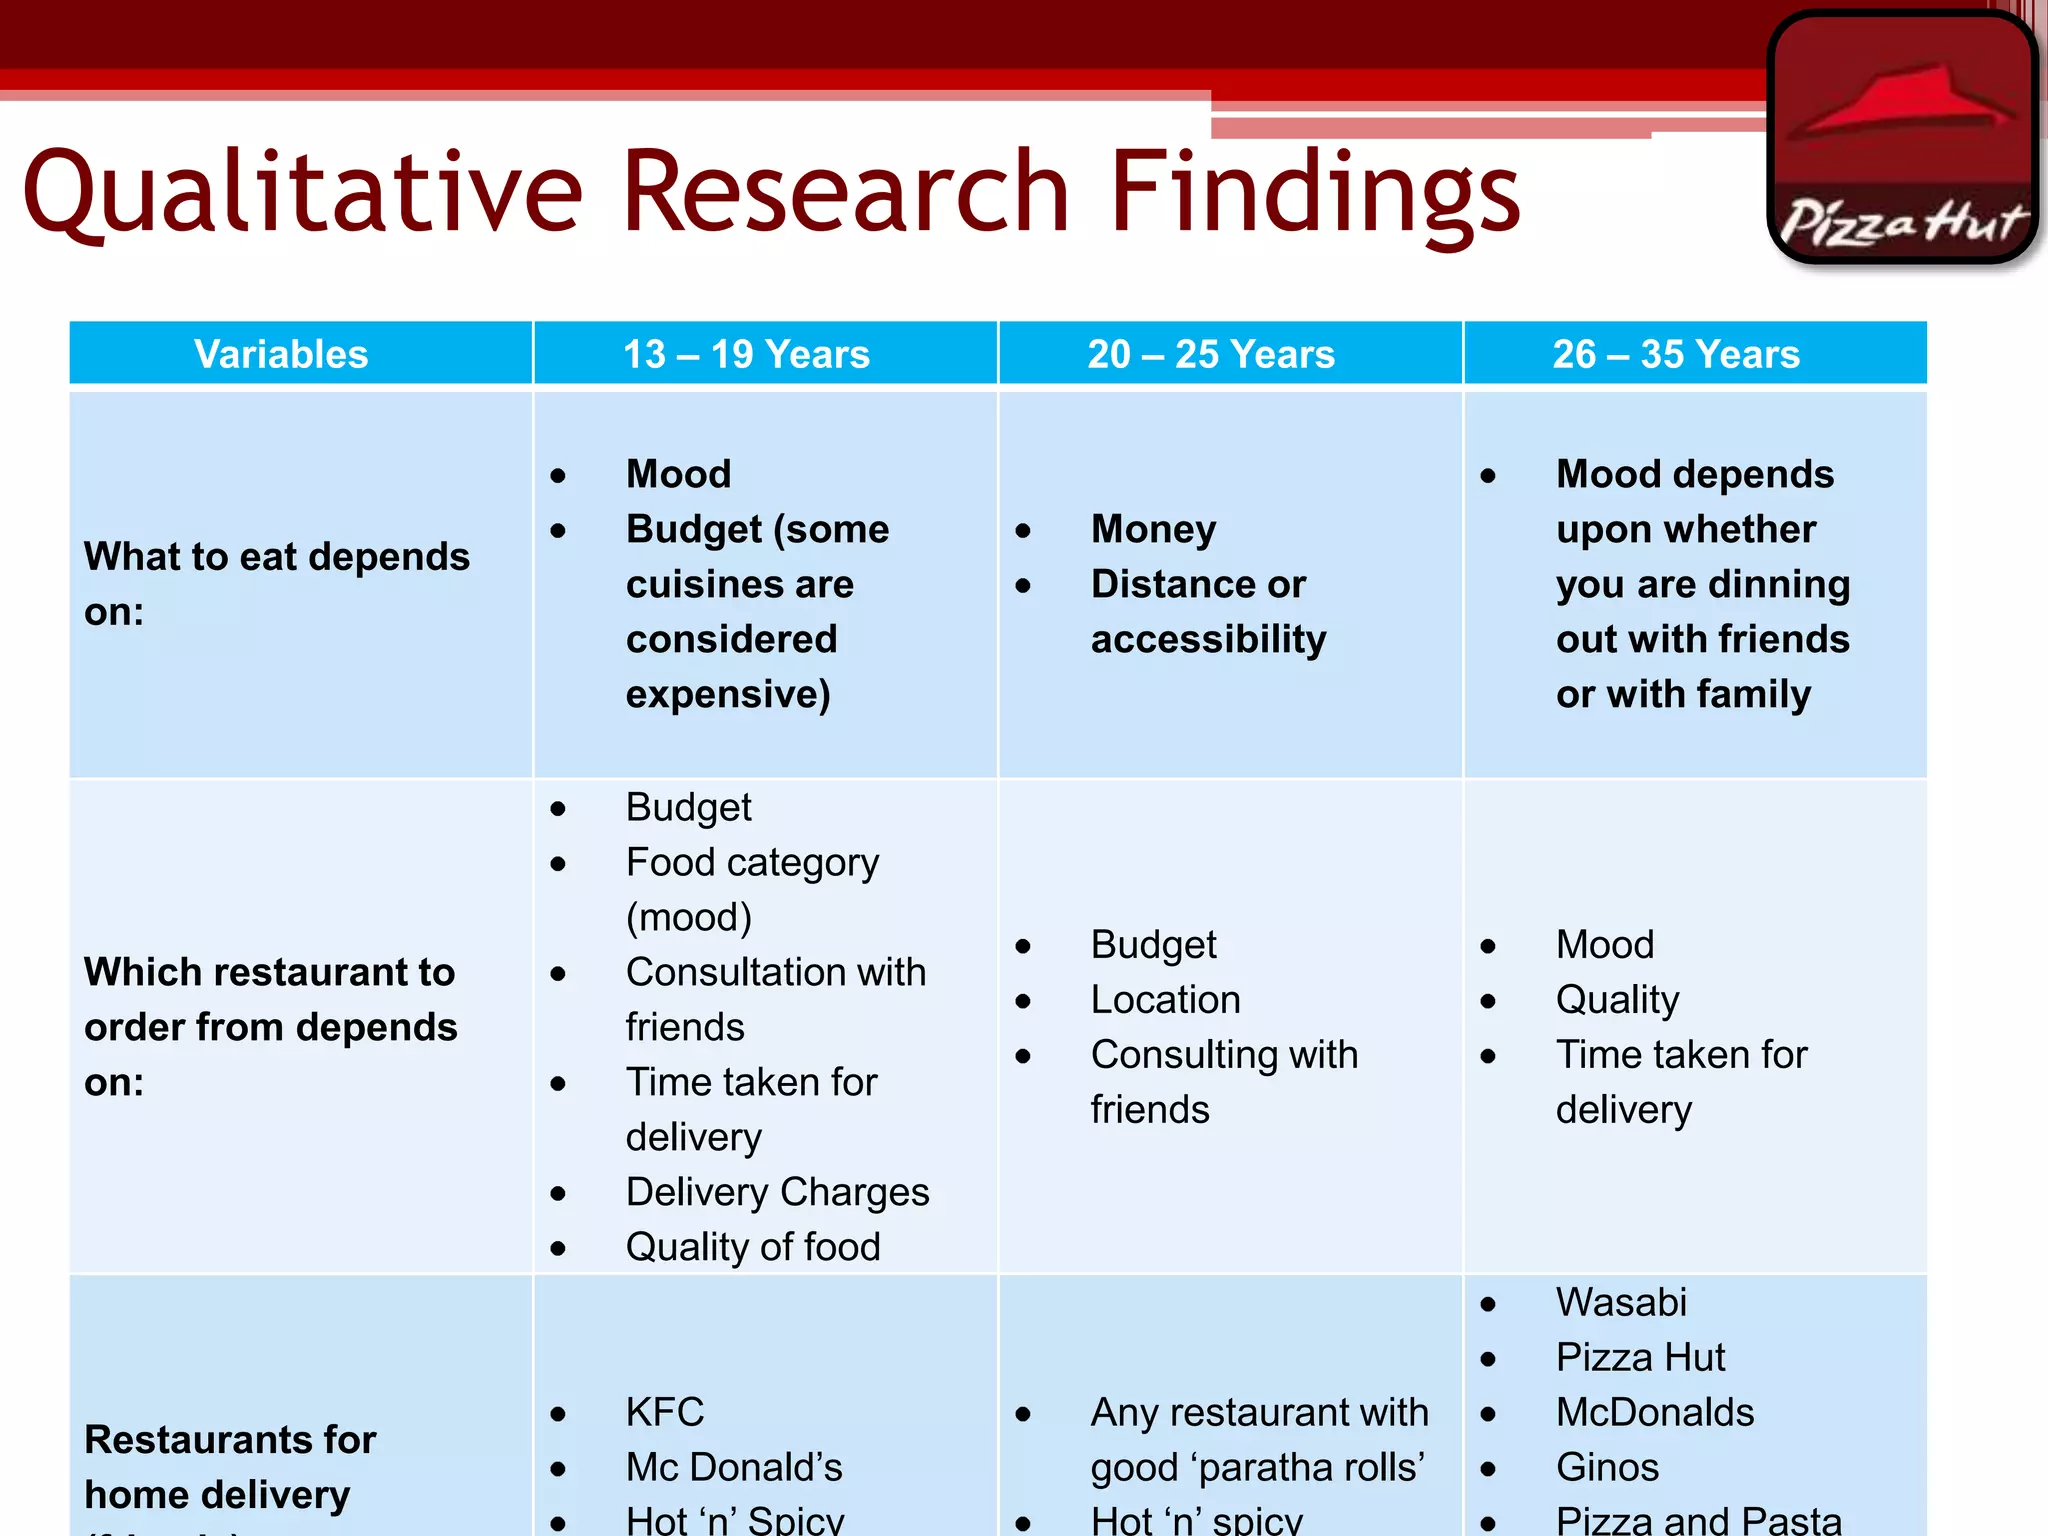
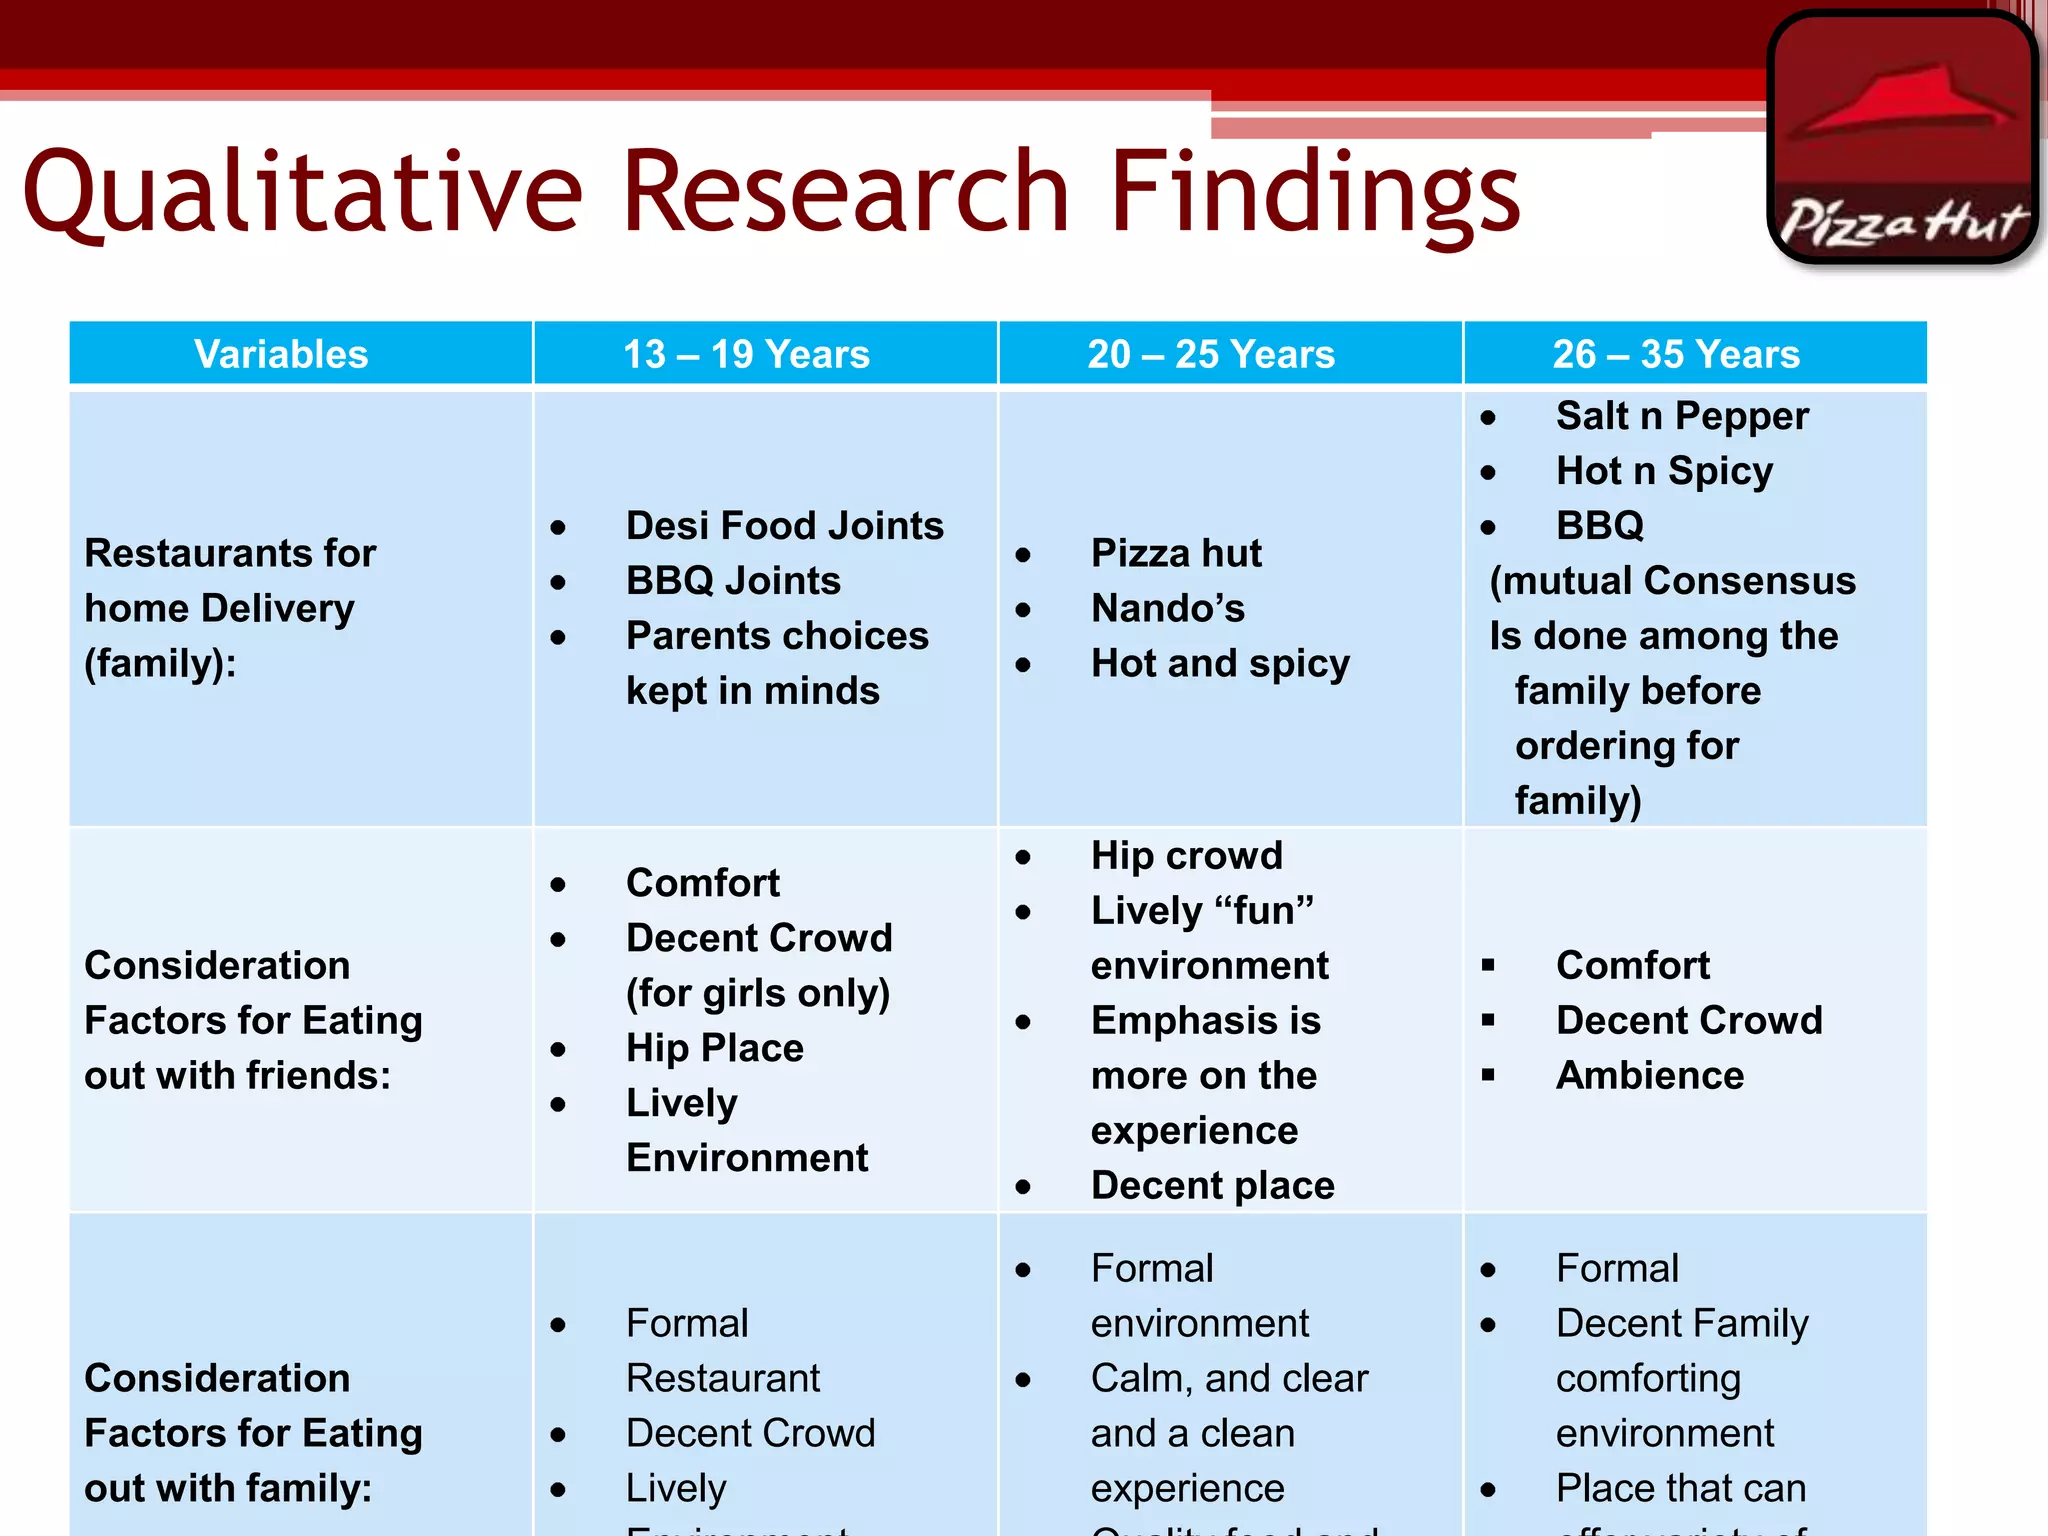
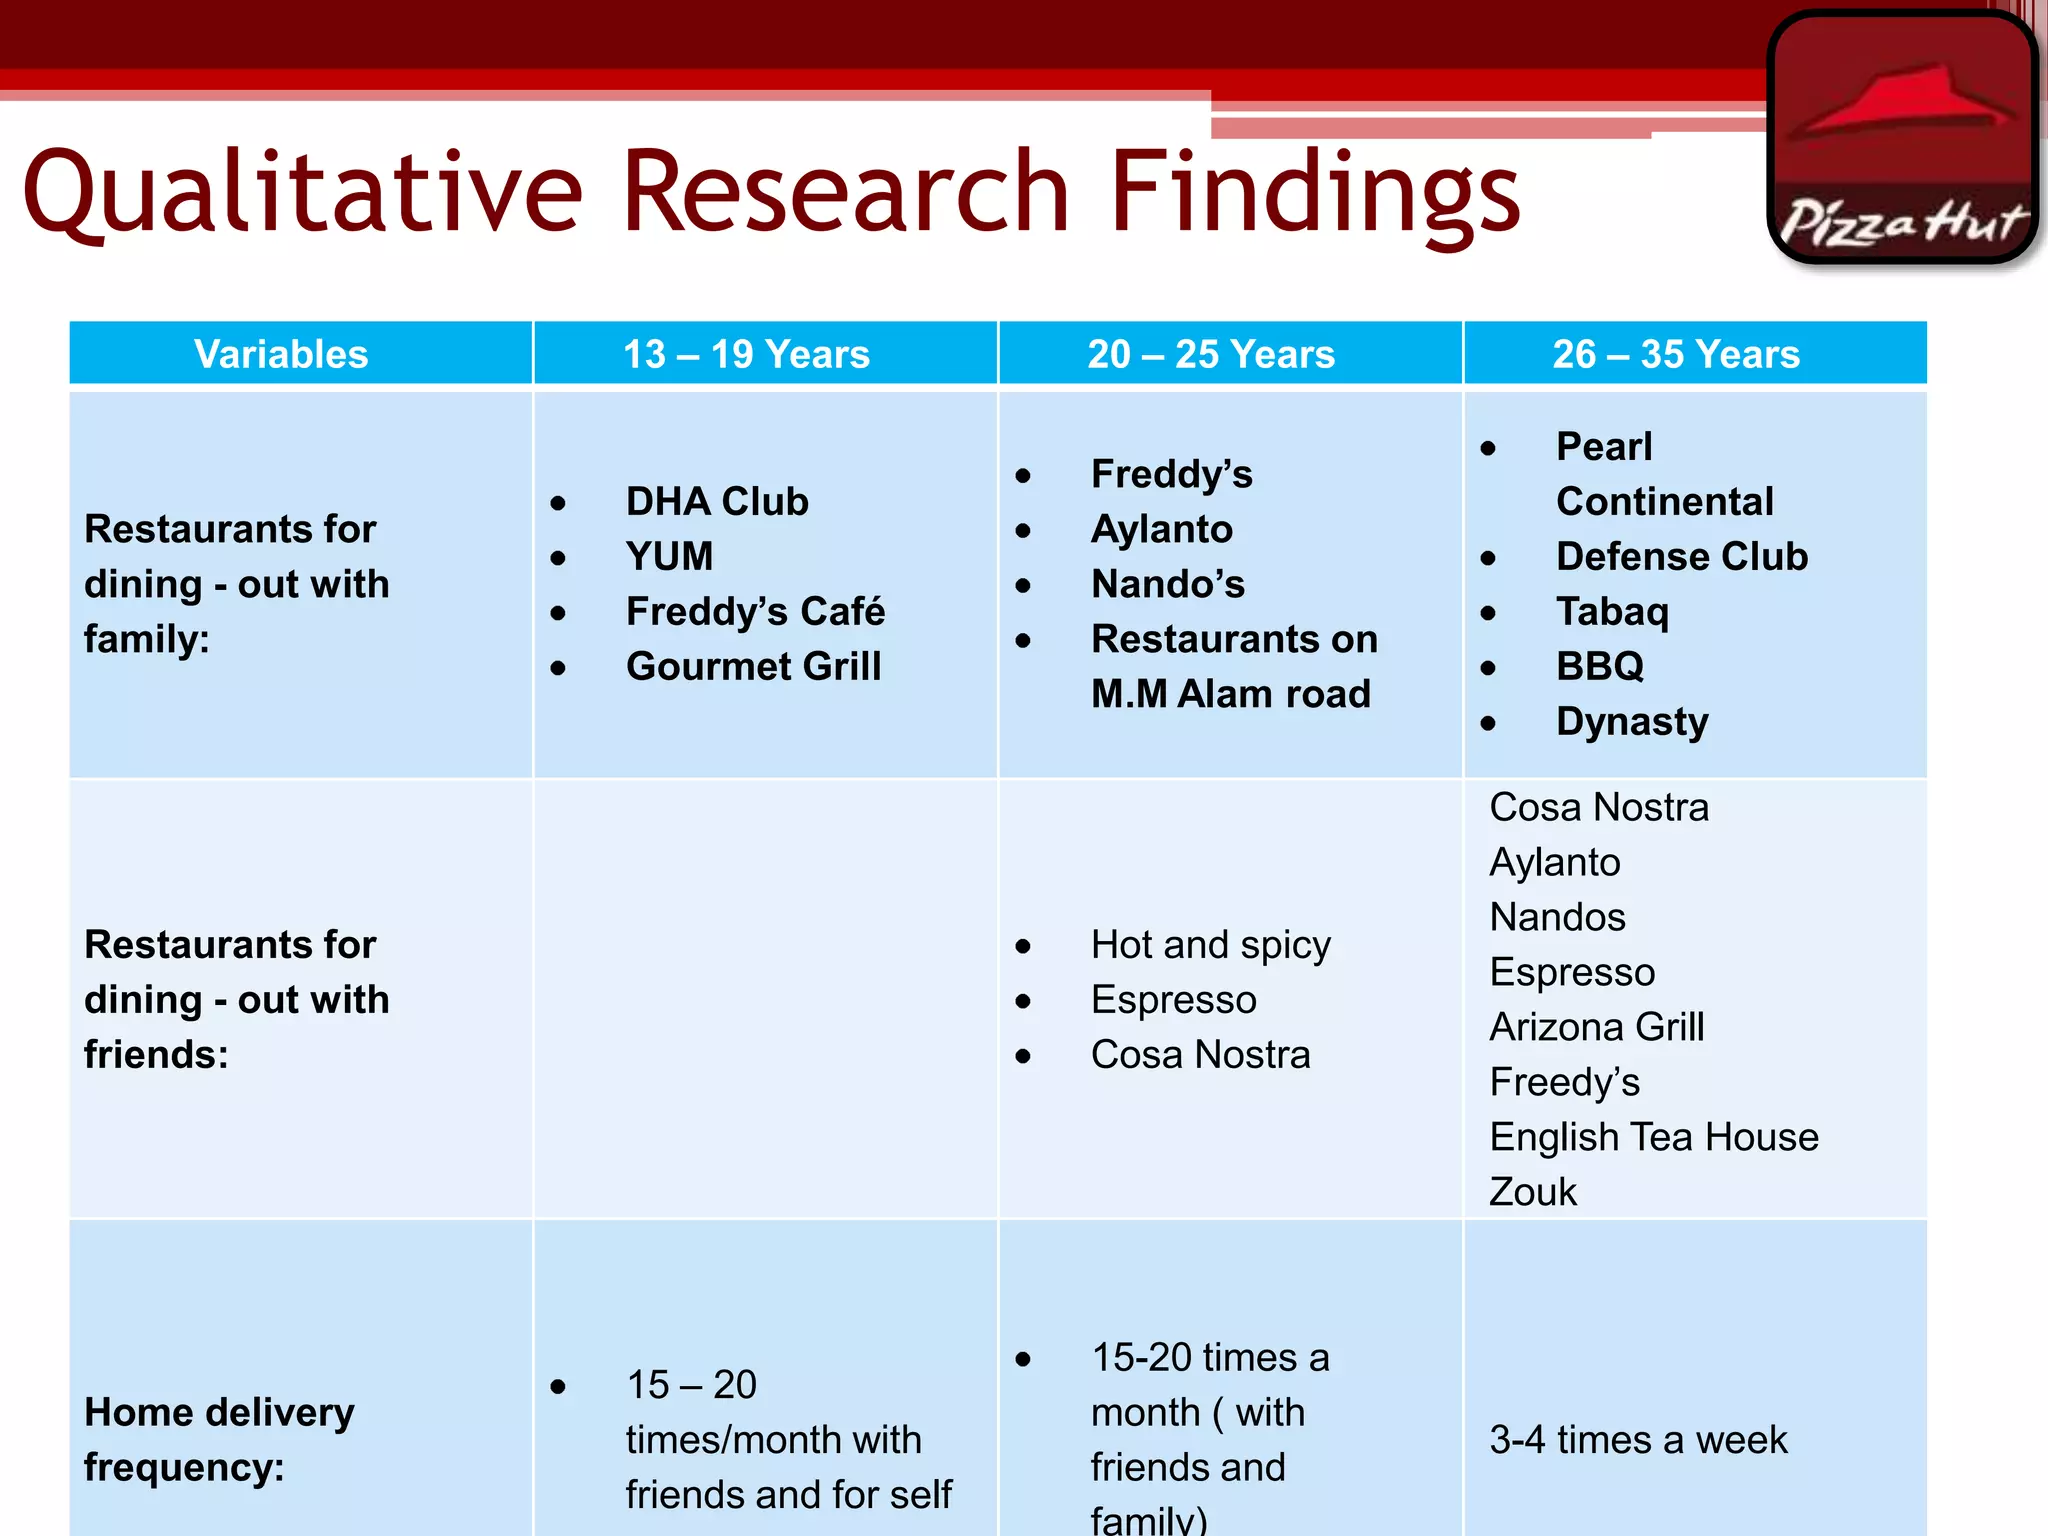
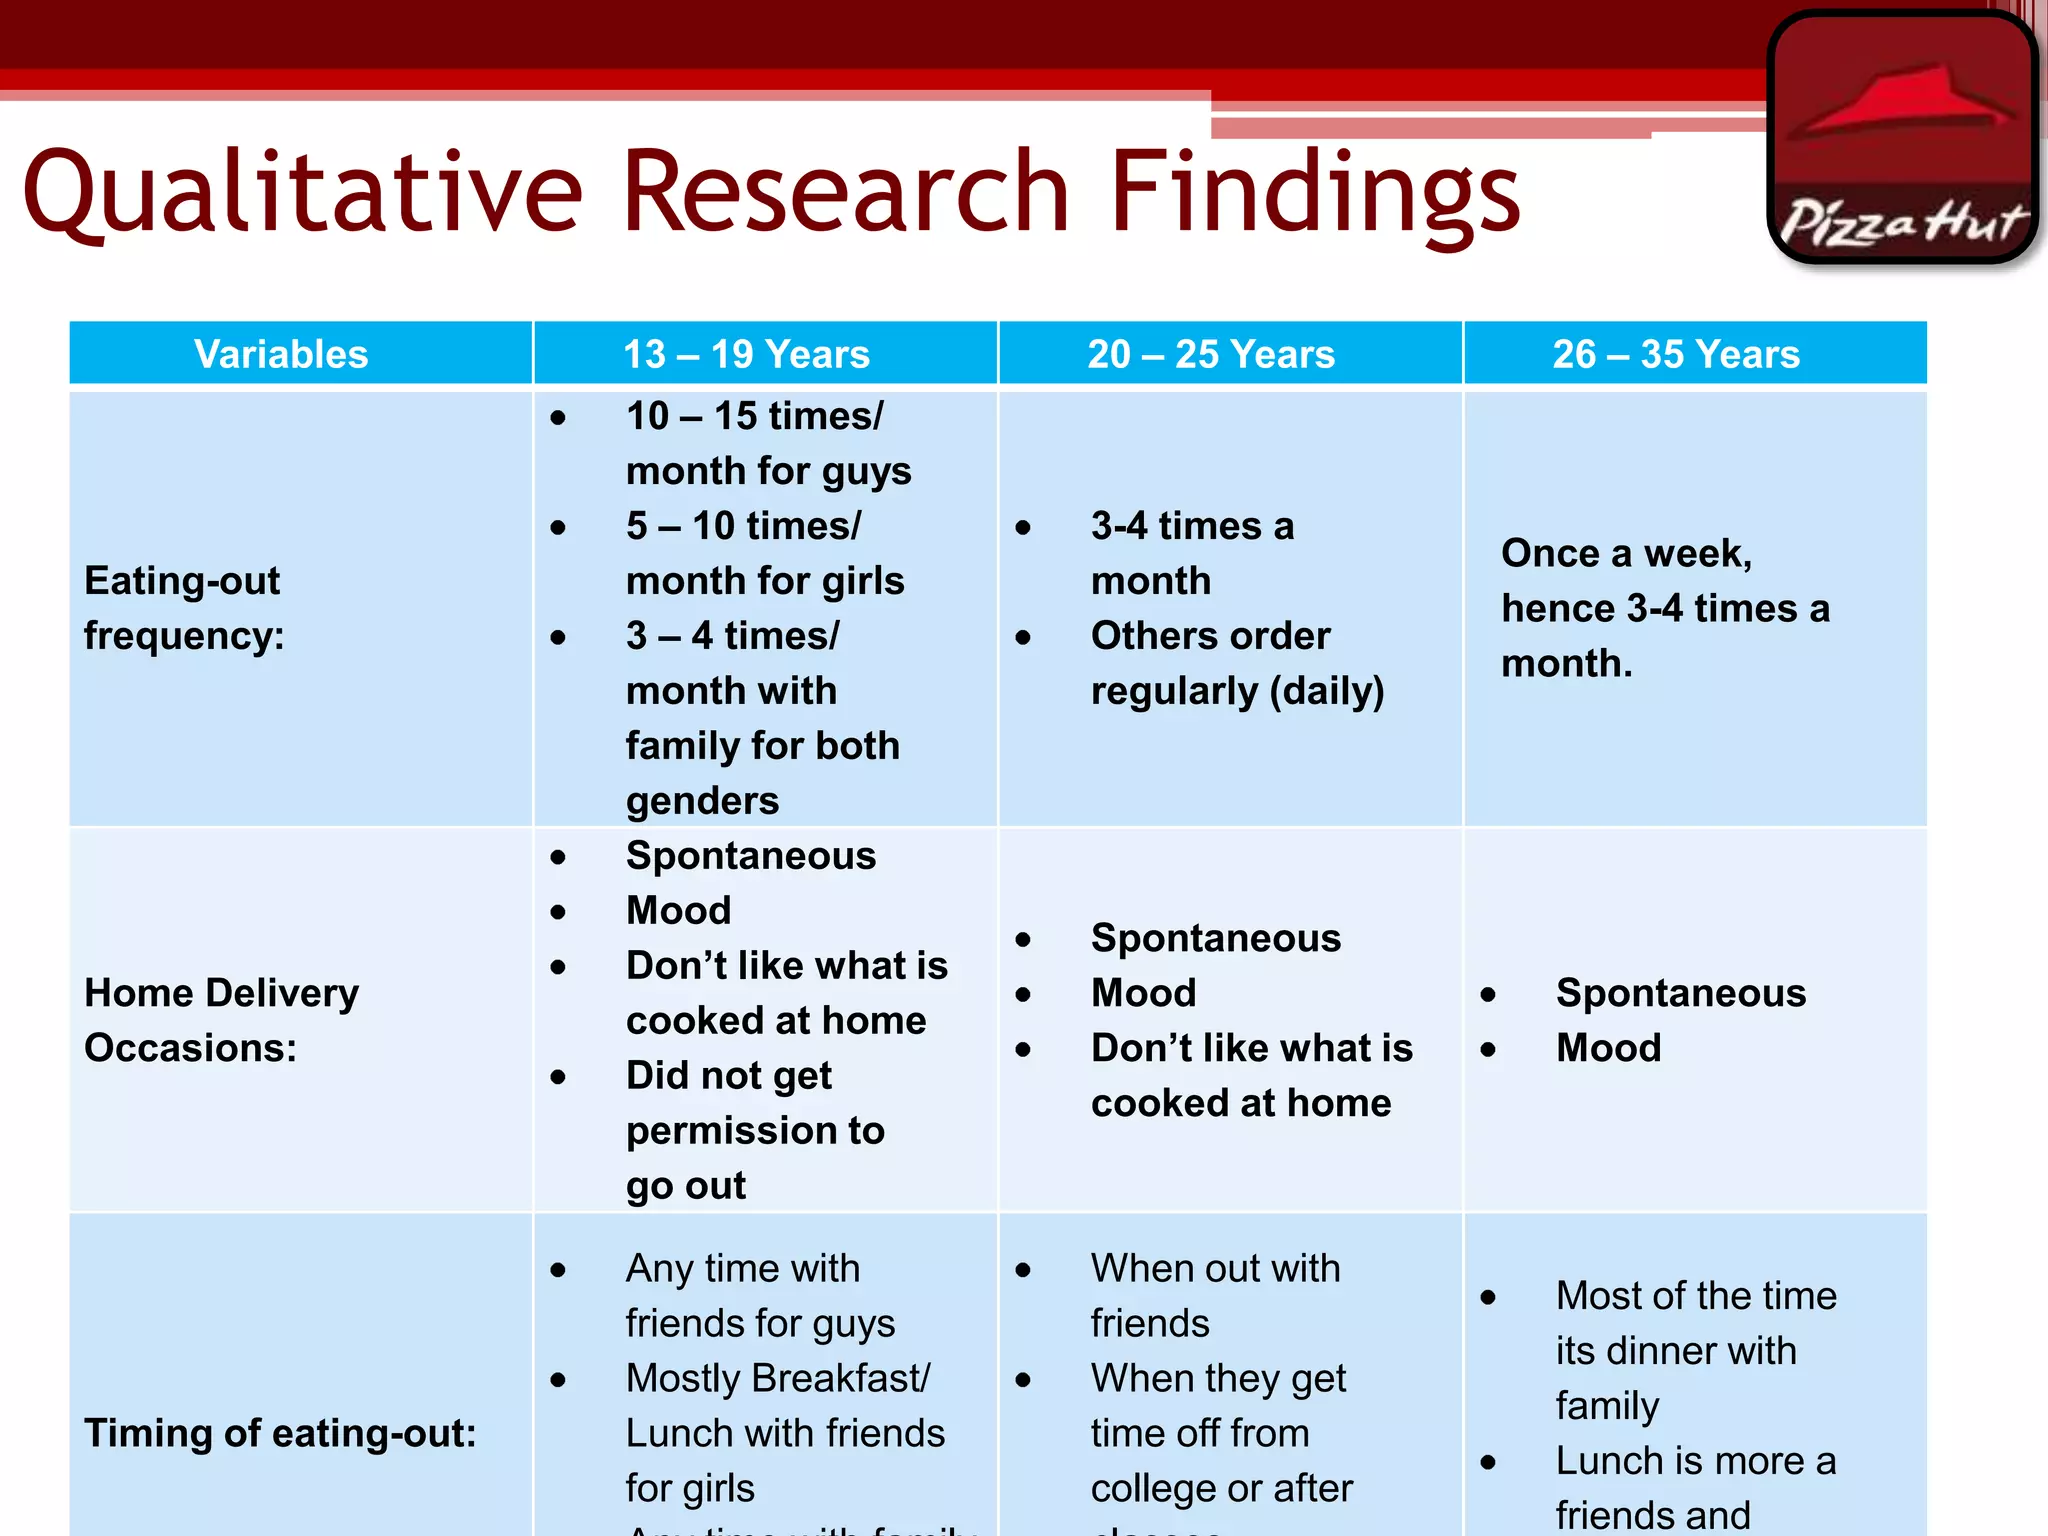
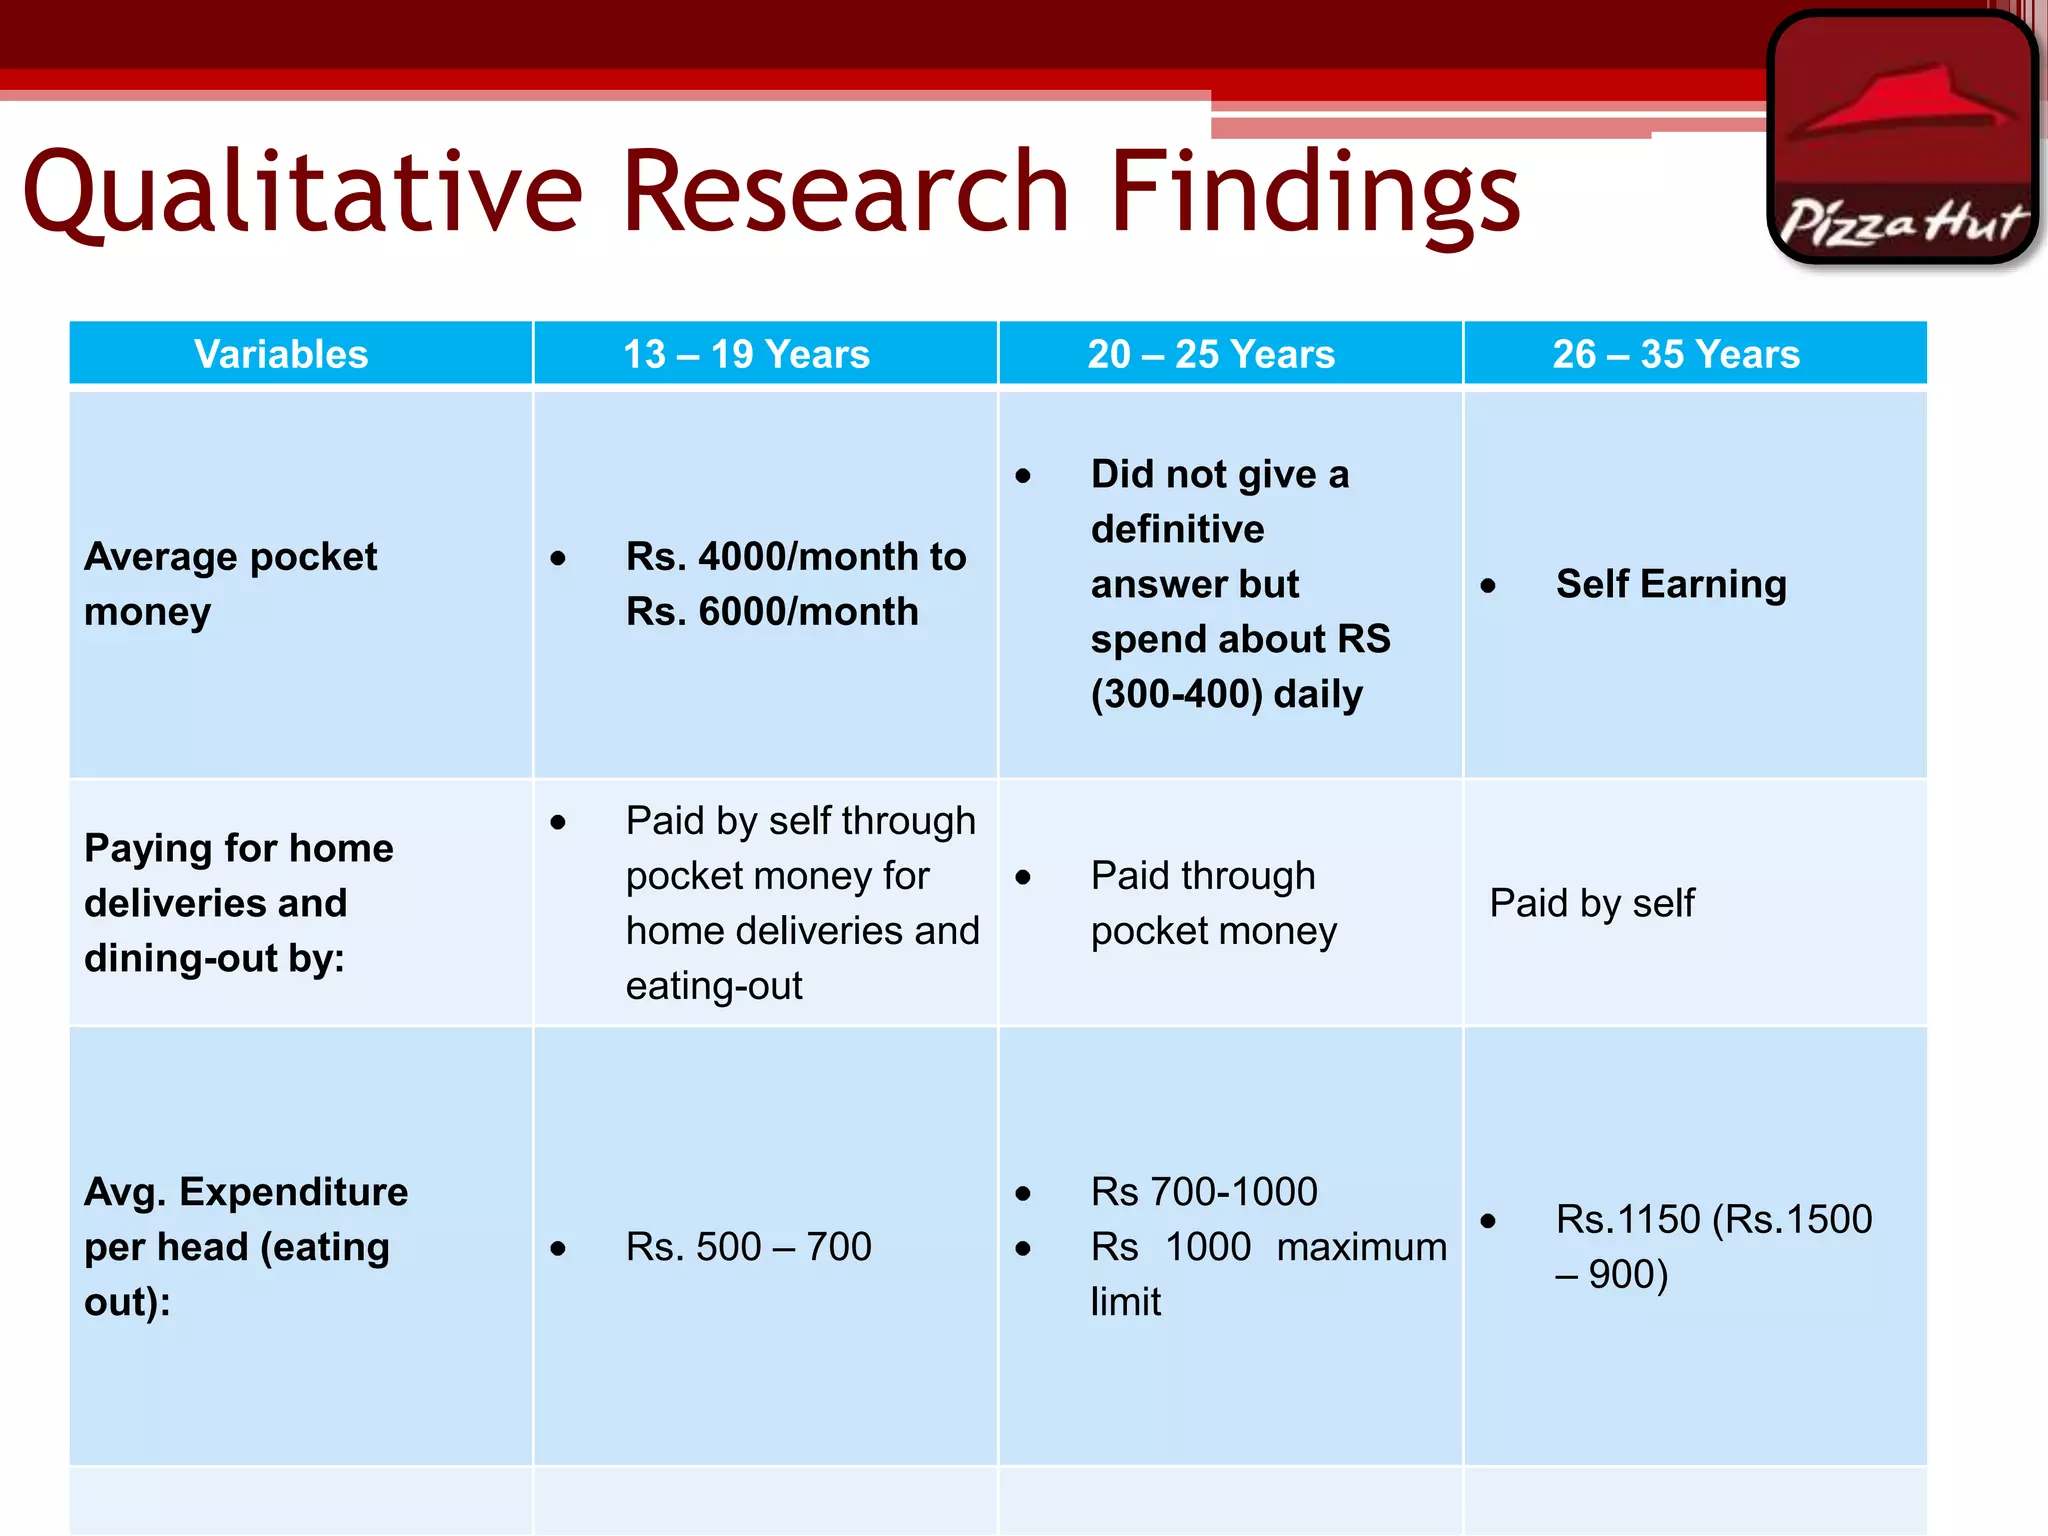
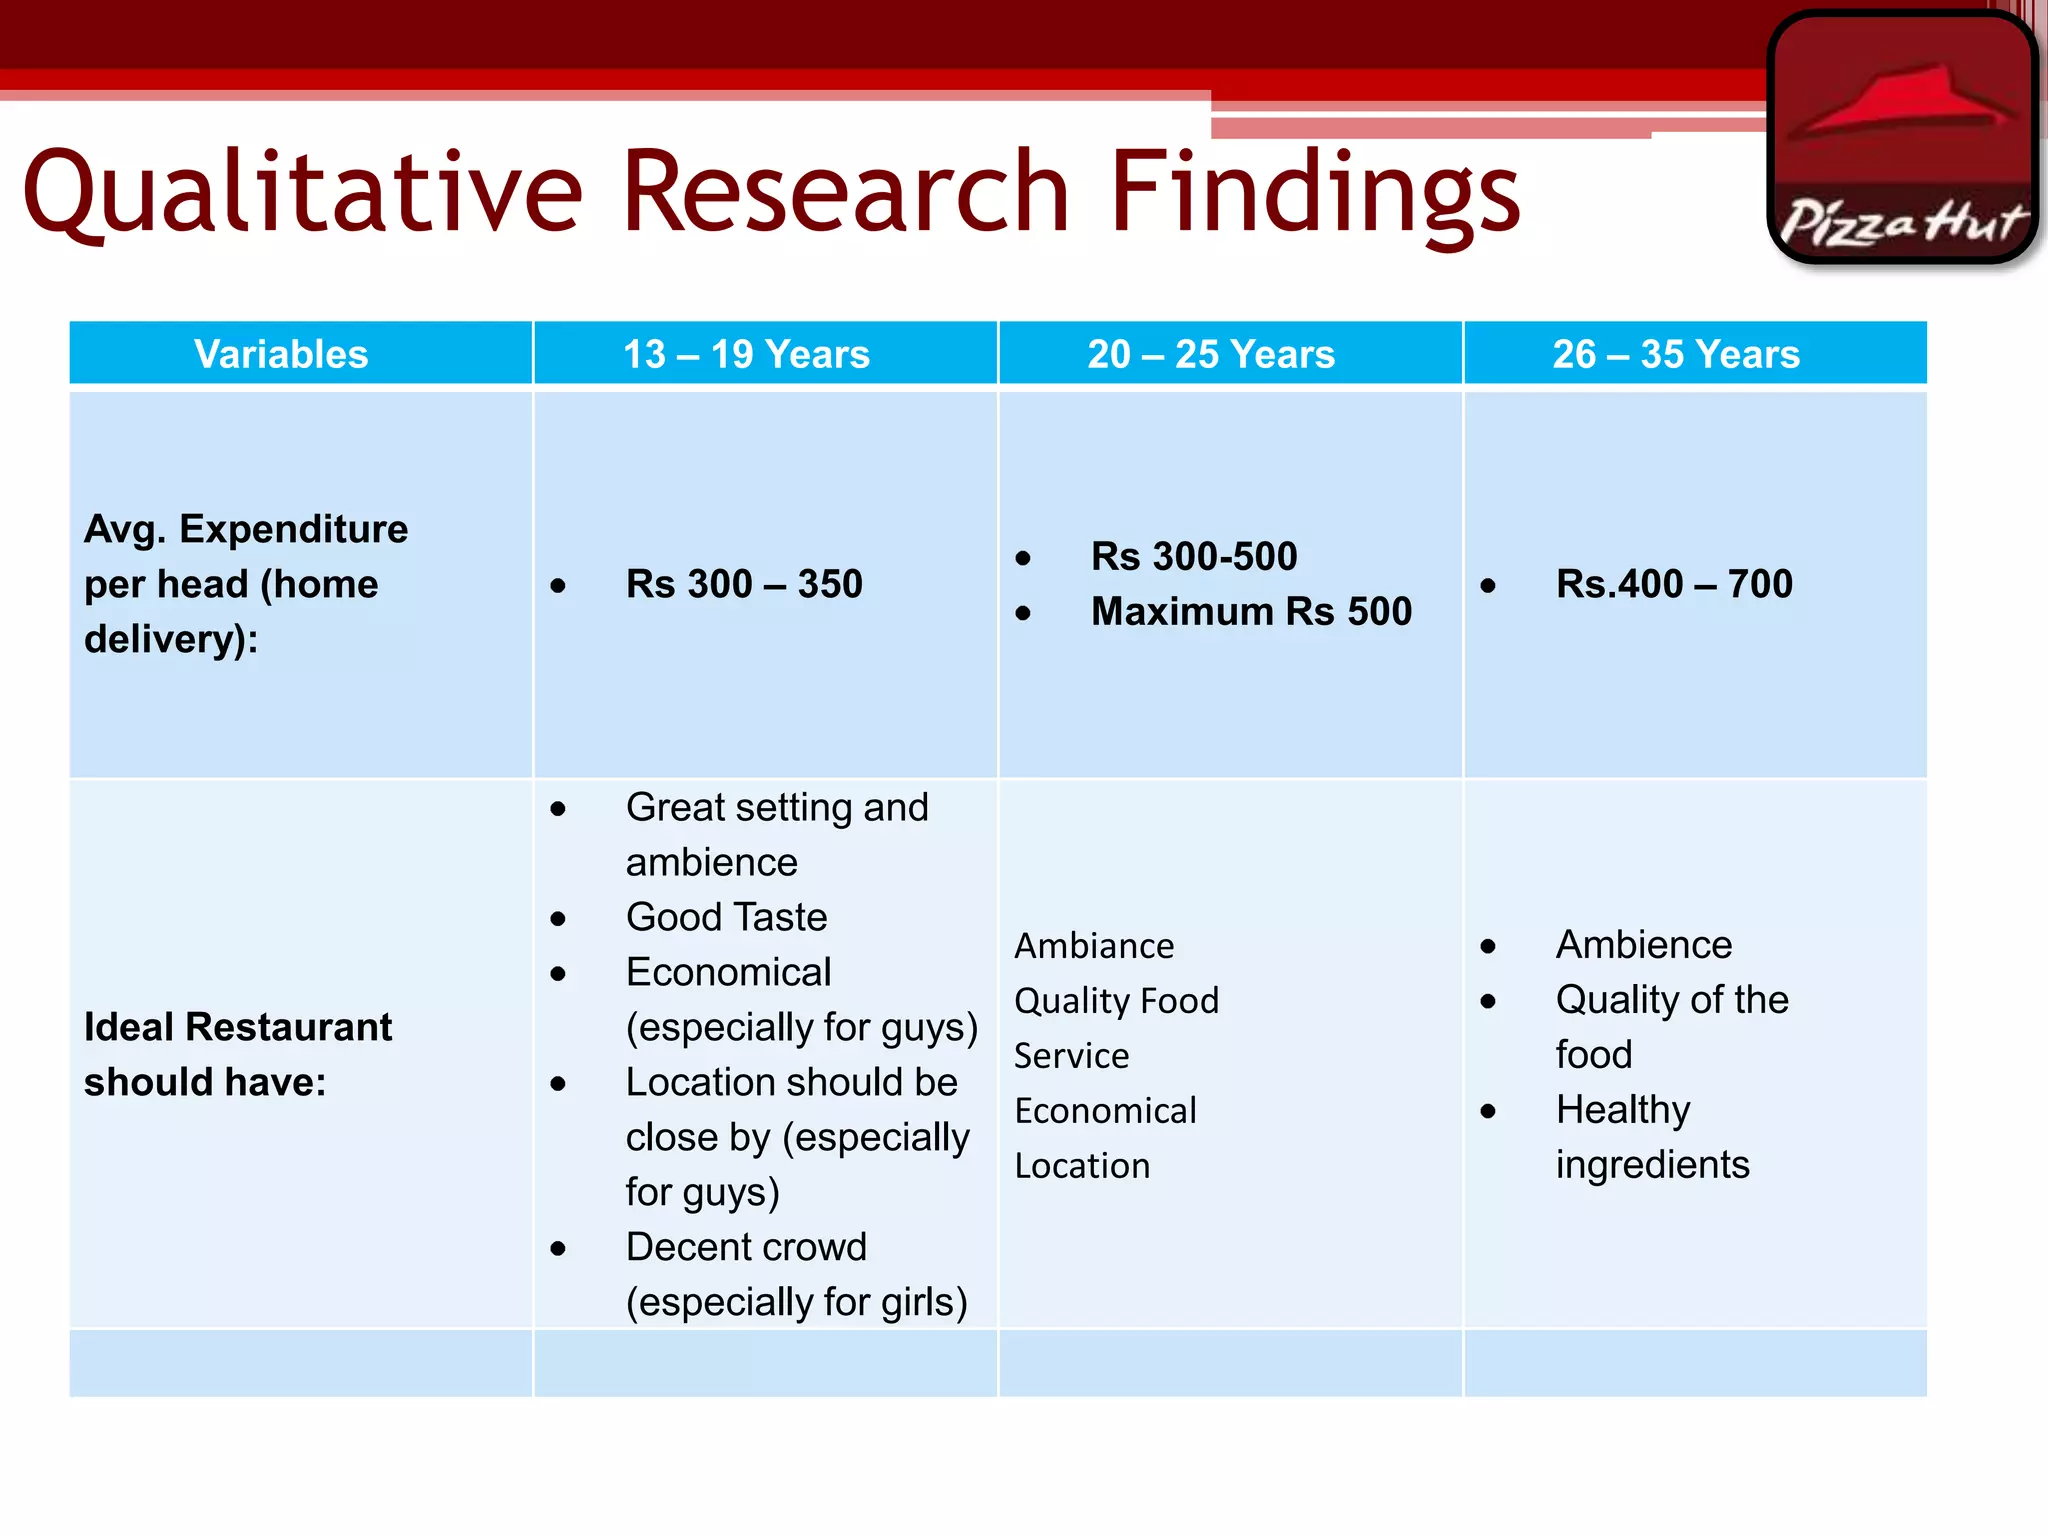
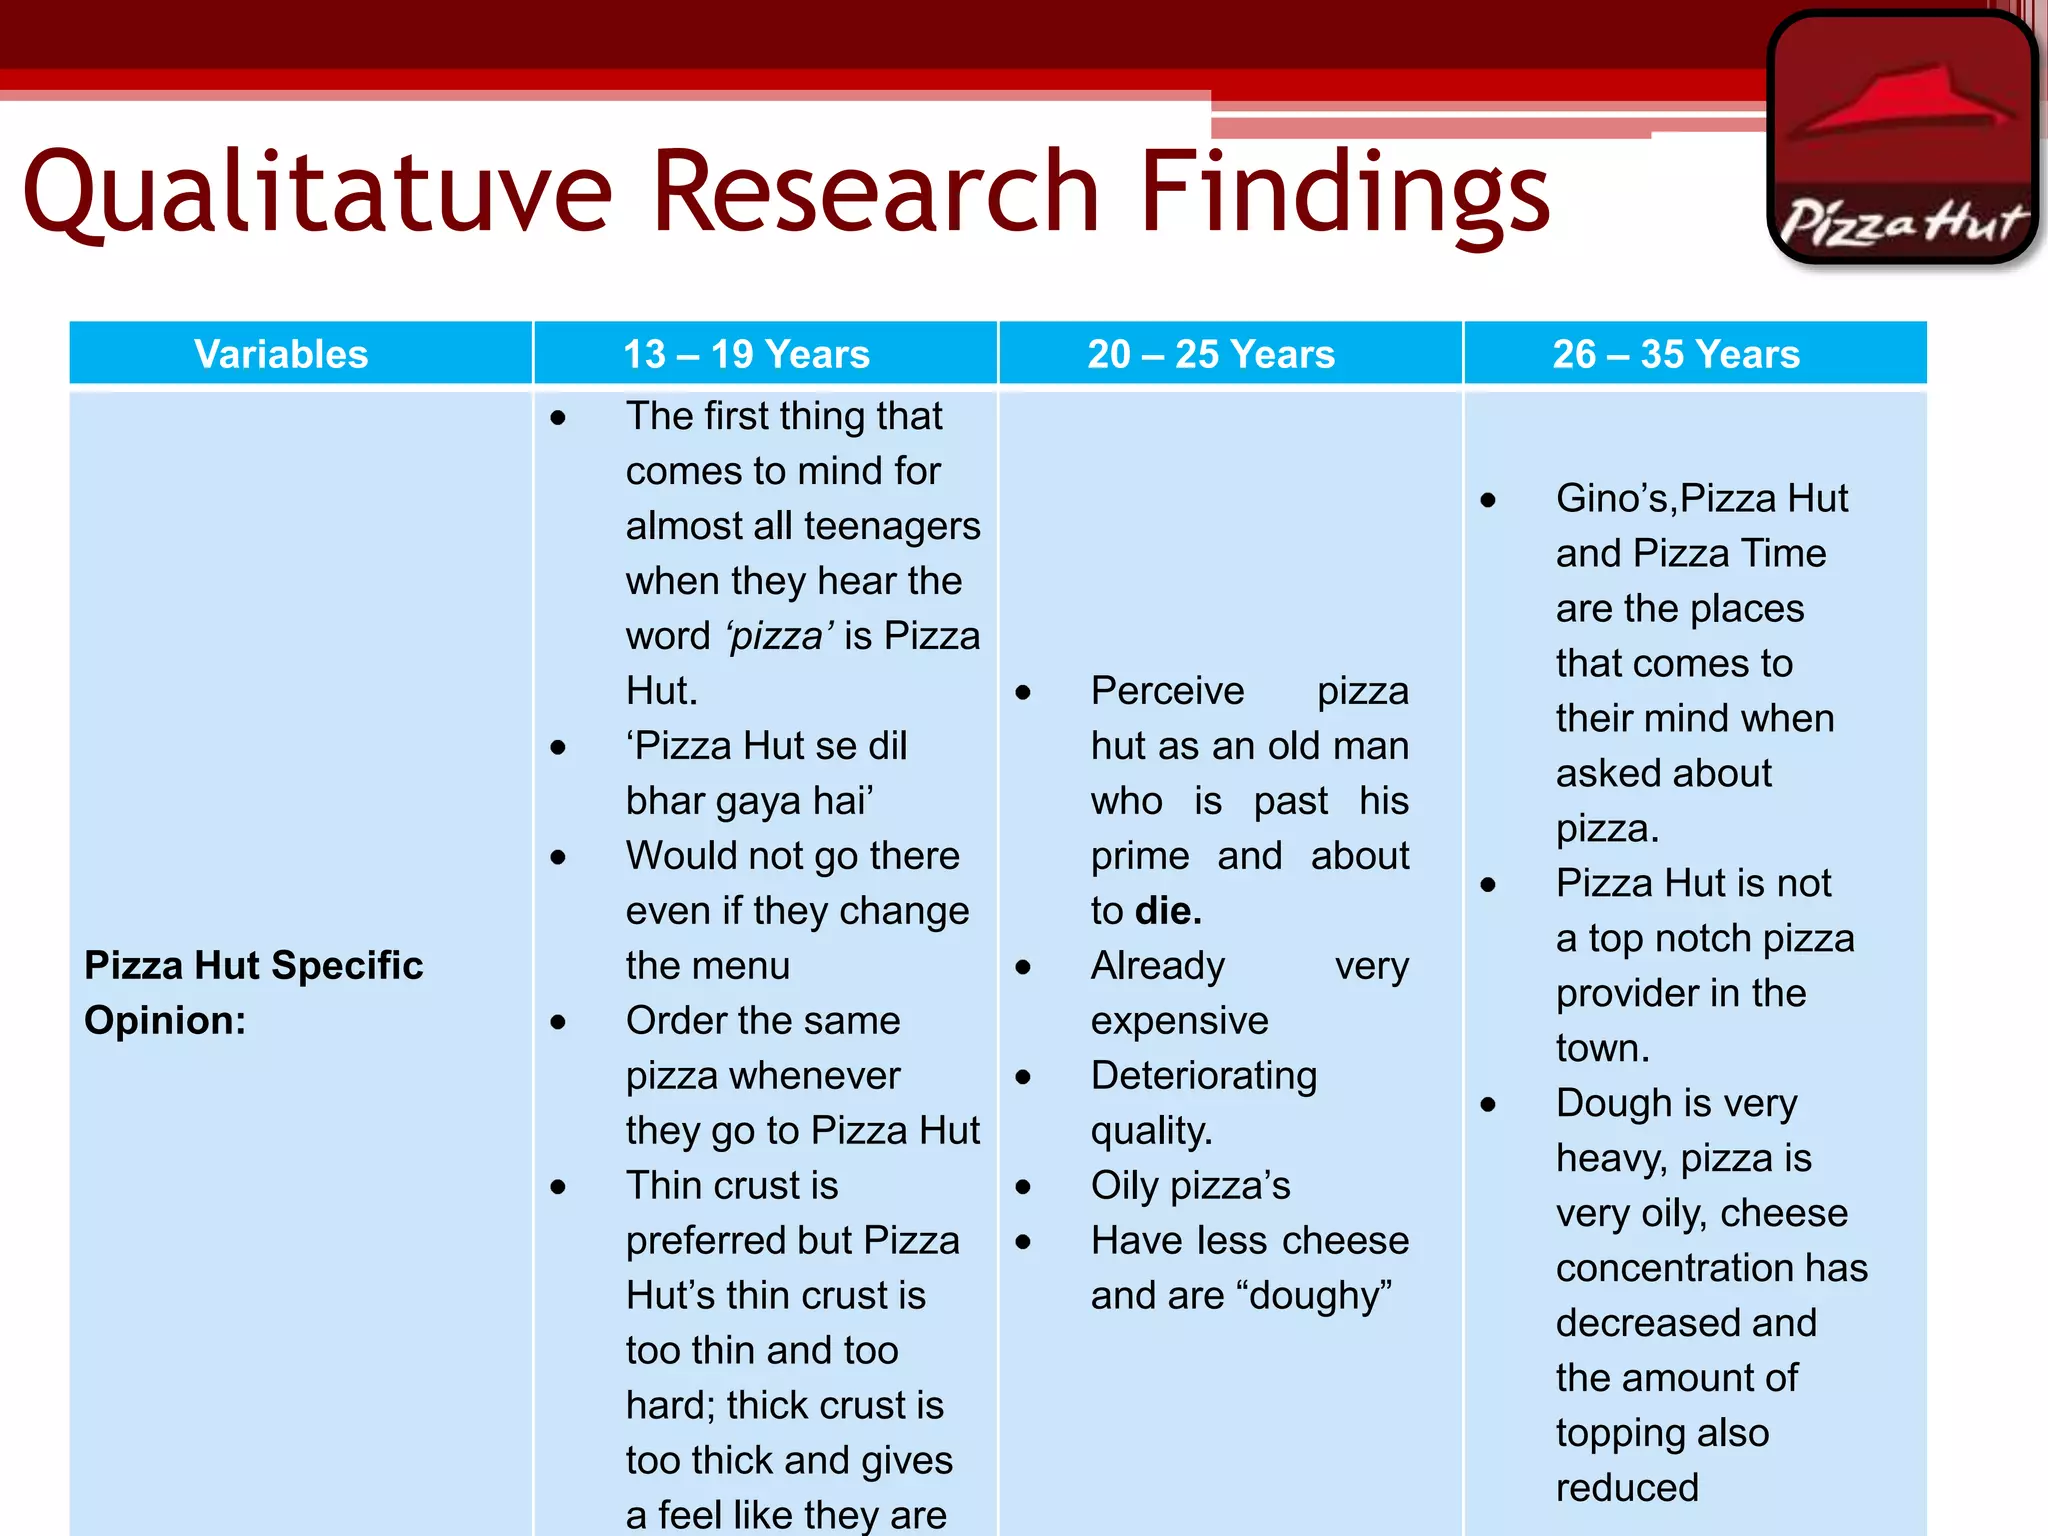
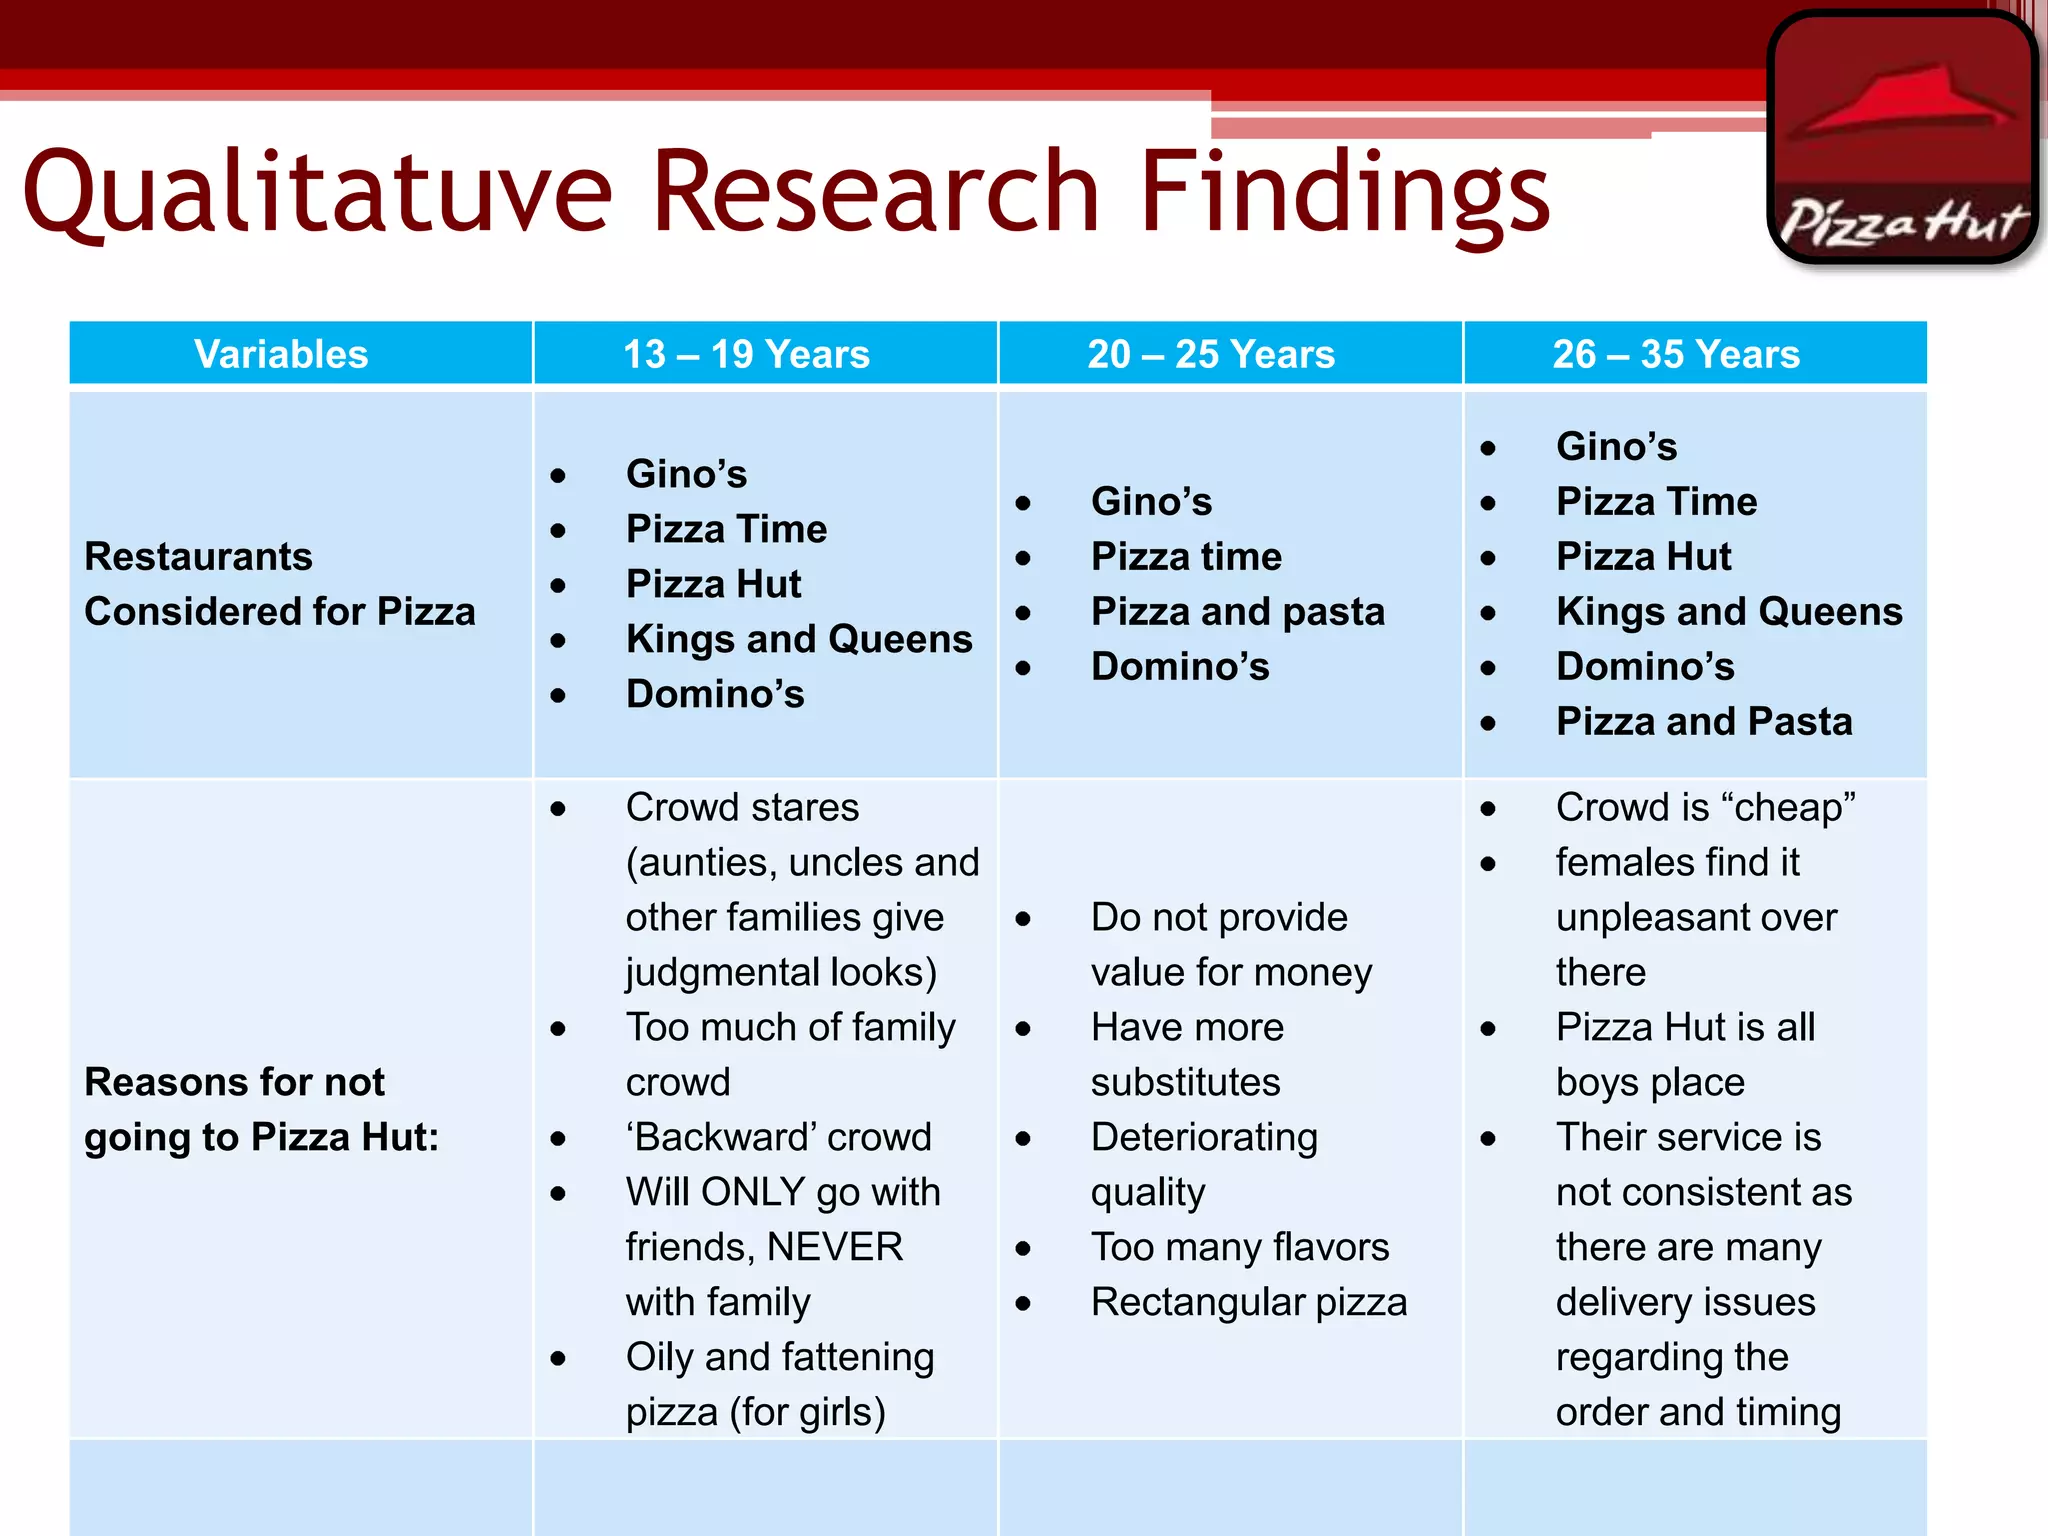

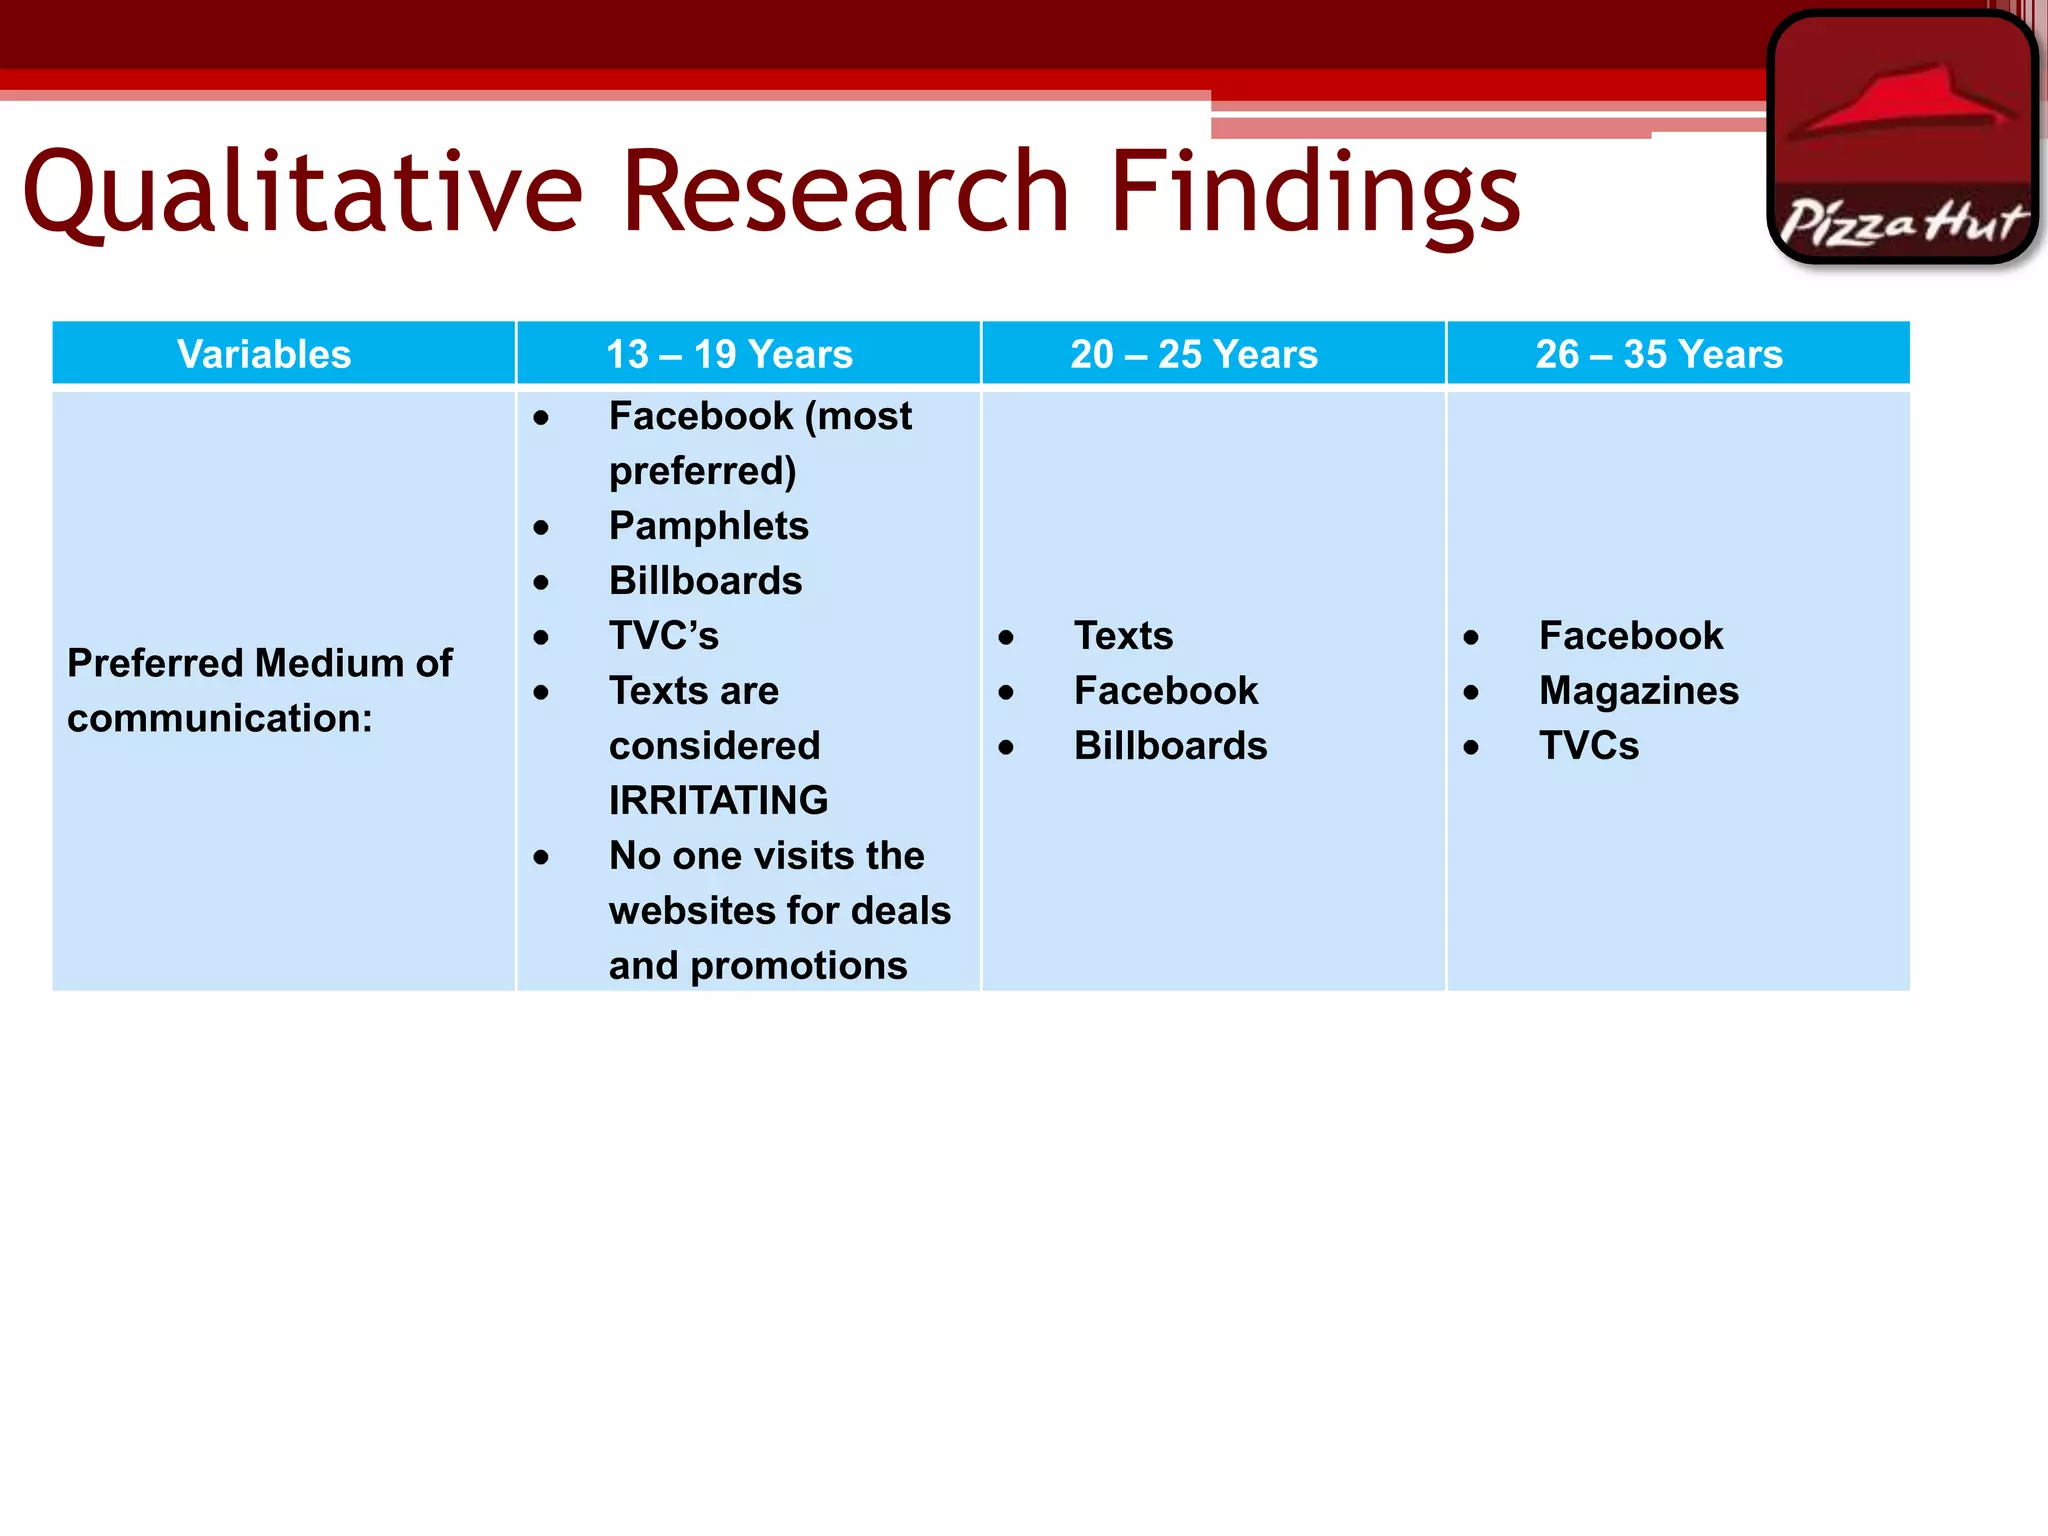
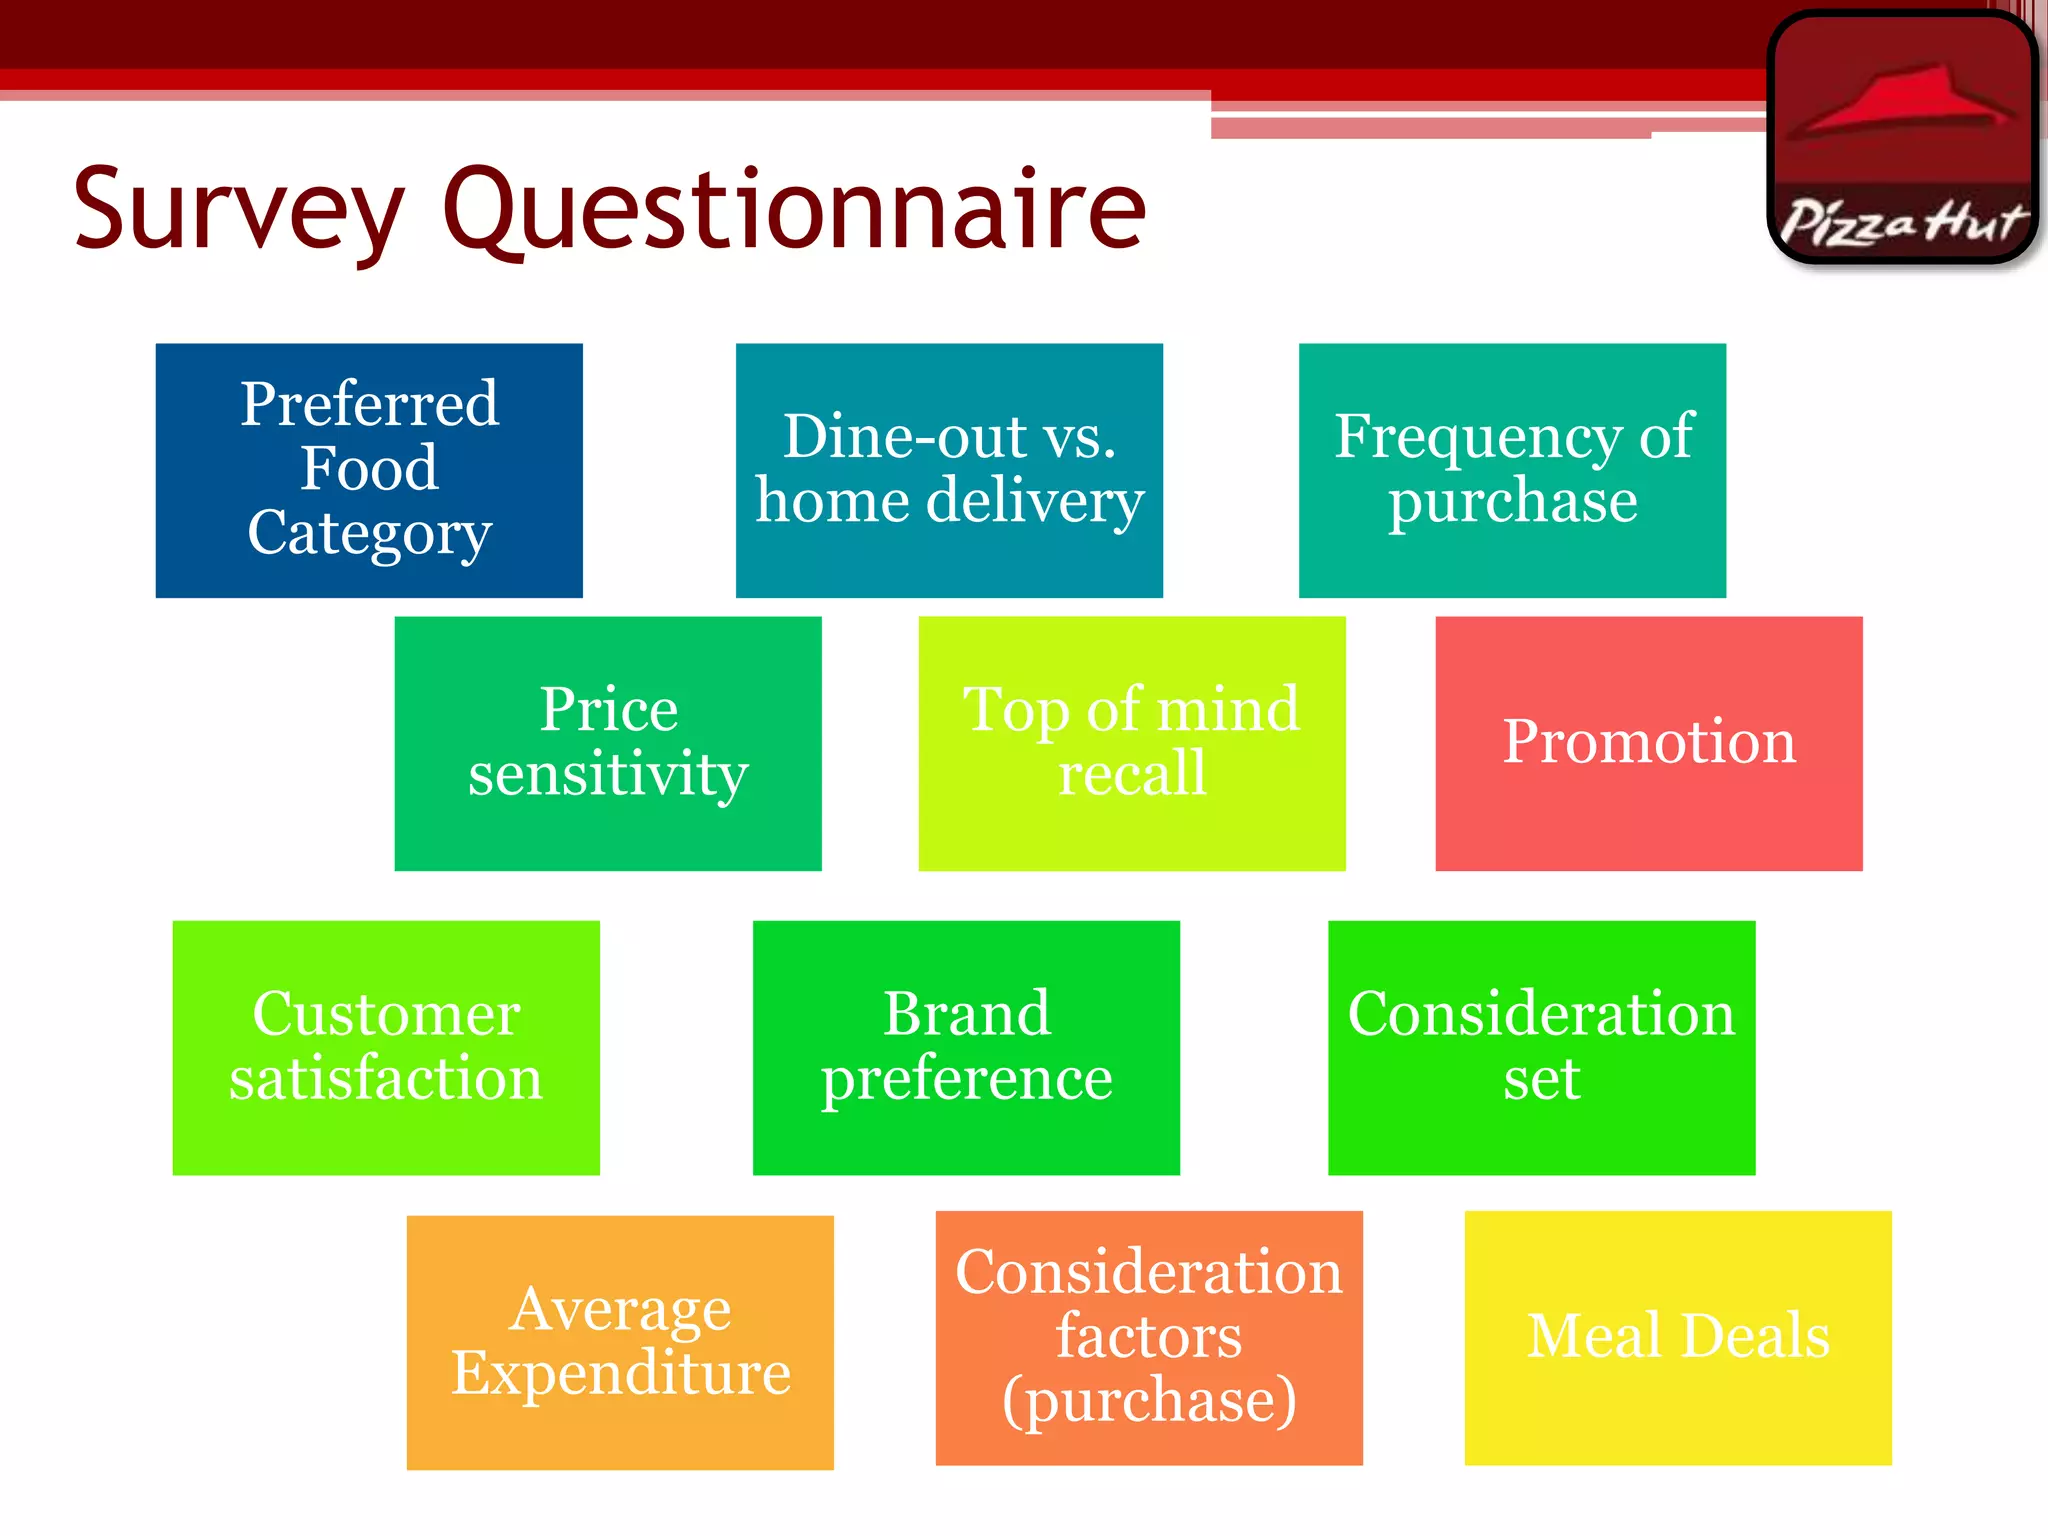


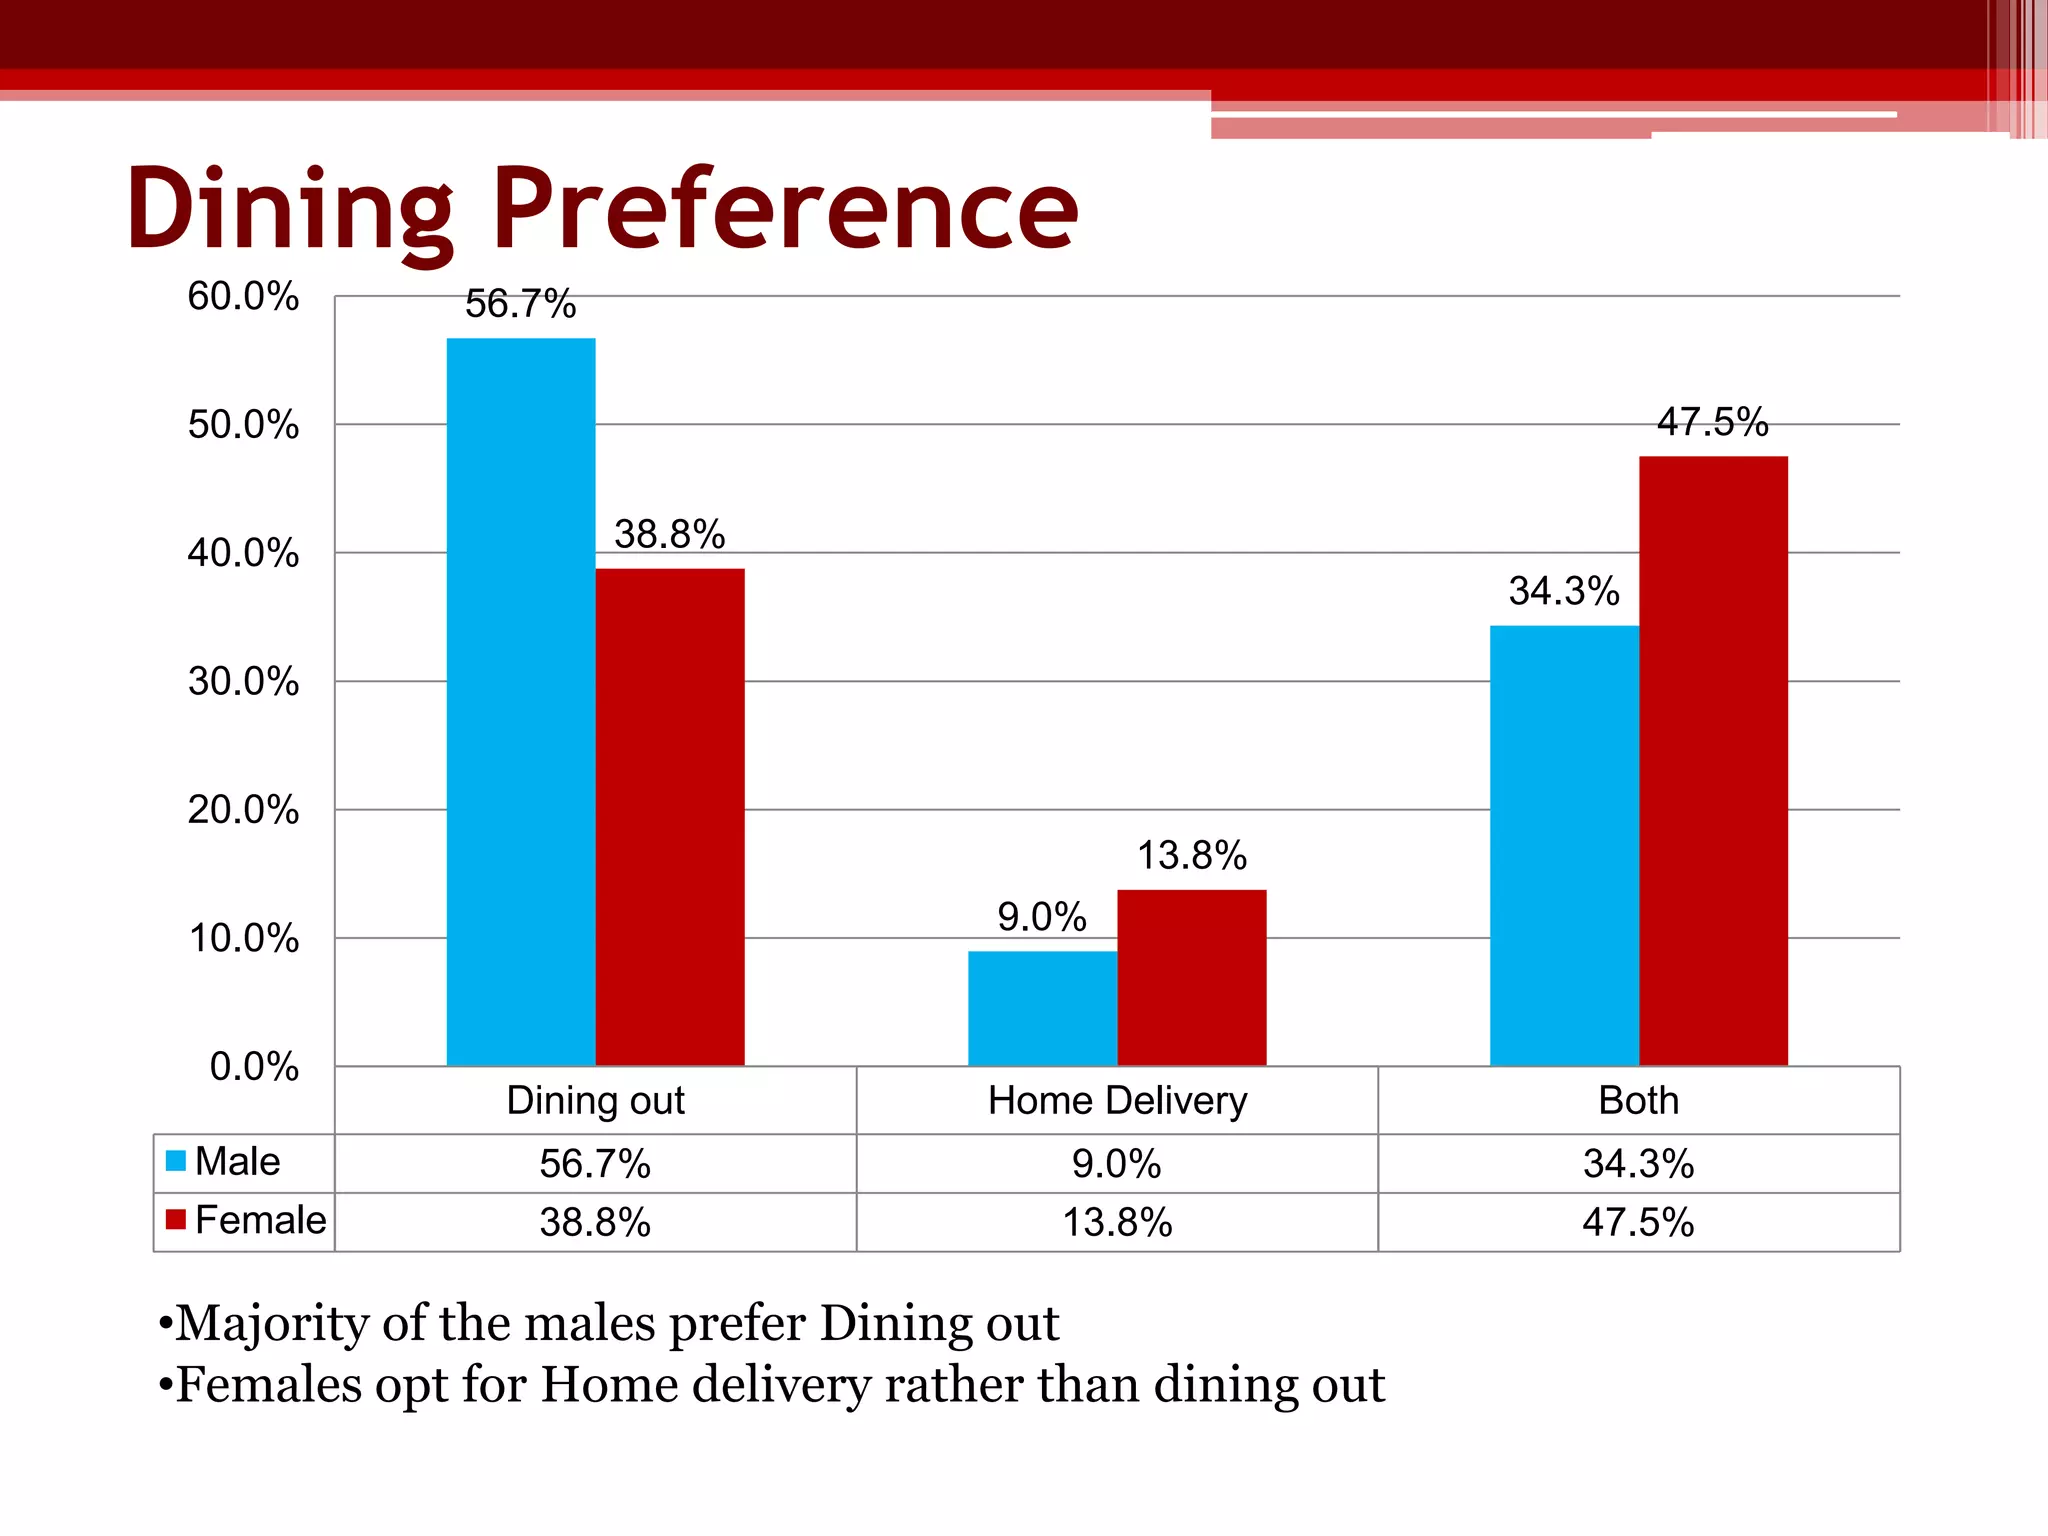

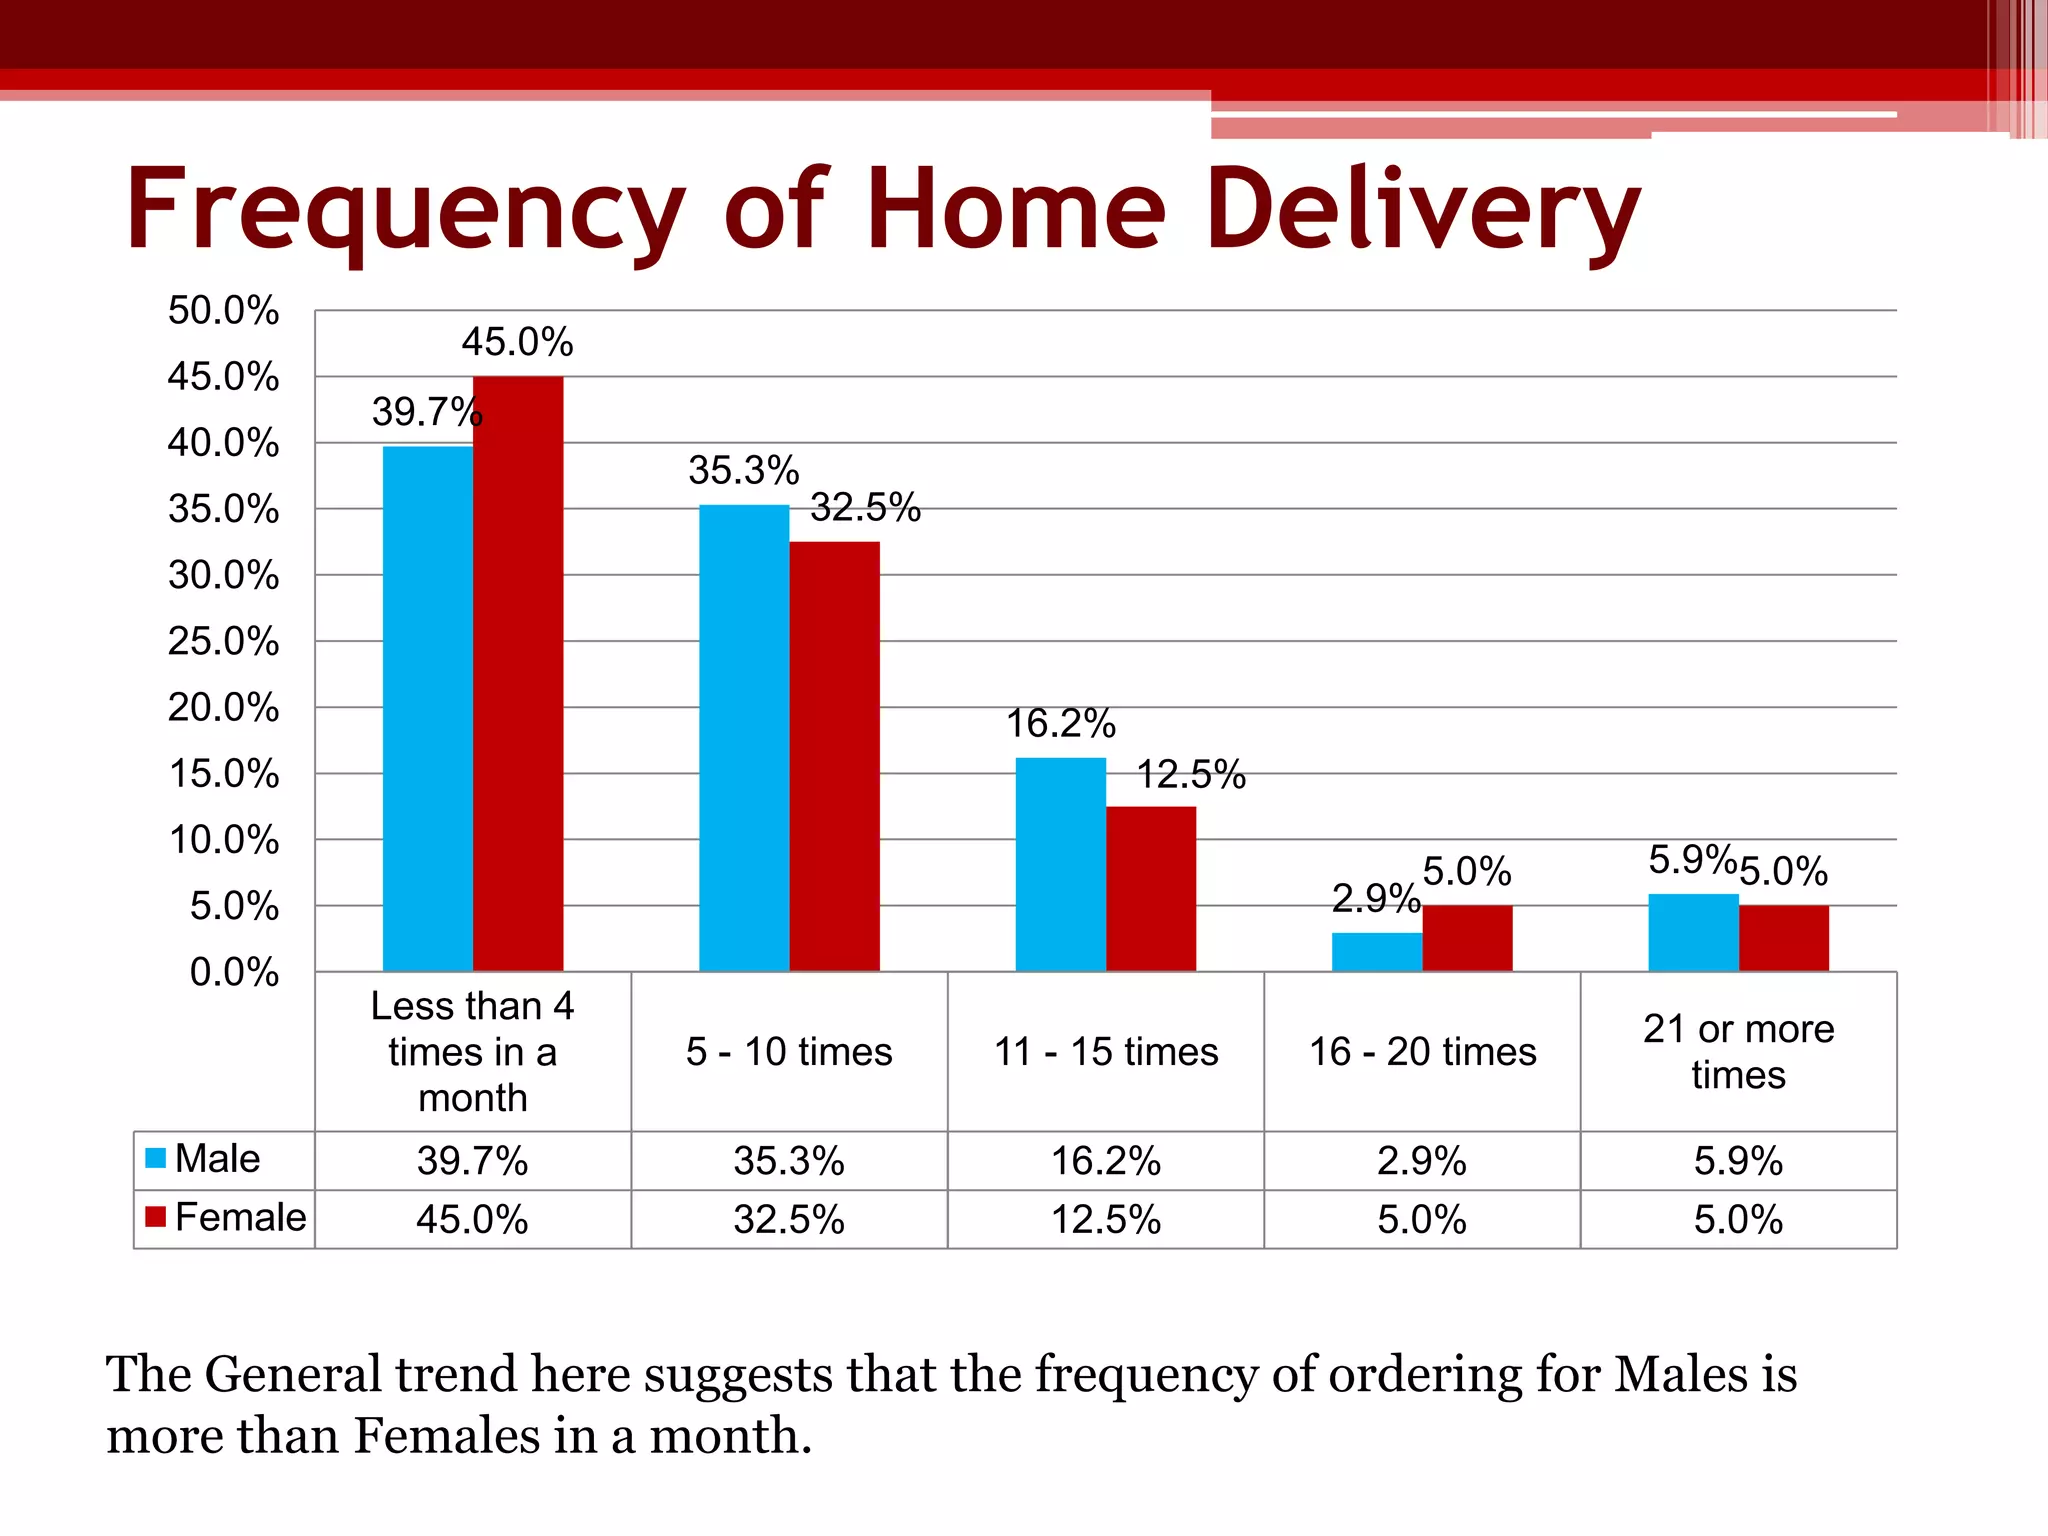


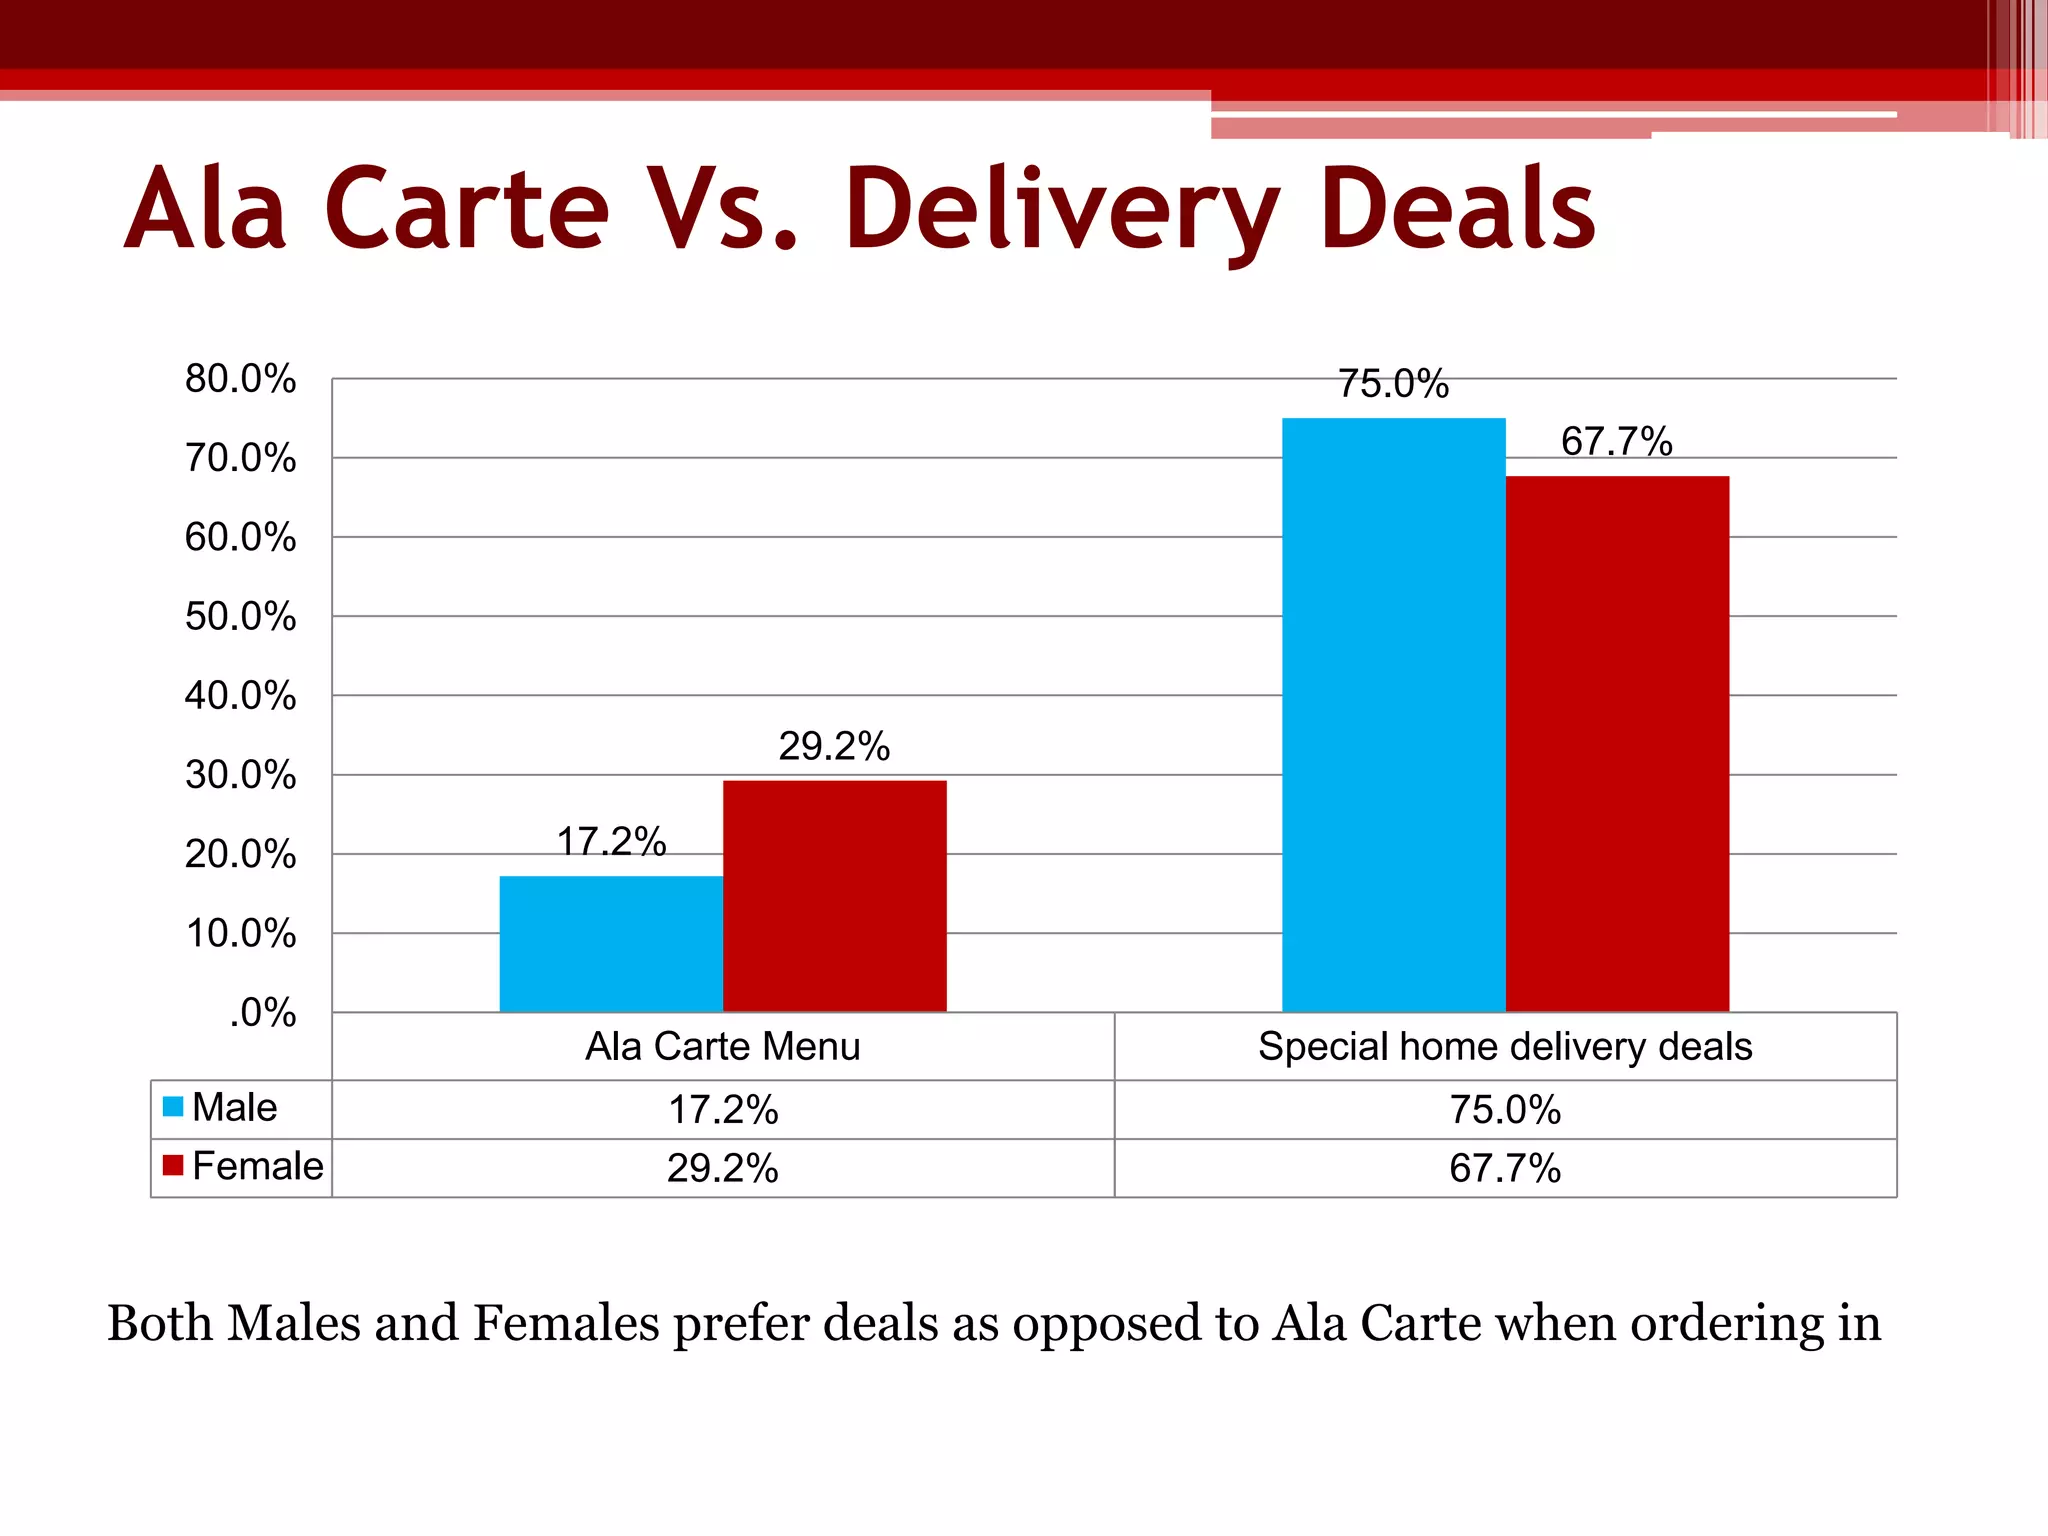


Pizza Hut, after establishing itself as the sole franchise in Pakistan, faces competition from local chains and intends to expand its branch reach. The document discusses consumer preference shifts from dine-in to home delivery, particularly among the 'Sec A' demographic, highlighting the necessity for menu modifications and better understanding of consumer trends. Research methodologies indicate exploratory and descriptive phases involving focus groups and surveys to grasp the evolving market dynamics and consumer behavior towards fast food consumption.