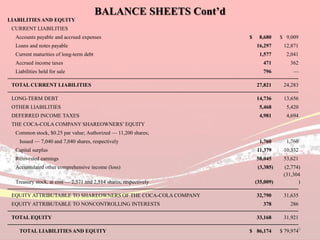
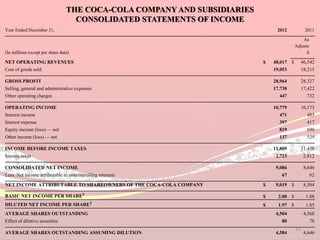
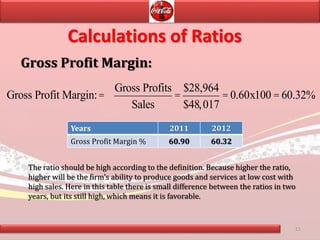
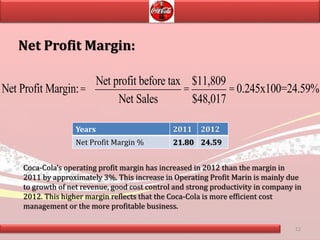
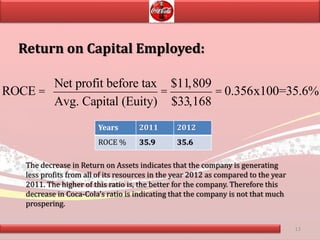
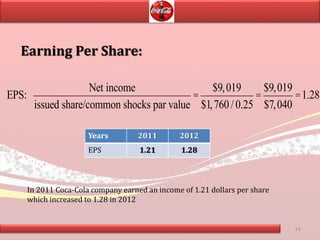
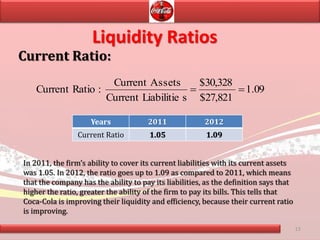
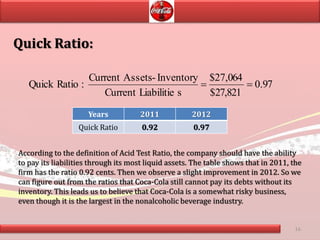
Topic: Financial Ratios Analysis of
Coca-Cola 1
1. Priya Balani
2. Shoaib Ahmed Memon
3. Syed Jamal Shah
4. Yashpal Advani
5. Murtaza Mudeer
2
Group Members
Presented To : Ma’am Tazeen Imran
3
Coca Cola International
The Coca-Cola Company is the world's largest beverage
company.
It is no.1 brand according to fortune 2009 survey.
The company operates a franchised distribution system dating
from 1889.
The Coca-Cola Company is headquartered in Atlanta, Georgia.
With local operations in over 200 countries around the world.
Coca Cola has 150,900 employees worldwide.
Our mission is:
• To refresh the world in mind, body and
spirit,
• To inspire moments of optimism and
happiness through our brands and
actions,
• To create value and make a difference.
4
• Assessment of the firm’s past financial
conditions
• Done to find firm’s financial strengths
and weaknesses
• Primary Tools:
– Financial Statements
– Comparison of financial ratios to past.
5
Objectives of Ratio Analysis
• Standardize financial information for
comparisons
• Compare performance with past
performance
6
Types of Ratios
• Calculations of Ratios,
• Efficency/ Performance Ratios:
– Activity (Turnover) Ratios,
• Liquidity Ratios.
7
December 31, 2012 2011
(In millions except par value) As Adjusted
ASSETS
CURRENT ASSETS
Cash and cash equivalents $ 8,442 $ 12,803
Short-term investments 5,017 1,088
TOTAL CASH, CASH EQUIVALENTS AND SHORT-TERM INVESTMENTS 13,459 13,891
Marketable securities 3,092 144
Trade accounts receivable, less allowances of $53 and $83, respectively 4,759 4,920
Inventories 3,264 3,092
Prepaid expenses and other assets 2,781 3,450
Assets held for sale 2,973 —
TOTAL CURRENT ASSETS 30,328 25,497
EQUITY METHOD INVESTMENTS 9,216 7,233
OTHER INVESTMENTS, PRINCIPALLY BOTTLING COMPANIES 1,232 1,141
OTHER ASSETS 3,585 3,495
PROPERTY, PLANT AND EQUIPMENT — net 14,476 14,939
TRADEMARKS WITH INDEFINITE LIVES 6,527 6,430
BOTTLERS’ FRANCHISE RIGHTS WITH INDEFINITE LIVES 7,405 7,770
GOODWILL 12,255 12,219
OTHER INTANGIBLE ASSETS 1,150 1,250
TOTALASSETS $ 86,174 $ 79,974
THE COCA-COLA COMPANYAND SUBSIDIARIES
CONSOLIDATED BALANCE SHEETS
8
LIABILITIES AND EQUITY
CURRENT LIABILITIES
Accounts payable and accrued expenses $ 8,680 $ 9,009
Loans and notes payable 16,297 12,871
Current maturities of long-term debt 1,577 2,041
Accrued income taxes 471 362
Liabilities held for sale 796 —
TOTAL CURRENT LIABILITIES 27,821 24,283
LONG-TERM DEBT 14,736 13,656
OTHER LIABILITIES 5,468 5,420
DEFERRED INCOME TAXES 4,981 4,694
THE COCA-COLA COMPANY SHAREOWNERS’ EQUITY
Common stock, $0.25 par value; Authorized — 11,200 shares;
Issued — 7,040 and 7,040 shares, respectively 1,760 1,760
Capital surplus 11,379 10,332
Reinvested earnings 58,045 53,621
Accumulated other comprehensive income (loss) (3,385) (2,774)
Treasury stock, at cost — 2,571 and 2,514 shares, respectively (35,009)
(31,304
)
EQUITY ATTRIBUTABLE TO SHAREOWNERS OF THE COCA-COLA COMPANY 32,790 31,635
EQUITY ATTRIBUTABLE TO NONCONTROLLING INTERESTS 378 286
TOTAL EQUITY 33,168 31,921
TOTAL LIABILITIES AND EQUITY $ 86,174 $ 79,974
BALANCE SHEETS Cont’d
9
Year Ended December 31, 2012 2011
(In millions except per share data)
As
Adjuste
d
NET OPERATING REVENUES $ 48,017 $ 46,542
Cost of goods sold 19,053 18,215
GROSS PROFIT 28,964 28,327
Selling, general and administrative expenses 17,738 17,422
Other operating charges 447 732
OPERATING INCOME 10,779 10,173
Interest income 471 483
Interest expense 397 417
Equity income (loss) — net 819 690
Other income (loss) — net 137 529
INCOME BEFORE INCOME TAXES 11,809 11,458
Income taxes 2,723 2,812
CONSOLIDATED NET INCOME 9,086 8,646
Less: Net income attributable to noncontrolling interests 67 62
NET INCOME ATTRIBUTABLE TO SHAREOWNERS OF THE COCA-COLA COMPANY $ 9,019 $ 8,584
BASIC NET INCOME PER SHARE1
$ 2.00 $ 1.88
DILUTED NET INCOME PER SHARE1
$ 1.97 $ 1.85
AVERAGE SHARES OUTSTANDING 4,504 4,568
Effect of dilutive securities 80 78
AVERAGE SHARES OUTSTANDING ASSUMING DILUTION 4,584 4,646
THE COCA-COLA COMPANY AND SUBSIDIARIES
CONSOLIDATED STATEMENTS OF INCOME
10
Calculations of Ratios
Gross Profit Margin:
Gross Profit Margin:=
Gross Profits
Sales
=
$28,964
$48,017
= 0.60x100 = 60.32%
Years 2011 2012
Gross Profit Margin % 60.90 60.32
The ratio should be high according to the definition. Because higher the ratio,
higher will be the firm’s ability to produce goods and services at low cost with
high sales. Here in this table there is small difference between the ratios in two
years, but its still high, which means it is favorable.
11
12
Net Profit Margin:
Net Profit Margin:=
Net profit before tax
Net Sales
=
$11,809
$48,017
= 0.245x100=24.59%
Years 2011 2012
Net Profit Margin % 21.80 24.59
Coca-Cola’s operating profit margin has increased in 2012 than the margin in
2011 by approximately 3%. This increase in Operating Profit Marin is mainly due
to growth of net revenue, good cost control and strong productivity in company in
2012. This higher margin reflects that the Coca-Cola is more efficient cost
management or the more profitable business.
Return on Capital Employed:
ROCE =
Net profit before tax
Avg. Capital (Euity)
=
$11,809
$33,168
= 0.356x100=35.6%
Years 2011 2012
ROCE % 35.9 35.6
The decrease in Return on Assets indicates that the company is generating
less profits from all of its resources in the year 2012 as compared to the year
2011. The higher of this ratio is, the better for the company. Therefore this
decrease in Coca-Cola’s ratio is indicating that the company is not that much
prospering.
13
14
Earning Per Share:
EPS:
Net income
issued share/common shocks par value
=
$9,019
$1,760 /0.25
=
$9,019
$7,040
=1.28
Years 2011 2012
EPS 1.21 1.28
In 2011 Coca-Cola company earned an income of 1.21 dollars per share
which increased to 1.28 in 2012
Liquidity Ratios
Current Ratio:
09.1
27,821$
30,328$
sLiabilitieCurrent
AssetsCurrent
:RatioCurrent 
Years 2011 2012
Current Ratio 1.05 1.09
In 2011, the firm’s ability to cover its current liabilities with its current assets
was 1.05. In 2012, the ratio goes up to 1.09 as compared to 2011, which means
that the company has the ability to pay its liabilities, as the definition says that
higher the ratio, greater the ability of the firm to pay its bills. This tells that
Coca-Cola is improving their liquidity and efficiency, because their current ratio
is improving.
15
16
97.0
27,821$
064,72$
sLiabilitieCurrent
Inventory-AssetsCurrent
:RatioQuick 
Quick Ratio:
Years 2011 2012
Quick Ratio 0.92 0.97
According to the definition of Acid Test Ratio, the company should have the ability
to pay its liabilities through its most liquid assets. The table shows that in 2011, the
firm has the ratio 0.92 cents. Then we observe a slight improvement in 2012. So we
can figure out from the ratios that Coca-Cola still cannot pay its debts without its
inventory. This leads us to believe that Coca-Cola is a somewhat risky business,
even though it is the largest in the nonalcoholic beverage industry.
Debt to Equity Ratio:
Longterm Debt
Equity+Long Term Debt
=
$14736
$33168+14736
=
$14736
$47904
= 0.307
Years 2011 2012
Debt to
equity ratio
0.299 0.307
The ratio shows the company’s ability to cover its debts to equity through its
long term debts and equity. The ratio was 0.299 in 2011, then goes up in 2012.
The ratio has to be low. So we can interpret that in the year 2012, the risk of
the firm is getting higher as the ratio goes up.
17
18
Working Capital Cycle:
WCC:
RT(Debtors)+IT(stocks)-PT(Creditor)
=
$9.92+5.99-2.15
=13.76
Years 2011 2012
WCC 13.28 13.76
Turnover in days= 365/13.76= 26.5 days
Coca-cola Company has working capital cycle turnover days in 2012 decreased to
26.5days from 27.48 days in 2011
Debtors Receivable turnover :
Receivables Turnover:
NetSales
Avg.Acc-Recievable
=
48017
(4759+4920 /2)
=
48017
4839
= 9.92
Years 2011 2012
Receivable Turnover 9.6 9.92
The ability of the firm of collecting the receivables in the specific time. Here
in the year 2011 the turnover in days was almost 38, but the collection days
decrease in the year 2012 and the collection period of approximately 36 days
is well within the 60 days allowed in the credit terms. This shows that the
collection is faster as compared to the previous year.
19
In days
365/ inventory turnover = 365/9.92= 36.7=37 days
Efficiency/ Performance Ratios
20
Creditors- Payable Turnover:
Payable Turnover:
Net purchases(COGS)
Avg.Acc- payable
=
19053
(8680+9009 /2)
=
19053
8845
= 2.15
Years 2011 2012
Payable Turnover 2.05 2.15
Coca-Cola’s average period for payment has reduce to 170 days in 2012 which
was 178 days in 2011. This reduction in average payment period shows that
how efficiently company is paying back their creditors and also assuring that
payments are being made in a prompt manner by Coke to its creditors. This
period should remain low as much as possible.
In days
365/ inventory turnover = 365/2.15= 169.7=170 days
21
Inventory Stocks Turnover Ratio:
Inventory Turnover:
Cost of goods sold
Avg.Inventory
=
$19,053
$(3,264+3092/2)
= 5.99
Years 2011 2012
Inventory Turnover 5.73 5.99
The Coca-Cola’s Inventory turnover ratios deteriorated from 2011 to 2012,
which means that its ability to sell inventory has relatively come down. In 2012
Coca-Cola had a ratio of 5.99 and in 2011 has a ratio of 5.73
In days
365/ inventory turnover = 365/5.99= 60.9=61 days
Conclusion
After applying all the ratios we got an idea that
the Coca Cola Company is a profitable firm.
Because through out the analysis of two years, we
found that the company is getting profitable
return on short term and long term investment,
their profit margin has been increased as well
and they are in the position to pay their debts
with in their resources.
22
Thank you!
23

Coca colaproject-131211124941-phpapp02

  • 1.
    Topic: Financial RatiosAnalysis of Coca-Cola 1
  • 2.
    1. Priya Balani 2.Shoaib Ahmed Memon 3. Syed Jamal Shah 4. Yashpal Advani 5. Murtaza Mudeer 2 Group Members Presented To : Ma’am Tazeen Imran
  • 3.
    3 Coca Cola International TheCoca-Cola Company is the world's largest beverage company. It is no.1 brand according to fortune 2009 survey. The company operates a franchised distribution system dating from 1889. The Coca-Cola Company is headquartered in Atlanta, Georgia. With local operations in over 200 countries around the world. Coca Cola has 150,900 employees worldwide.
  • 4.
    Our mission is: •To refresh the world in mind, body and spirit, • To inspire moments of optimism and happiness through our brands and actions, • To create value and make a difference. 4
  • 5.
    • Assessment ofthe firm’s past financial conditions • Done to find firm’s financial strengths and weaknesses • Primary Tools: – Financial Statements – Comparison of financial ratios to past. 5
  • 6.
    Objectives of RatioAnalysis • Standardize financial information for comparisons • Compare performance with past performance 6
  • 7.
    Types of Ratios •Calculations of Ratios, • Efficency/ Performance Ratios: – Activity (Turnover) Ratios, • Liquidity Ratios. 7
  • 8.
    December 31, 20122011 (In millions except par value) As Adjusted ASSETS CURRENT ASSETS Cash and cash equivalents $ 8,442 $ 12,803 Short-term investments 5,017 1,088 TOTAL CASH, CASH EQUIVALENTS AND SHORT-TERM INVESTMENTS 13,459 13,891 Marketable securities 3,092 144 Trade accounts receivable, less allowances of $53 and $83, respectively 4,759 4,920 Inventories 3,264 3,092 Prepaid expenses and other assets 2,781 3,450 Assets held for sale 2,973 — TOTAL CURRENT ASSETS 30,328 25,497 EQUITY METHOD INVESTMENTS 9,216 7,233 OTHER INVESTMENTS, PRINCIPALLY BOTTLING COMPANIES 1,232 1,141 OTHER ASSETS 3,585 3,495 PROPERTY, PLANT AND EQUIPMENT — net 14,476 14,939 TRADEMARKS WITH INDEFINITE LIVES 6,527 6,430 BOTTLERS’ FRANCHISE RIGHTS WITH INDEFINITE LIVES 7,405 7,770 GOODWILL 12,255 12,219 OTHER INTANGIBLE ASSETS 1,150 1,250 TOTALASSETS $ 86,174 $ 79,974 THE COCA-COLA COMPANYAND SUBSIDIARIES CONSOLIDATED BALANCE SHEETS 8
  • 9.
    LIABILITIES AND EQUITY CURRENTLIABILITIES Accounts payable and accrued expenses $ 8,680 $ 9,009 Loans and notes payable 16,297 12,871 Current maturities of long-term debt 1,577 2,041 Accrued income taxes 471 362 Liabilities held for sale 796 — TOTAL CURRENT LIABILITIES 27,821 24,283 LONG-TERM DEBT 14,736 13,656 OTHER LIABILITIES 5,468 5,420 DEFERRED INCOME TAXES 4,981 4,694 THE COCA-COLA COMPANY SHAREOWNERS’ EQUITY Common stock, $0.25 par value; Authorized — 11,200 shares; Issued — 7,040 and 7,040 shares, respectively 1,760 1,760 Capital surplus 11,379 10,332 Reinvested earnings 58,045 53,621 Accumulated other comprehensive income (loss) (3,385) (2,774) Treasury stock, at cost — 2,571 and 2,514 shares, respectively (35,009) (31,304 ) EQUITY ATTRIBUTABLE TO SHAREOWNERS OF THE COCA-COLA COMPANY 32,790 31,635 EQUITY ATTRIBUTABLE TO NONCONTROLLING INTERESTS 378 286 TOTAL EQUITY 33,168 31,921 TOTAL LIABILITIES AND EQUITY $ 86,174 $ 79,974 BALANCE SHEETS Cont’d 9
  • 10.
    Year Ended December31, 2012 2011 (In millions except per share data) As Adjuste d NET OPERATING REVENUES $ 48,017 $ 46,542 Cost of goods sold 19,053 18,215 GROSS PROFIT 28,964 28,327 Selling, general and administrative expenses 17,738 17,422 Other operating charges 447 732 OPERATING INCOME 10,779 10,173 Interest income 471 483 Interest expense 397 417 Equity income (loss) — net 819 690 Other income (loss) — net 137 529 INCOME BEFORE INCOME TAXES 11,809 11,458 Income taxes 2,723 2,812 CONSOLIDATED NET INCOME 9,086 8,646 Less: Net income attributable to noncontrolling interests 67 62 NET INCOME ATTRIBUTABLE TO SHAREOWNERS OF THE COCA-COLA COMPANY $ 9,019 $ 8,584 BASIC NET INCOME PER SHARE1 $ 2.00 $ 1.88 DILUTED NET INCOME PER SHARE1 $ 1.97 $ 1.85 AVERAGE SHARES OUTSTANDING 4,504 4,568 Effect of dilutive securities 80 78 AVERAGE SHARES OUTSTANDING ASSUMING DILUTION 4,584 4,646 THE COCA-COLA COMPANY AND SUBSIDIARIES CONSOLIDATED STATEMENTS OF INCOME 10
  • 11.
    Calculations of Ratios GrossProfit Margin: Gross Profit Margin:= Gross Profits Sales = $28,964 $48,017 = 0.60x100 = 60.32% Years 2011 2012 Gross Profit Margin % 60.90 60.32 The ratio should be high according to the definition. Because higher the ratio, higher will be the firm’s ability to produce goods and services at low cost with high sales. Here in this table there is small difference between the ratios in two years, but its still high, which means it is favorable. 11
  • 12.
    12 Net Profit Margin: NetProfit Margin:= Net profit before tax Net Sales = $11,809 $48,017 = 0.245x100=24.59% Years 2011 2012 Net Profit Margin % 21.80 24.59 Coca-Cola’s operating profit margin has increased in 2012 than the margin in 2011 by approximately 3%. This increase in Operating Profit Marin is mainly due to growth of net revenue, good cost control and strong productivity in company in 2012. This higher margin reflects that the Coca-Cola is more efficient cost management or the more profitable business.
  • 13.
    Return on CapitalEmployed: ROCE = Net profit before tax Avg. Capital (Euity) = $11,809 $33,168 = 0.356x100=35.6% Years 2011 2012 ROCE % 35.9 35.6 The decrease in Return on Assets indicates that the company is generating less profits from all of its resources in the year 2012 as compared to the year 2011. The higher of this ratio is, the better for the company. Therefore this decrease in Coca-Cola’s ratio is indicating that the company is not that much prospering. 13
  • 14.
    14 Earning Per Share: EPS: Netincome issued share/common shocks par value = $9,019 $1,760 /0.25 = $9,019 $7,040 =1.28 Years 2011 2012 EPS 1.21 1.28 In 2011 Coca-Cola company earned an income of 1.21 dollars per share which increased to 1.28 in 2012
  • 15.
    Liquidity Ratios Current Ratio: 09.1 27,821$ 30,328$ sLiabilitieCurrent AssetsCurrent :RatioCurrent Years 2011 2012 Current Ratio 1.05 1.09 In 2011, the firm’s ability to cover its current liabilities with its current assets was 1.05. In 2012, the ratio goes up to 1.09 as compared to 2011, which means that the company has the ability to pay its liabilities, as the definition says that higher the ratio, greater the ability of the firm to pay its bills. This tells that Coca-Cola is improving their liquidity and efficiency, because their current ratio is improving. 15
  • 16.
    16 97.0 27,821$ 064,72$ sLiabilitieCurrent Inventory-AssetsCurrent :RatioQuick  Quick Ratio: Years2011 2012 Quick Ratio 0.92 0.97 According to the definition of Acid Test Ratio, the company should have the ability to pay its liabilities through its most liquid assets. The table shows that in 2011, the firm has the ratio 0.92 cents. Then we observe a slight improvement in 2012. So we can figure out from the ratios that Coca-Cola still cannot pay its debts without its inventory. This leads us to believe that Coca-Cola is a somewhat risky business, even though it is the largest in the nonalcoholic beverage industry.
  • 17.
    Debt to EquityRatio: Debt to Equity Ratio: Longterm Debt Equity+Long Term Debt = $14736 $33168+14736 = $14736 $47904 = 0.307 Years 2011 2012 Debt to equity ratio 0.299 0.307 The ratio shows the company’s ability to cover its debts to equity through its long term debts and equity. The ratio was 0.299 in 2011, then goes up in 2012. The ratio has to be low. So we can interpret that in the year 2012, the risk of the firm is getting higher as the ratio goes up. 17
  • 18.
    18 Working Capital Cycle: WCC: RT(Debtors)+IT(stocks)-PT(Creditor) = $9.92+5.99-2.15 =13.76 Years2011 2012 WCC 13.28 13.76 Turnover in days= 365/13.76= 26.5 days Coca-cola Company has working capital cycle turnover days in 2012 decreased to 26.5days from 27.48 days in 2011
  • 19.
    Debtors Receivable turnover: Receivables Turnover: NetSales Avg.Acc-Recievable = 48017 (4759+4920 /2) = 48017 4839 = 9.92 Years 2011 2012 Receivable Turnover 9.6 9.92 The ability of the firm of collecting the receivables in the specific time. Here in the year 2011 the turnover in days was almost 38, but the collection days decrease in the year 2012 and the collection period of approximately 36 days is well within the 60 days allowed in the credit terms. This shows that the collection is faster as compared to the previous year. 19 In days 365/ inventory turnover = 365/9.92= 36.7=37 days Efficiency/ Performance Ratios
  • 20.
    20 Creditors- Payable Turnover: PayableTurnover: Net purchases(COGS) Avg.Acc- payable = 19053 (8680+9009 /2) = 19053 8845 = 2.15 Years 2011 2012 Payable Turnover 2.05 2.15 Coca-Cola’s average period for payment has reduce to 170 days in 2012 which was 178 days in 2011. This reduction in average payment period shows that how efficiently company is paying back their creditors and also assuring that payments are being made in a prompt manner by Coke to its creditors. This period should remain low as much as possible. In days 365/ inventory turnover = 365/2.15= 169.7=170 days
  • 21.
    21 Inventory Stocks TurnoverRatio: Inventory Turnover: Cost of goods sold Avg.Inventory = $19,053 $(3,264+3092/2) = 5.99 Years 2011 2012 Inventory Turnover 5.73 5.99 The Coca-Cola’s Inventory turnover ratios deteriorated from 2011 to 2012, which means that its ability to sell inventory has relatively come down. In 2012 Coca-Cola had a ratio of 5.99 and in 2011 has a ratio of 5.73 In days 365/ inventory turnover = 365/5.99= 60.9=61 days
  • 22.
    Conclusion After applying allthe ratios we got an idea that the Coca Cola Company is a profitable firm. Because through out the analysis of two years, we found that the company is getting profitable return on short term and long term investment, their profit margin has been increased as well and they are in the position to pay their debts with in their resources. 22
  • 23.

Editor's Notes

  • #5 October 2000
  • #6 October 2000
  • #7 October 2000
  • #8 October 2000
  • #12 October 2000
  • #14 October 2000
  • #16 October 2000
  • #18 October 2000
  • #20 October 2000
  • #21 2012 Calculations Payables turnover = Net operating revenues ÷ Trade accounts payable = 48,017 ÷ 1,969 = 24.39