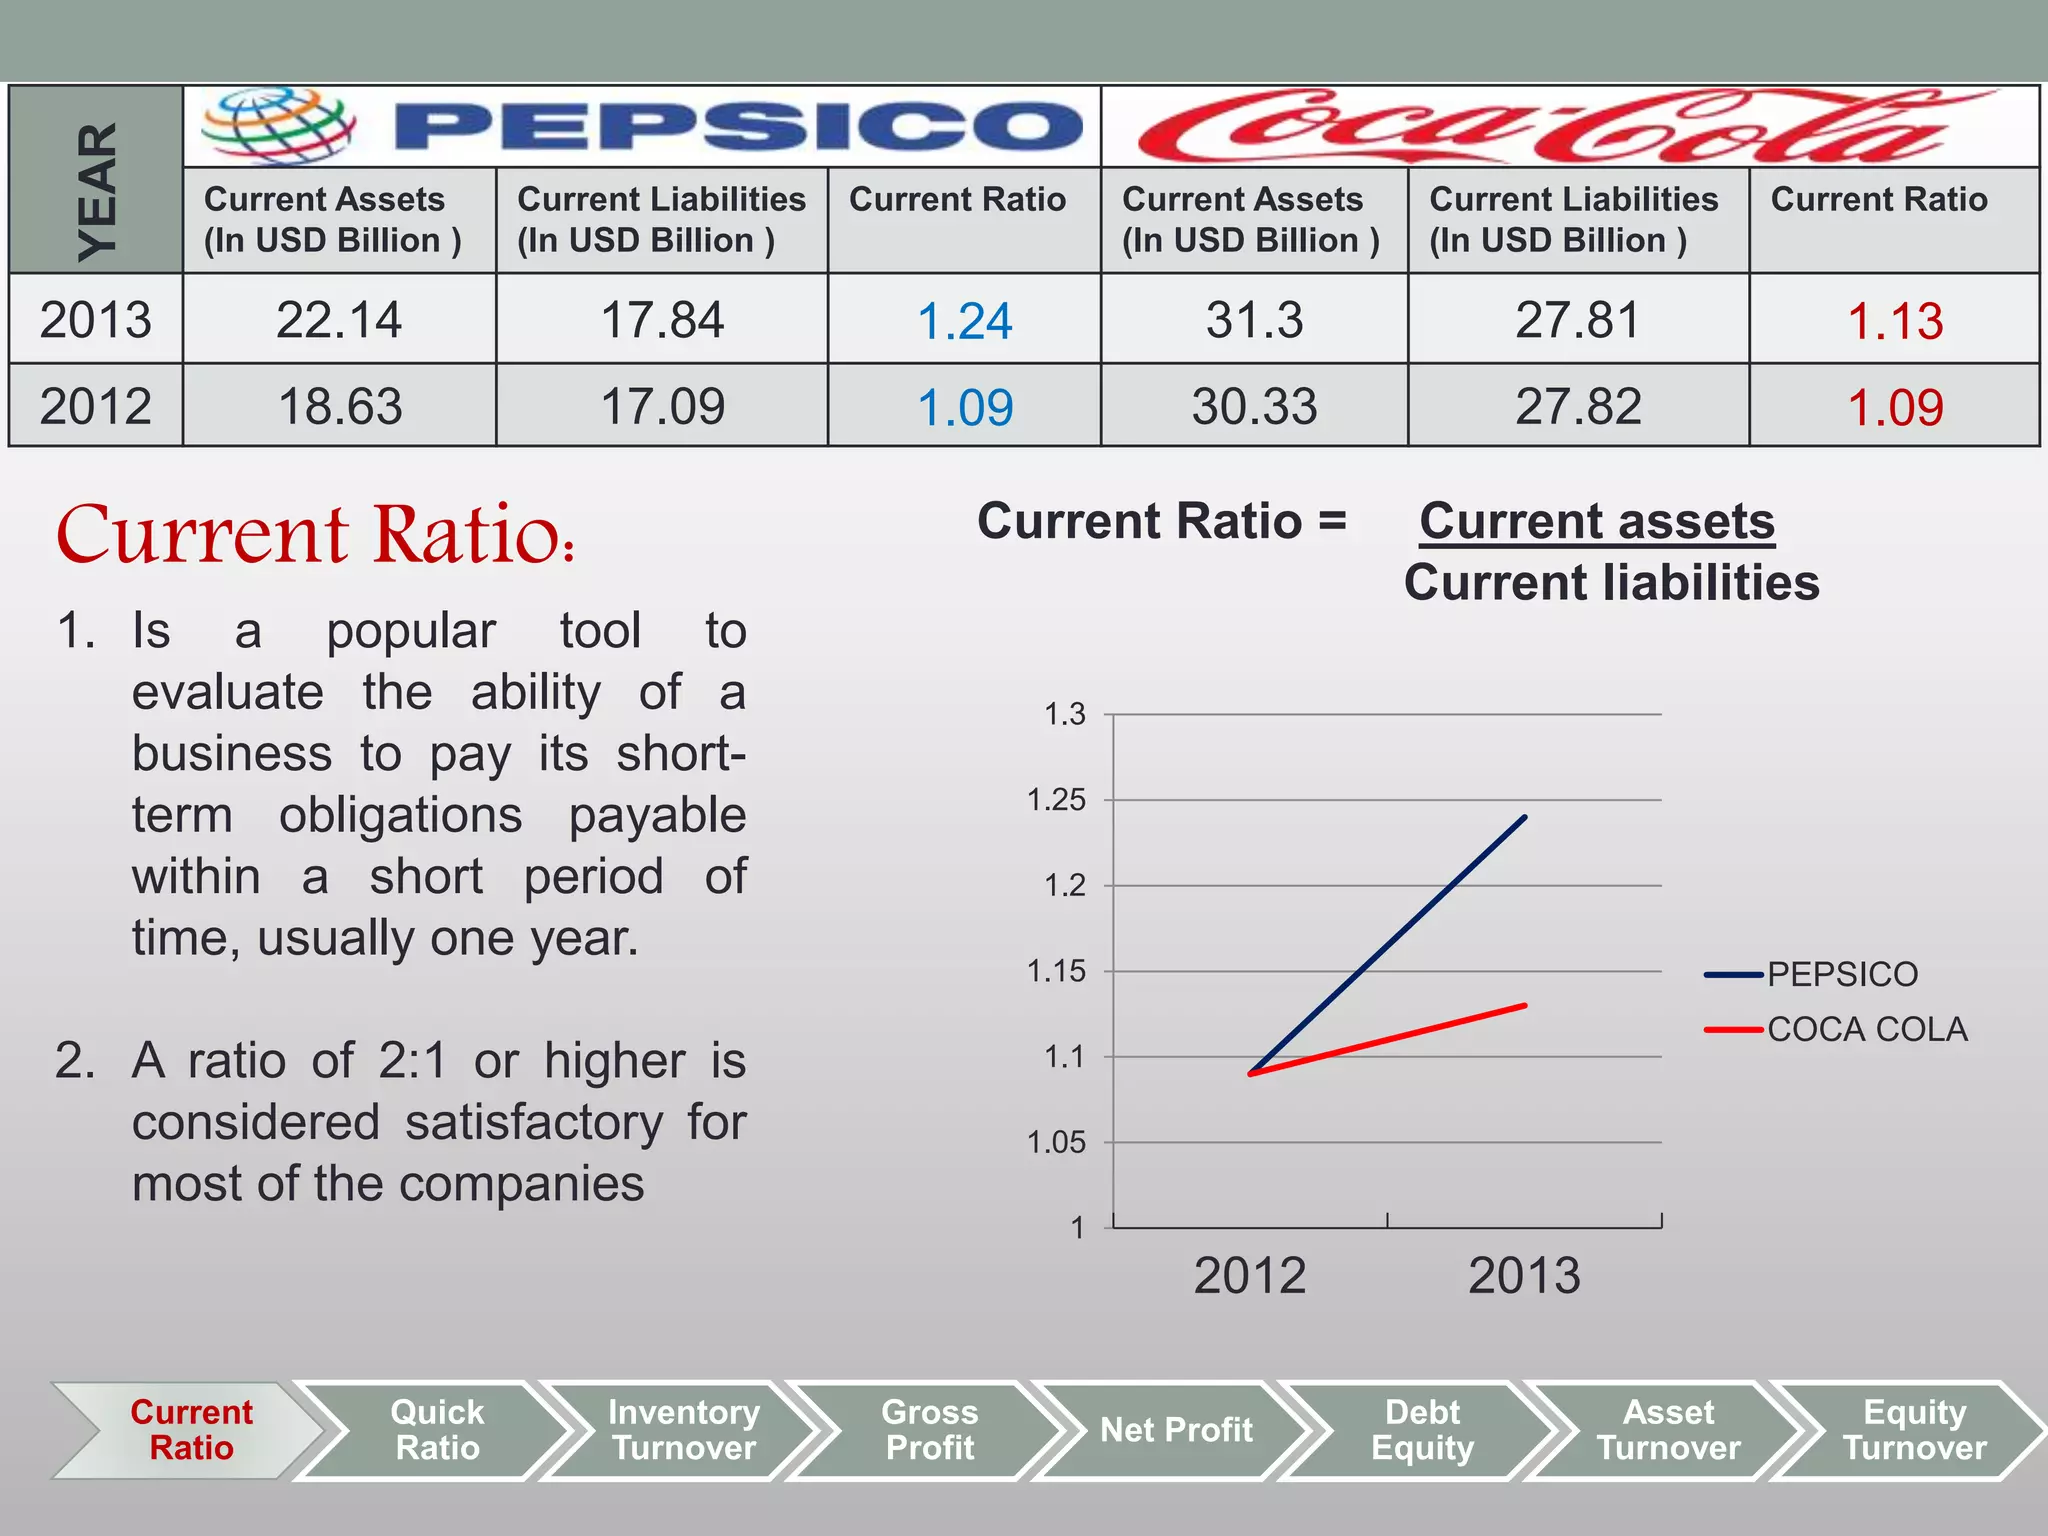
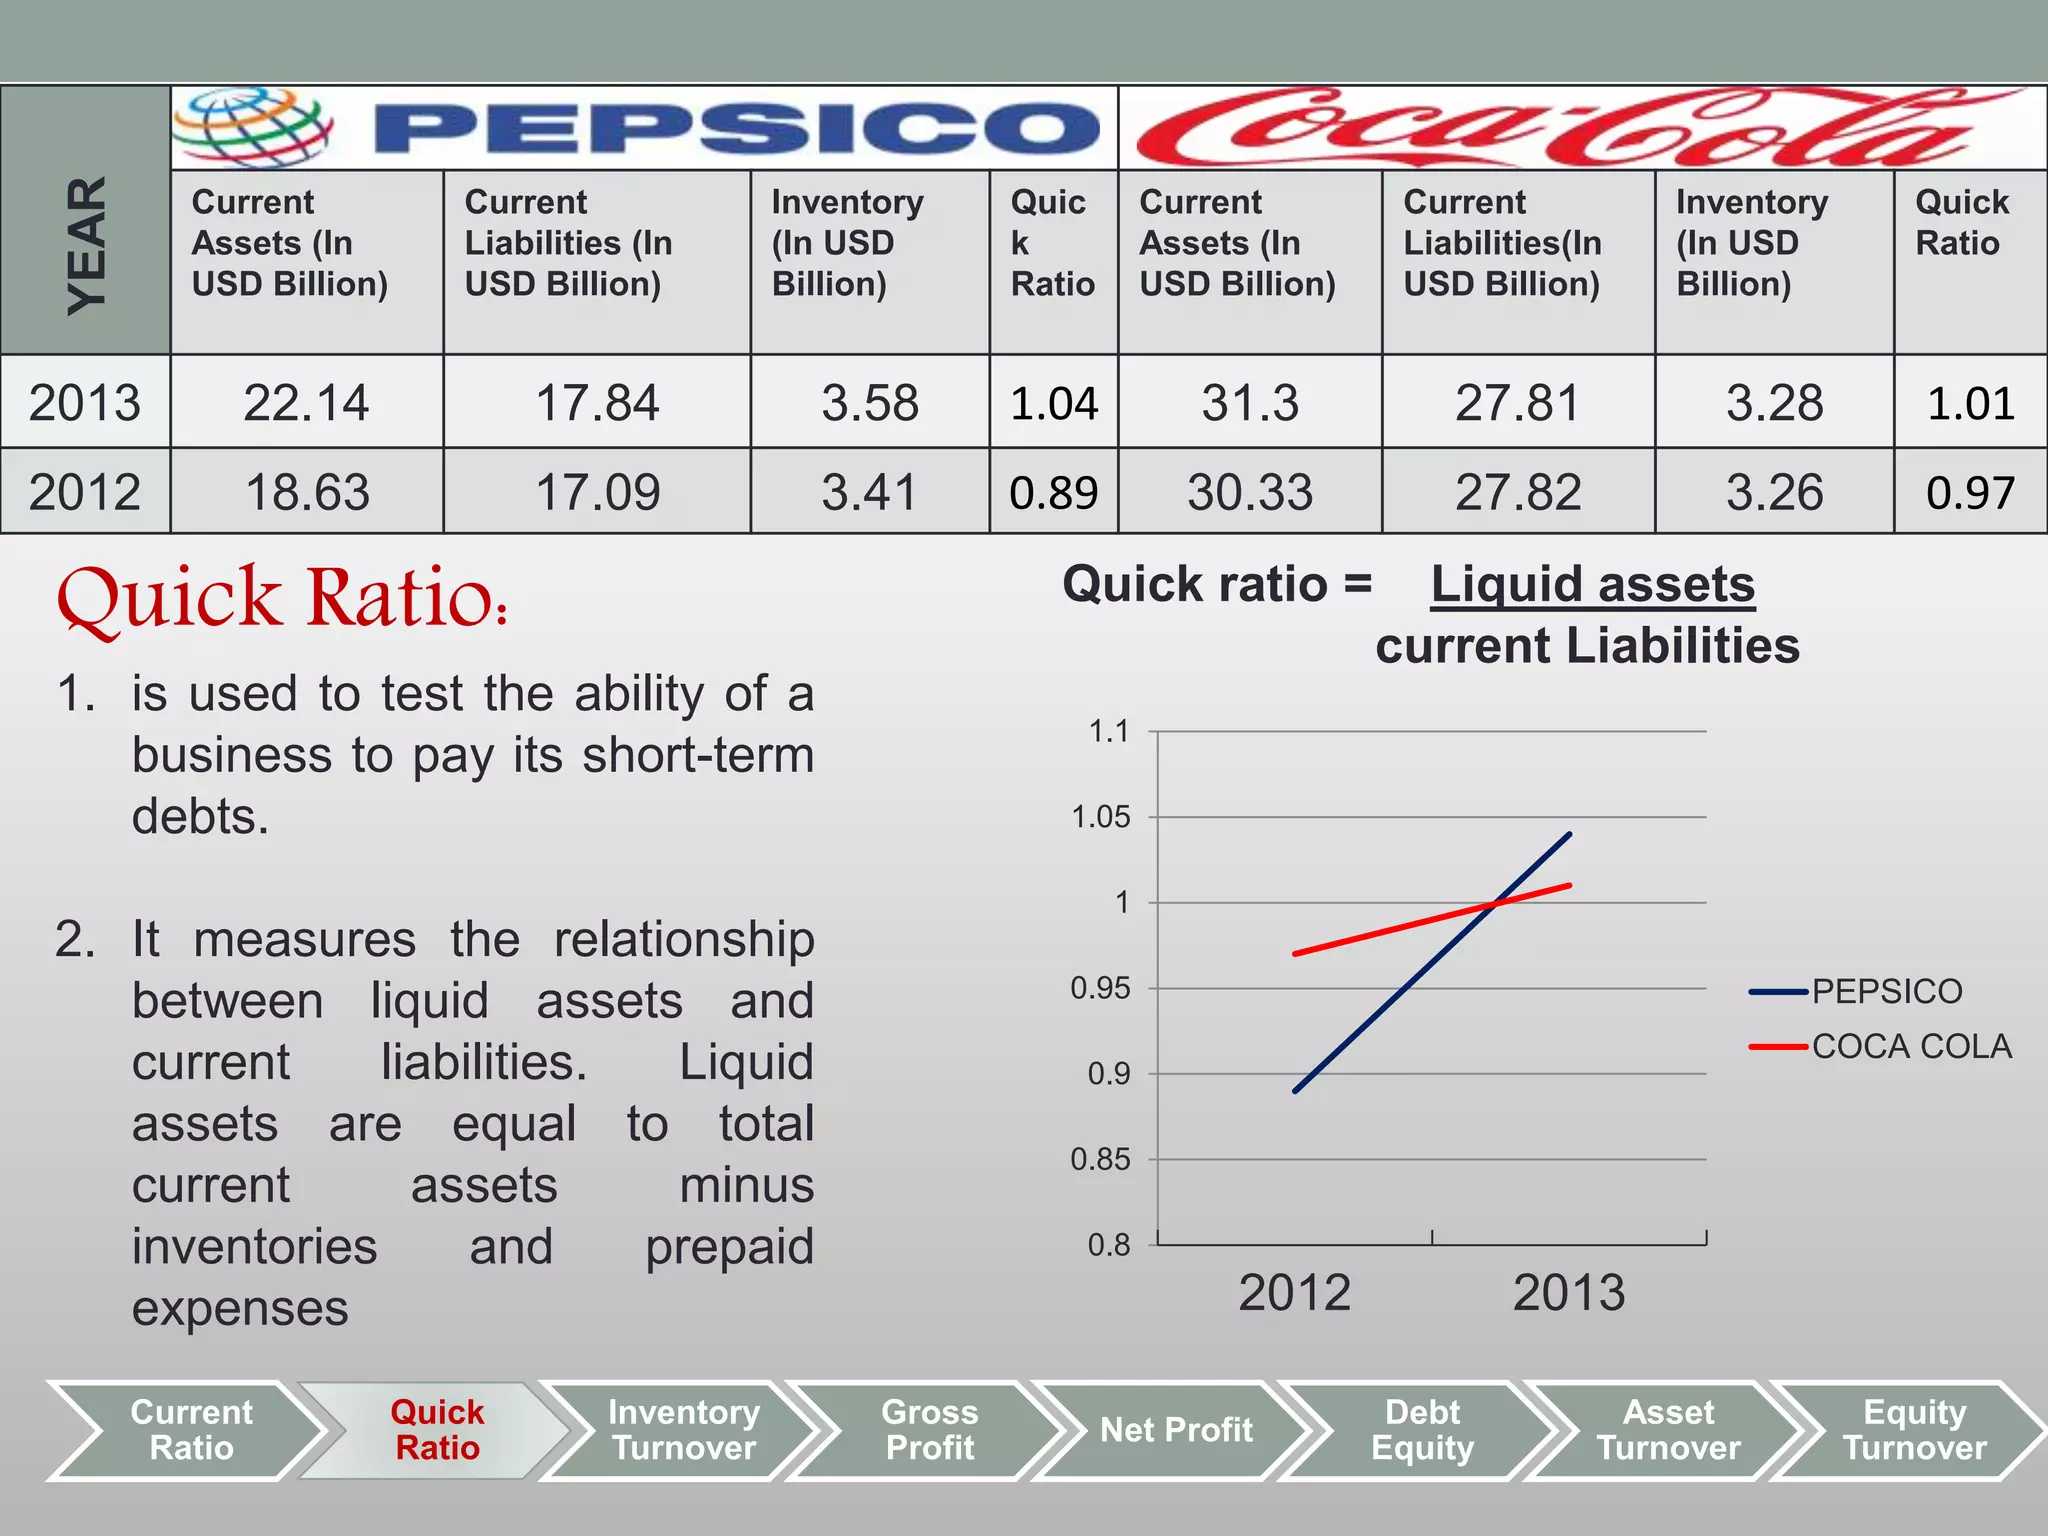
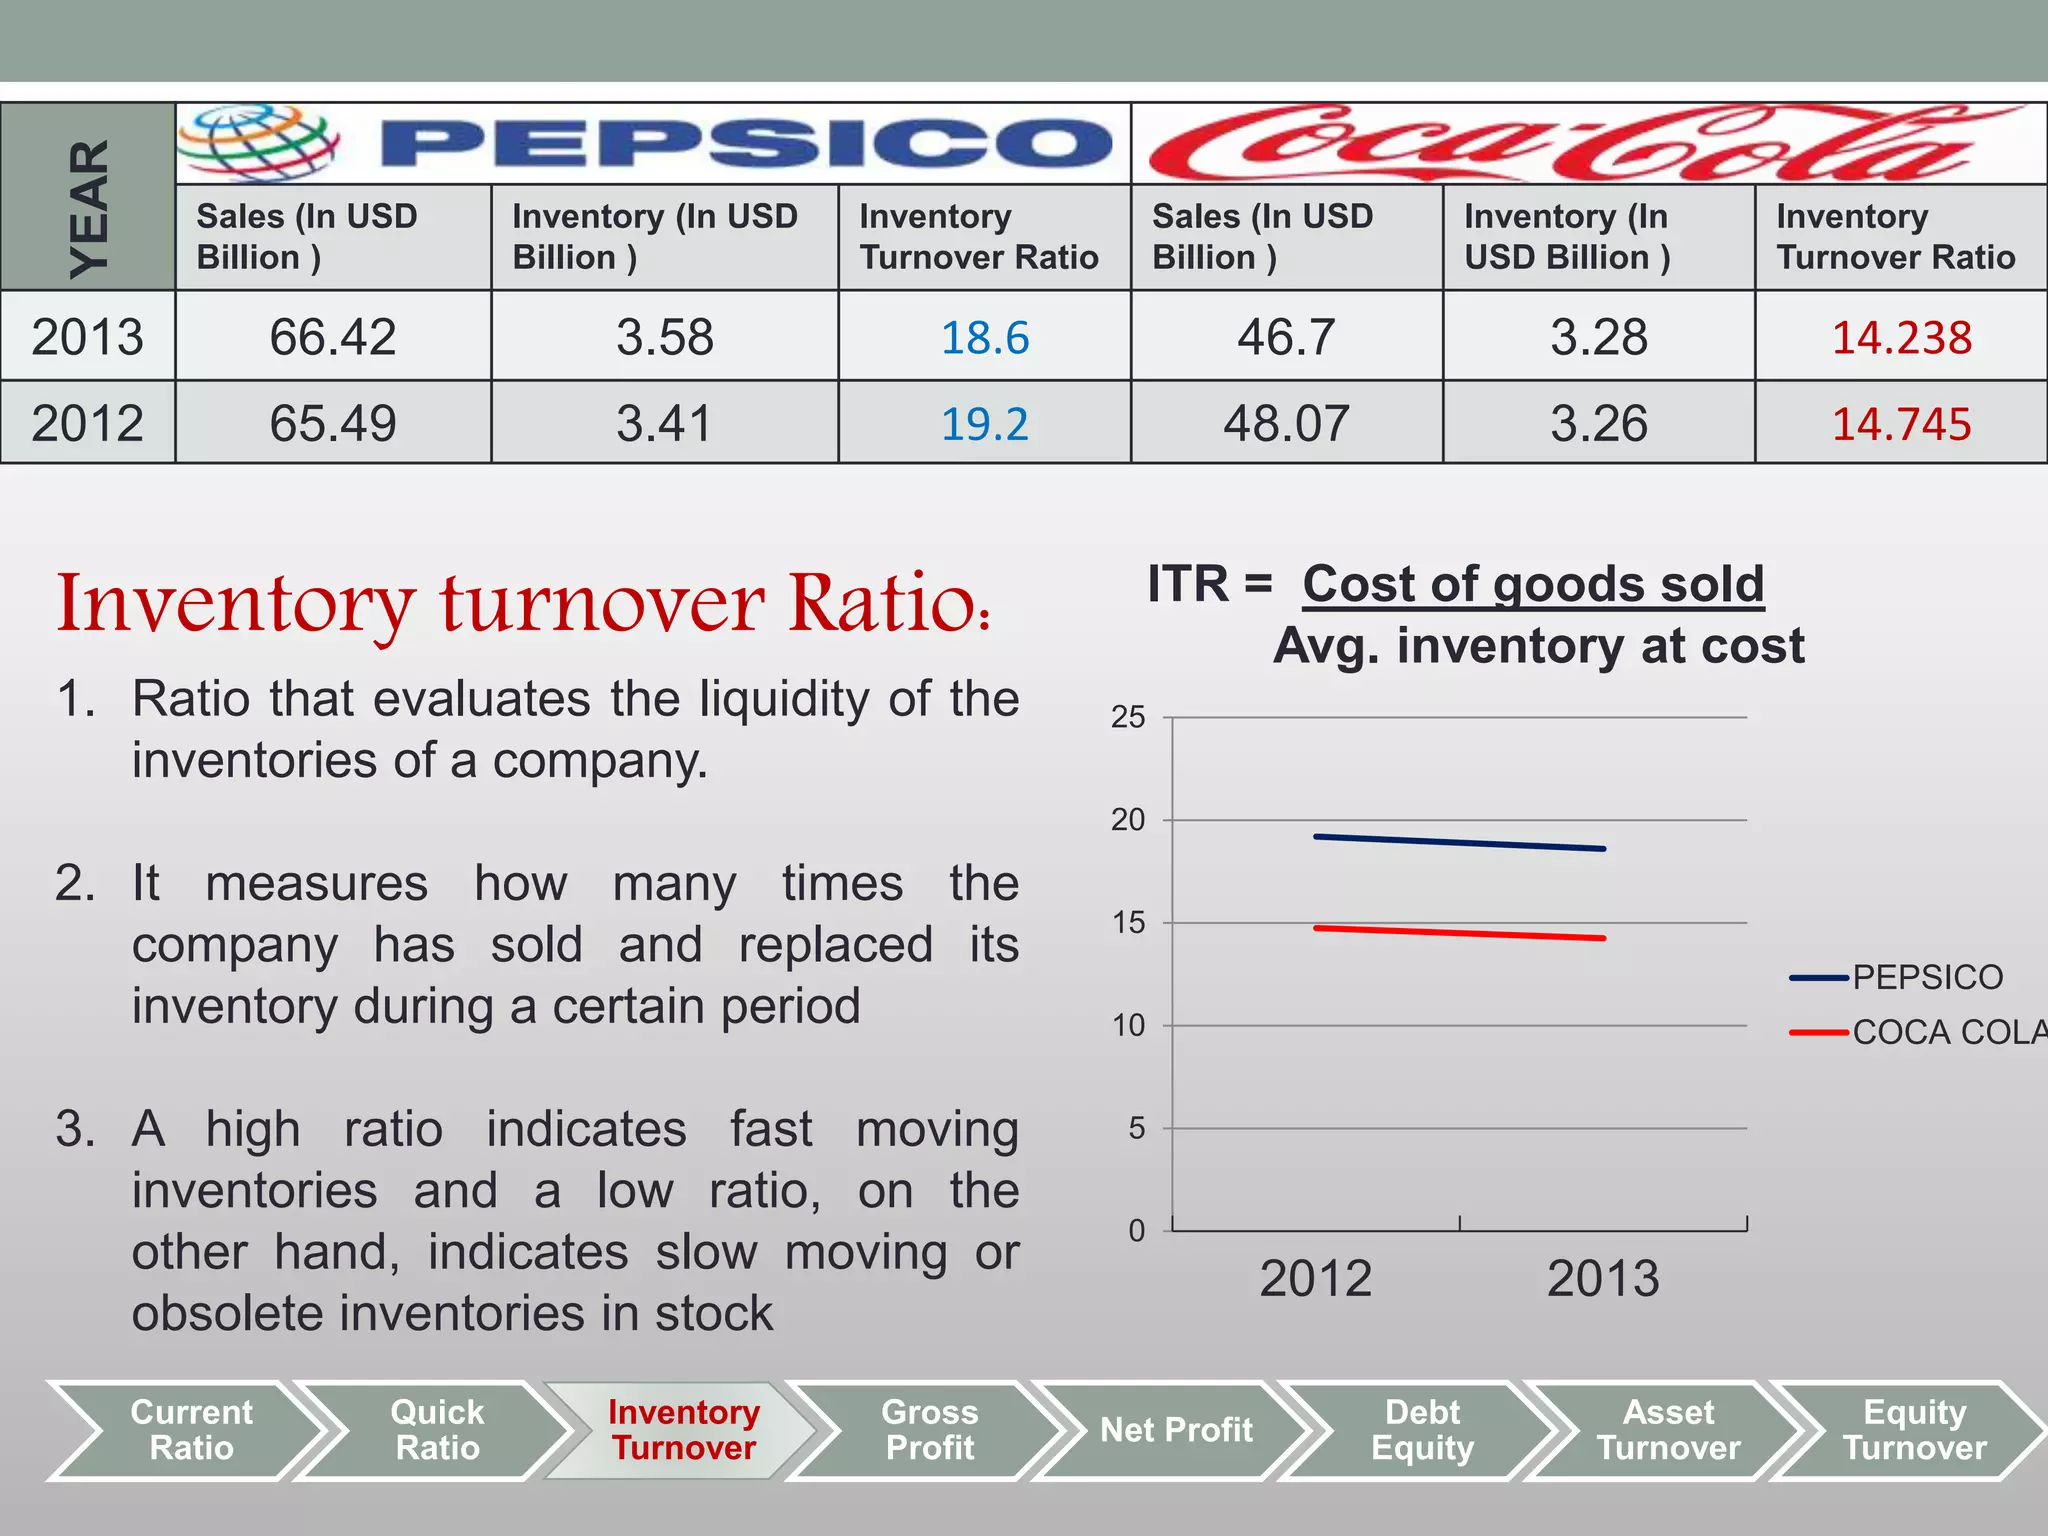
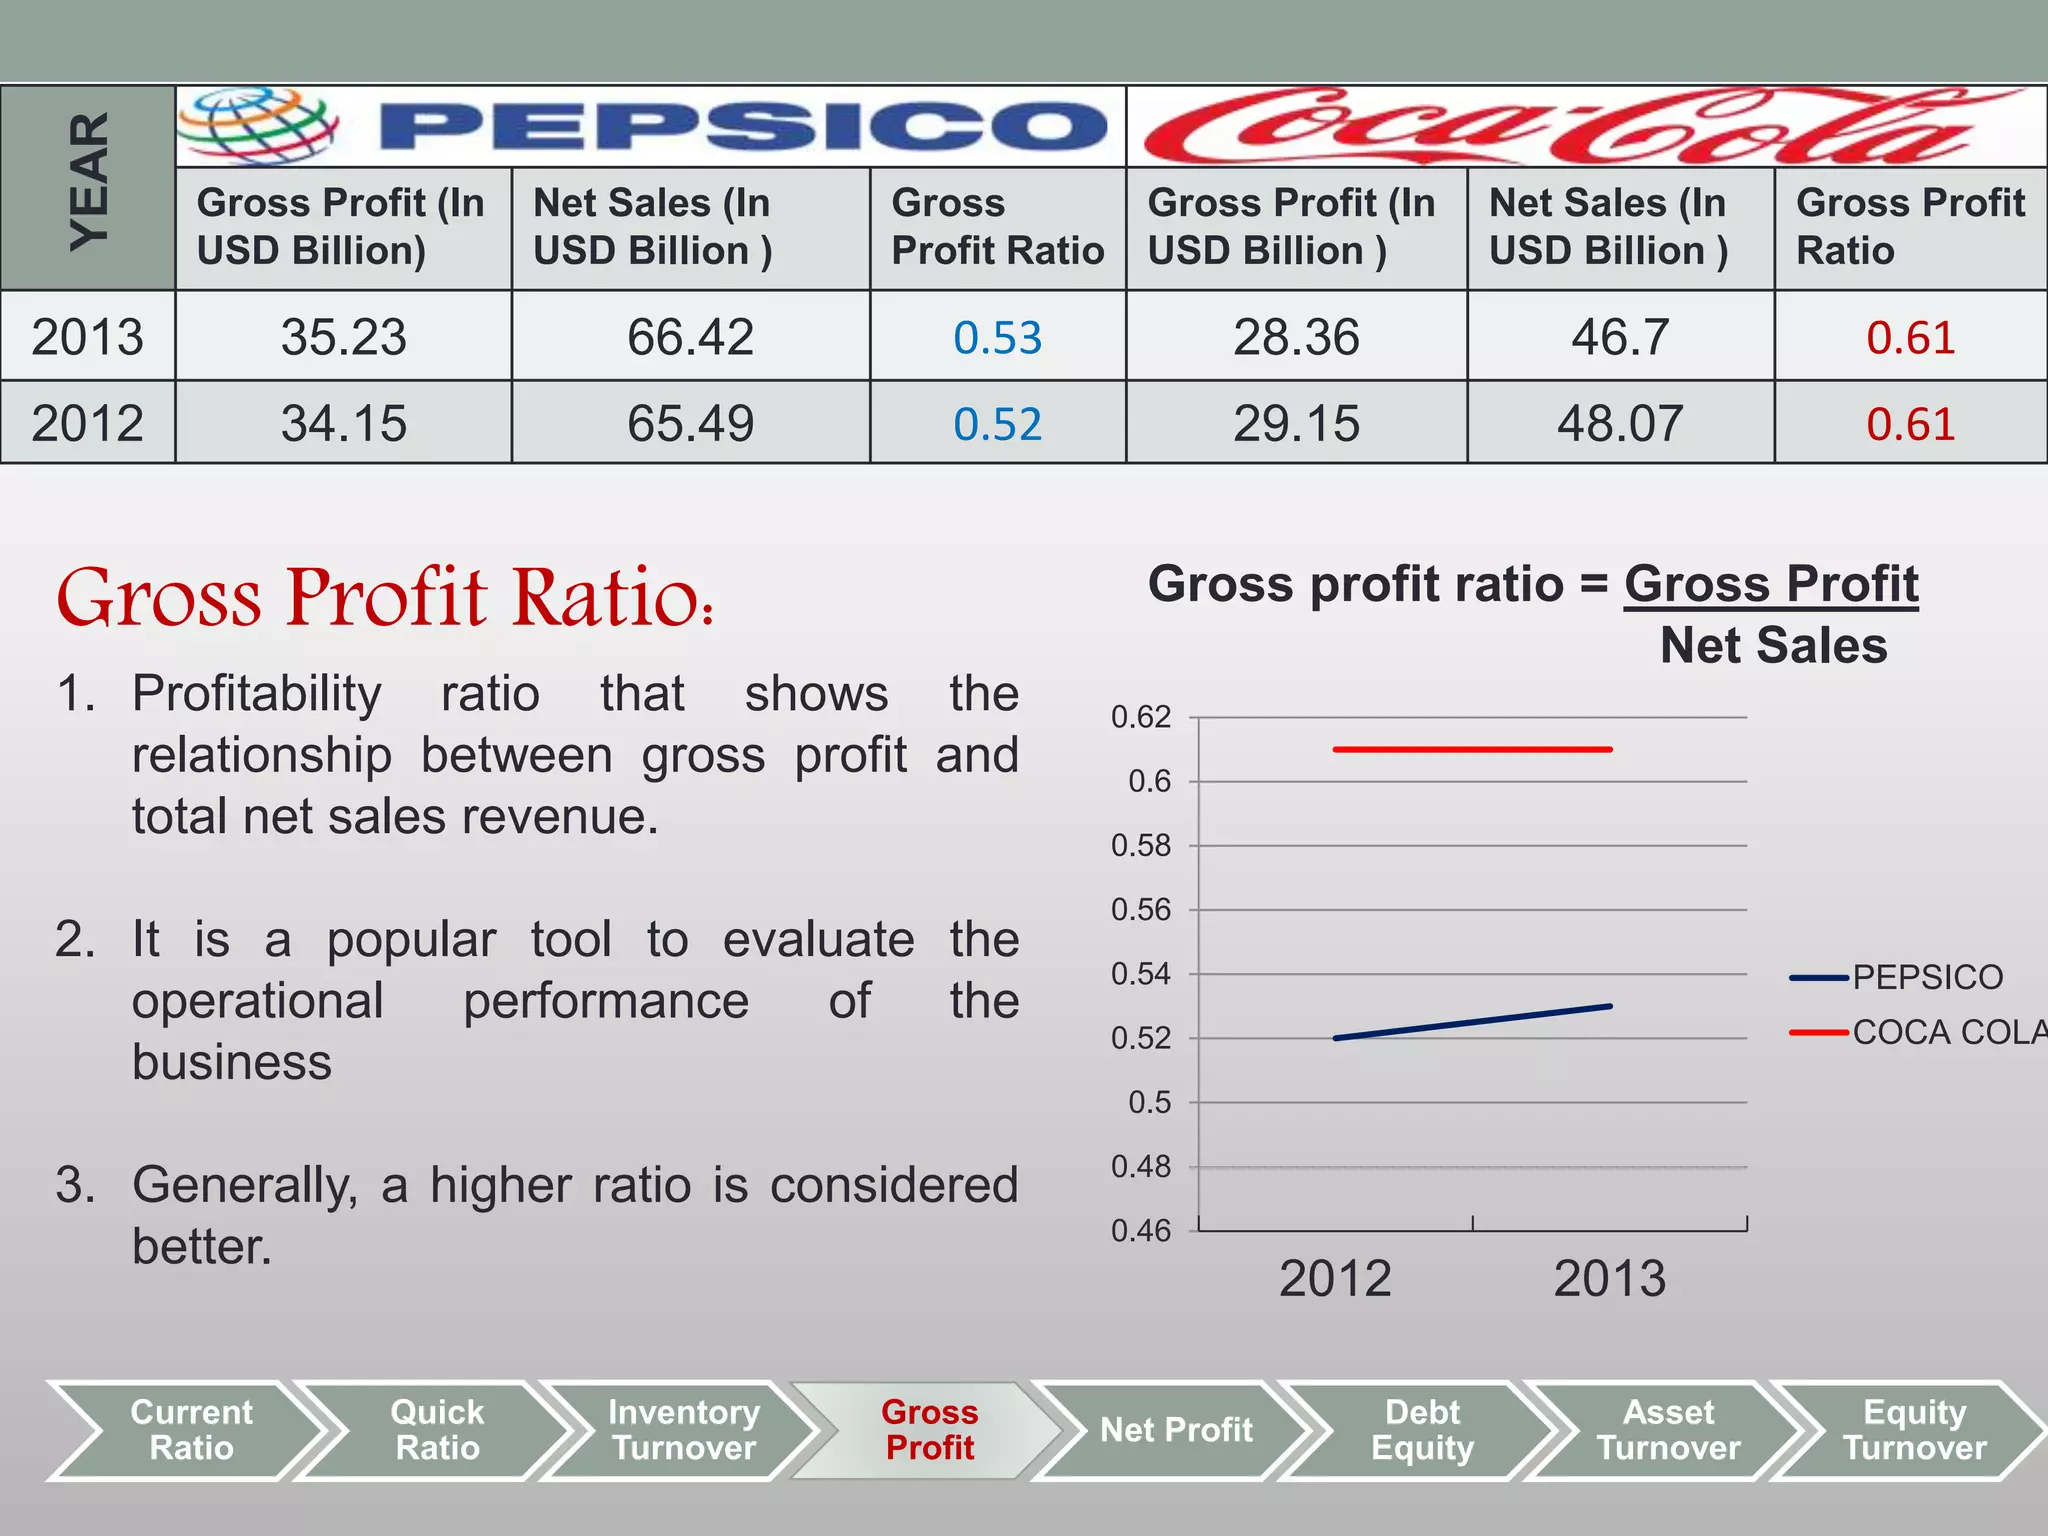
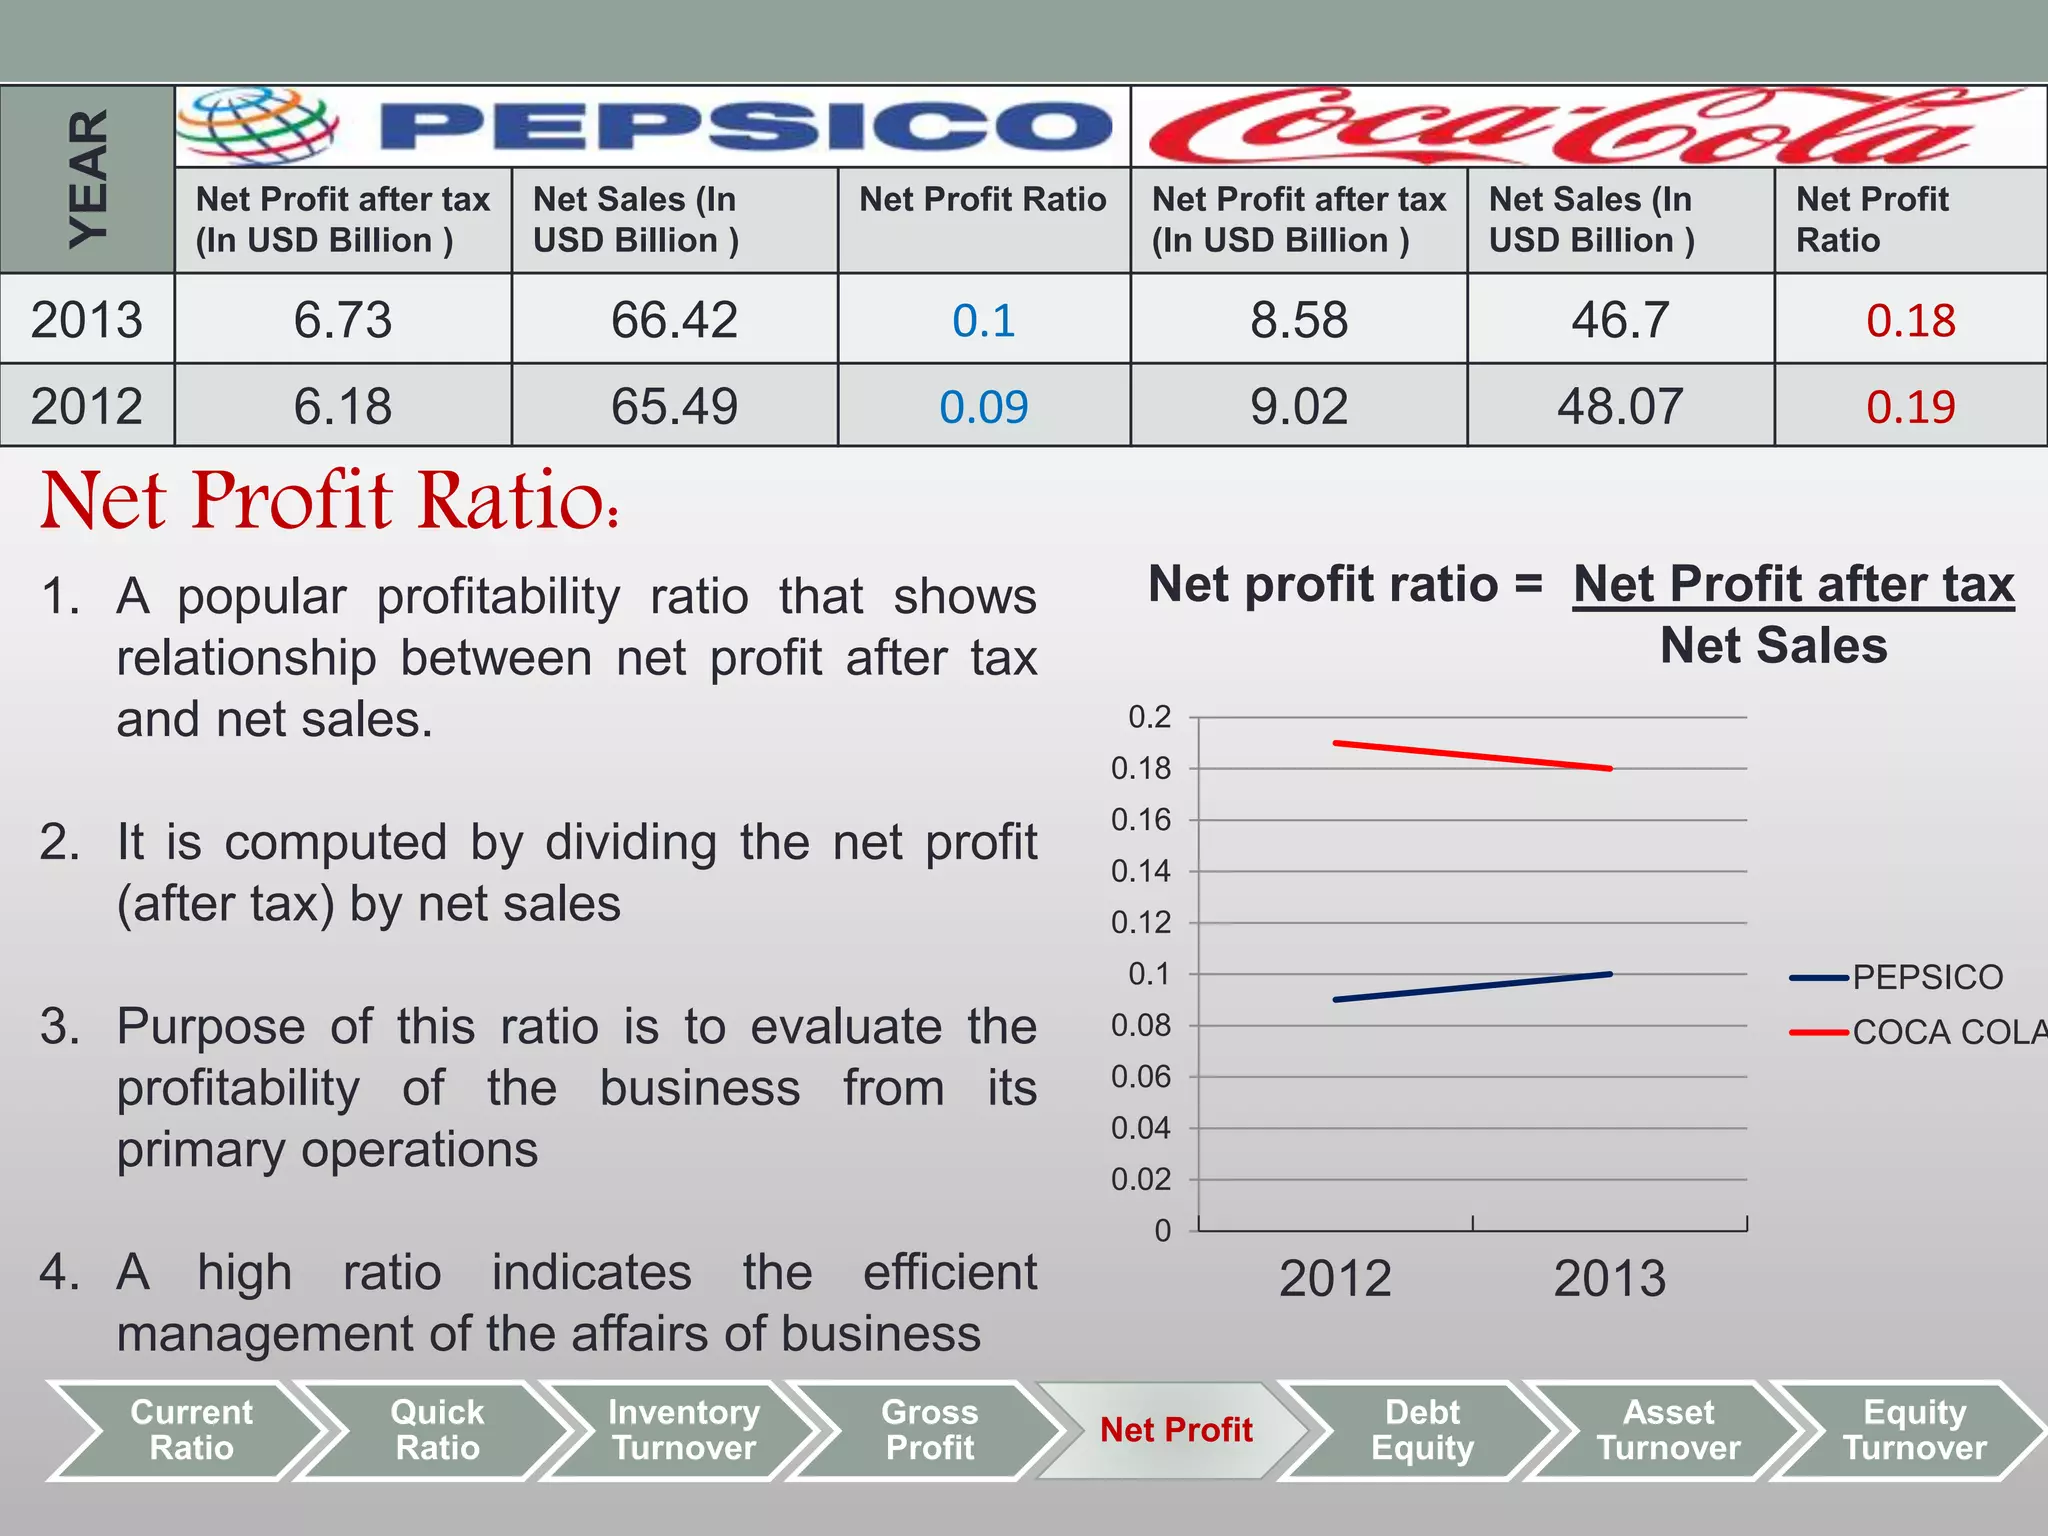
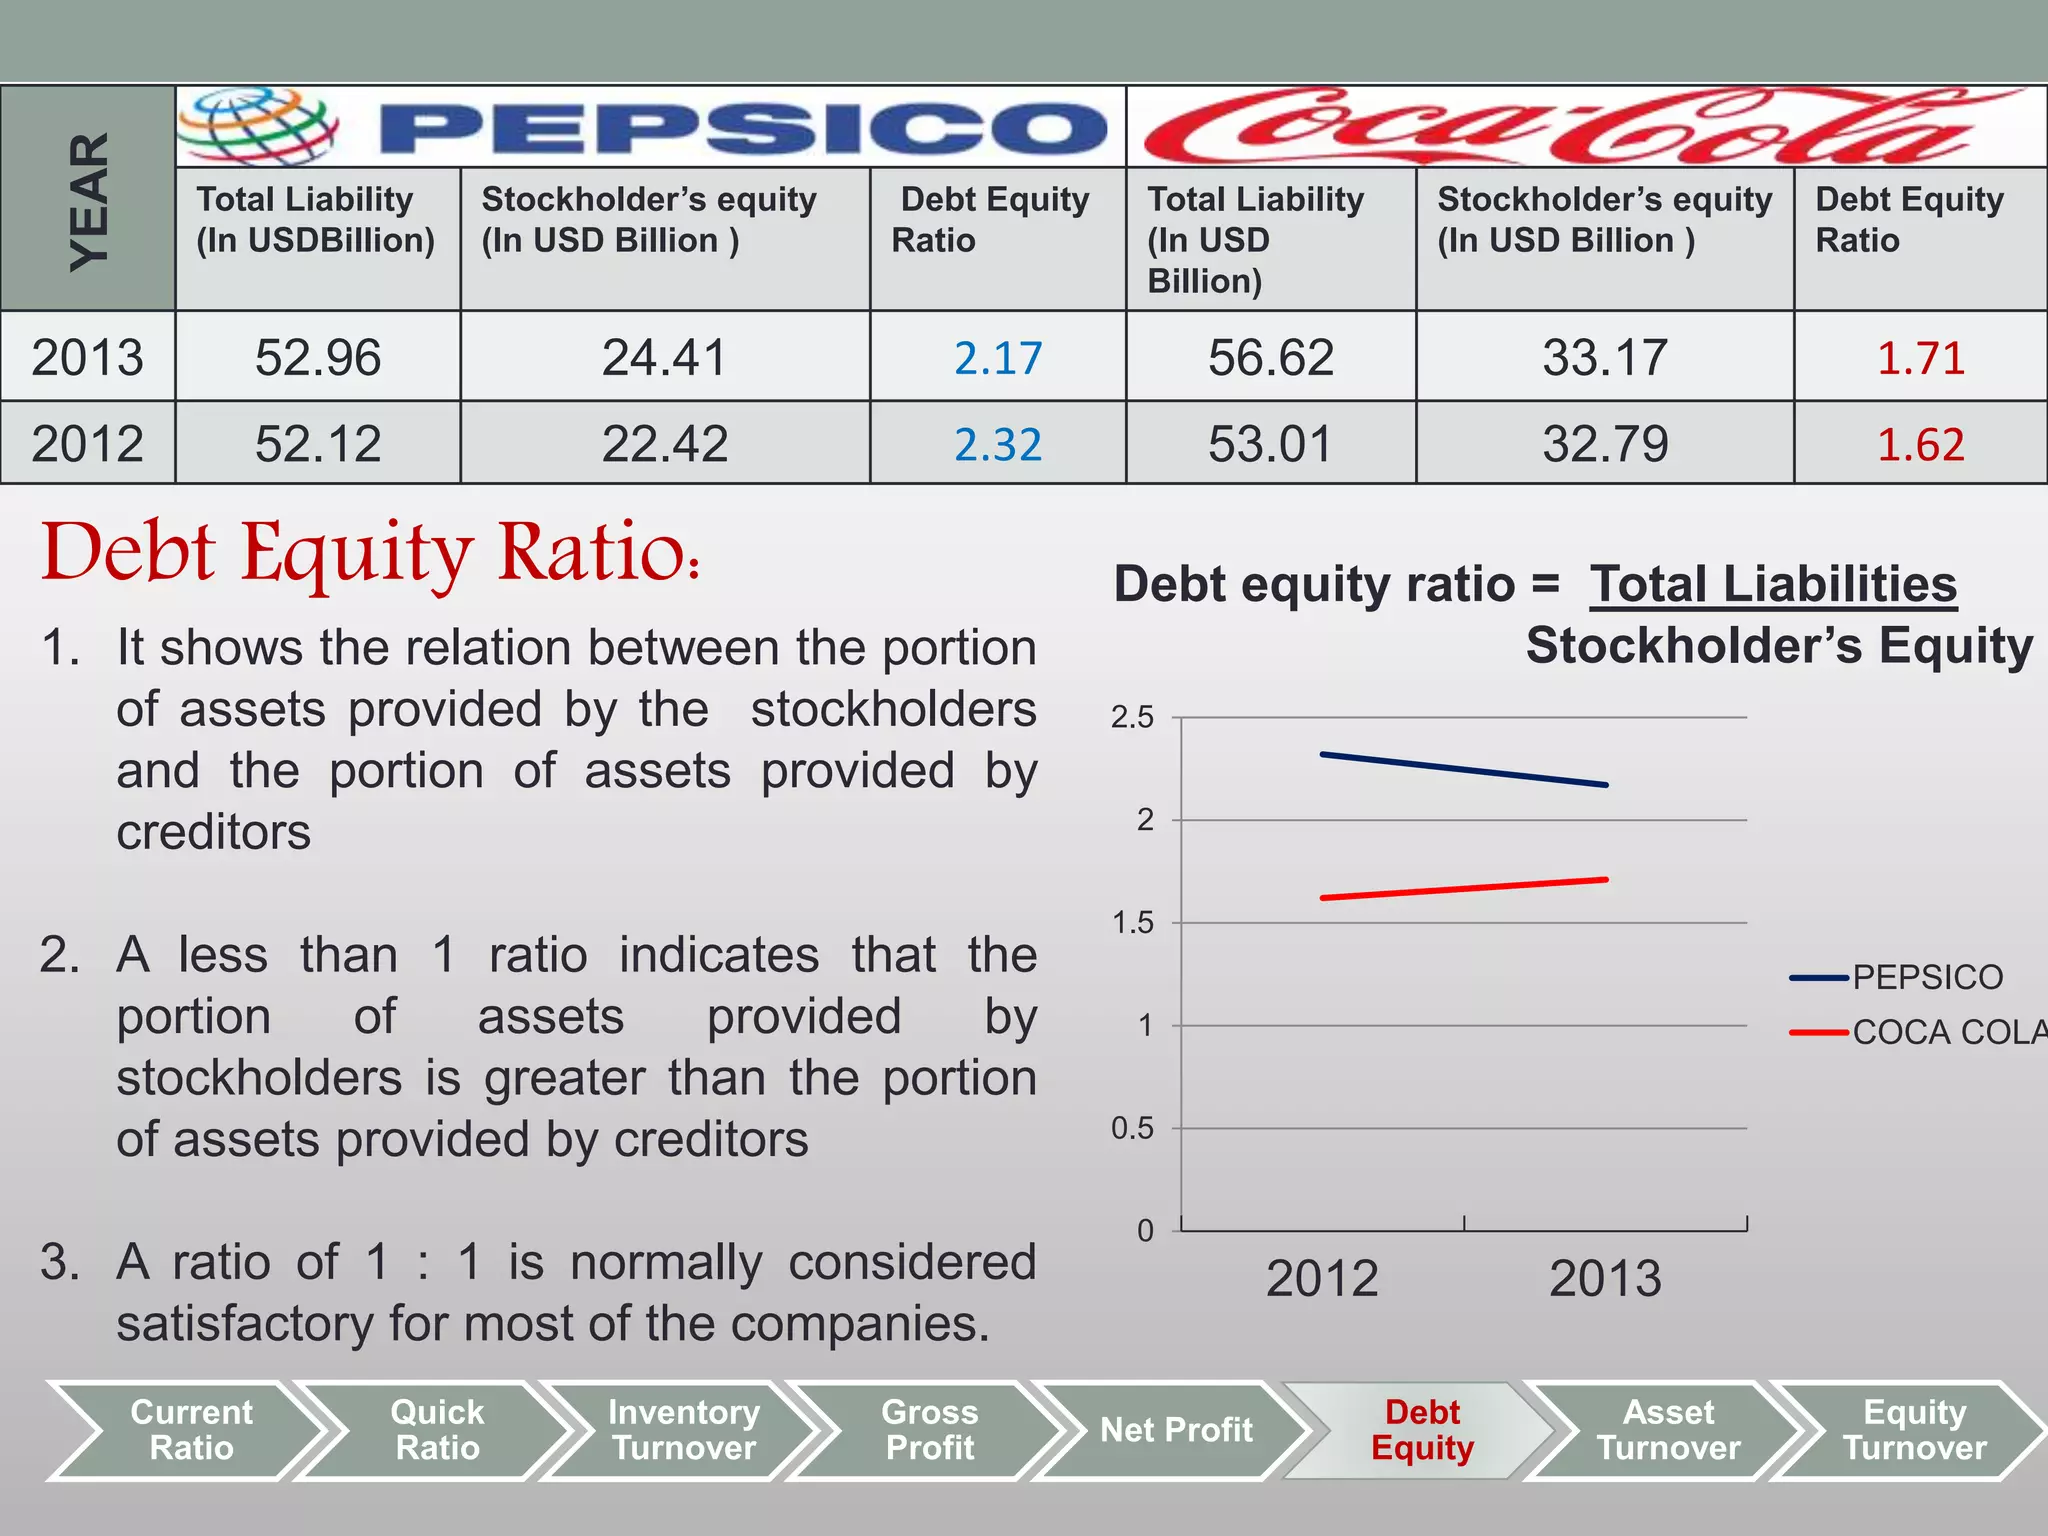
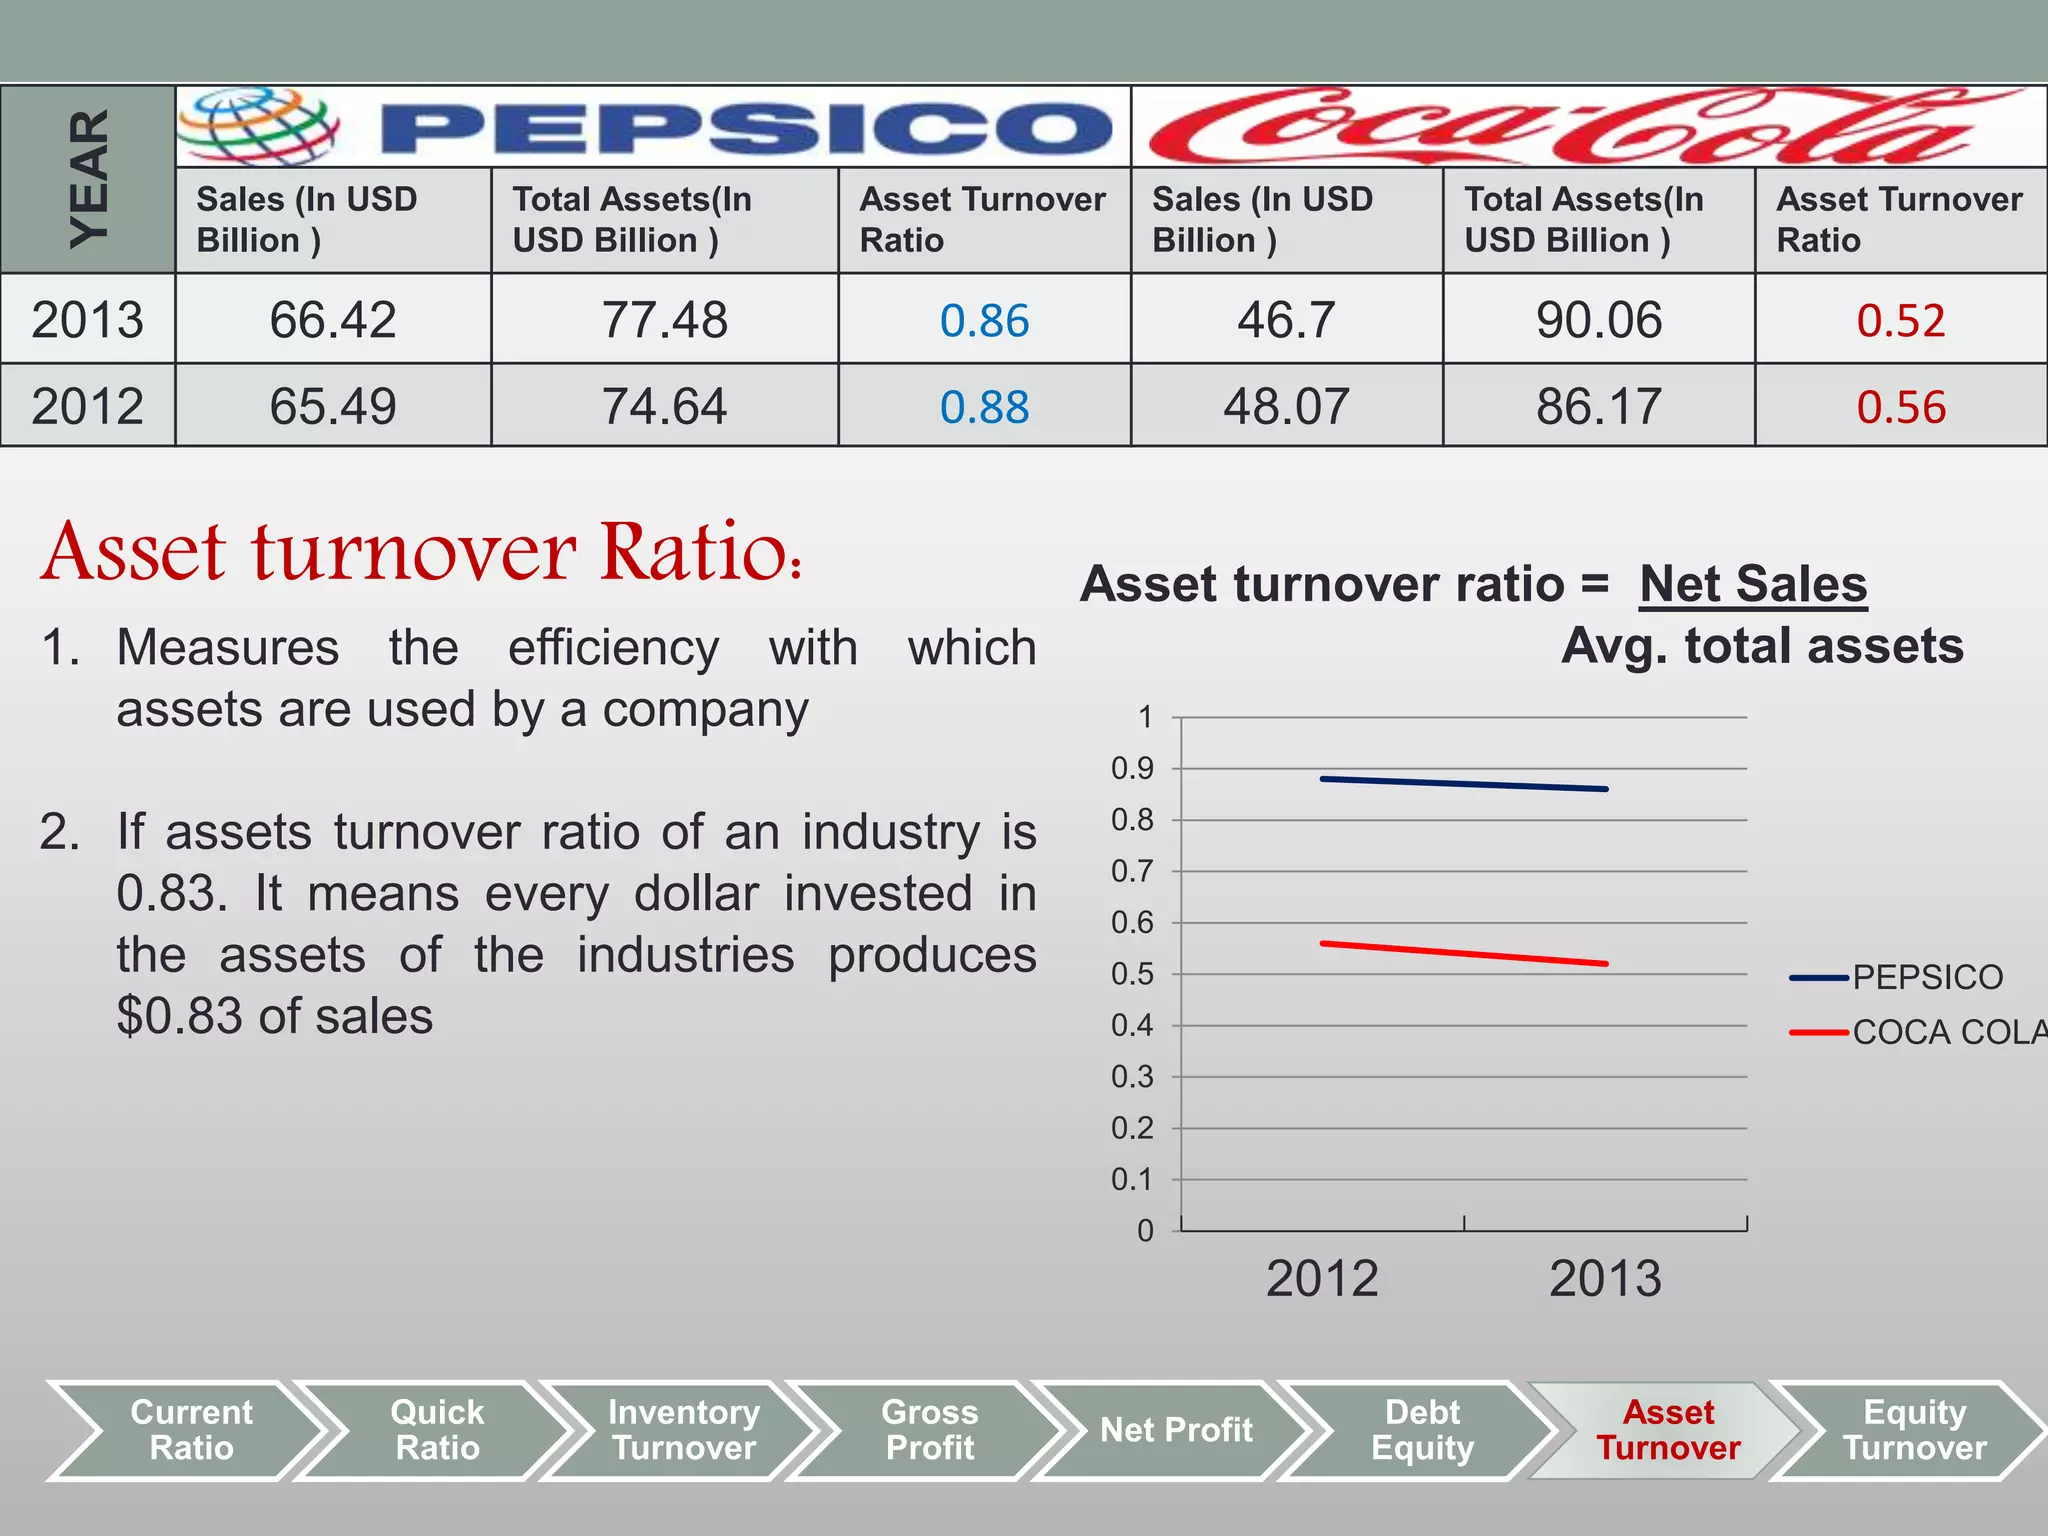
The document compares the financial ratios of PepsiCo and Coca Cola for the years 2012 and 2013. It analyzes several key ratios including current ratio, quick ratio, inventory turnover, gross profit ratio, net profit ratio, debt equity ratio, asset turnover ratio, and equity turnover ratio. For most ratios, PepsiCo performed better than Coca Cola in 2013, though Coca Cola had higher gross profit and net profit ratios. The document provides definitions and calculations for each ratio.