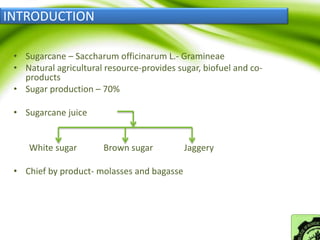
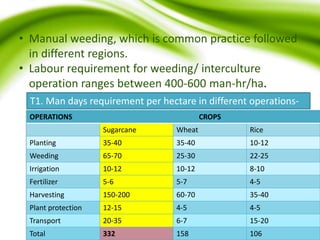
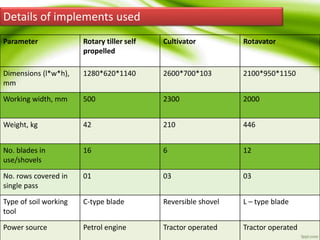
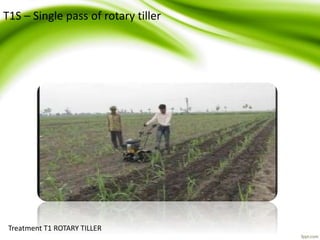
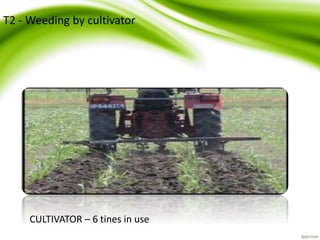
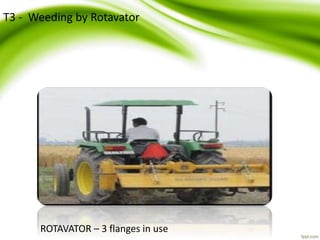
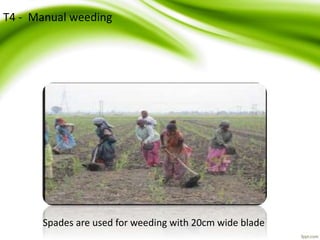
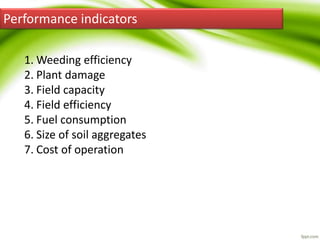
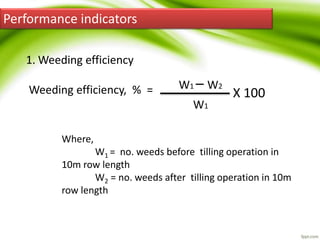
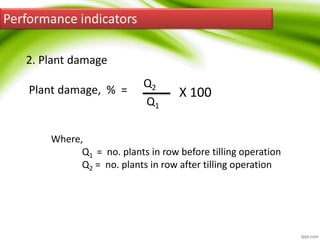
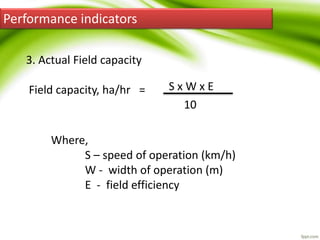
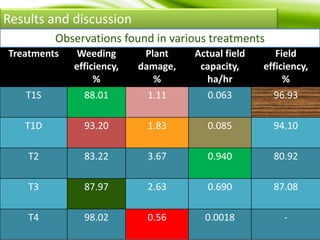
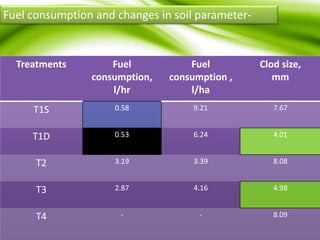
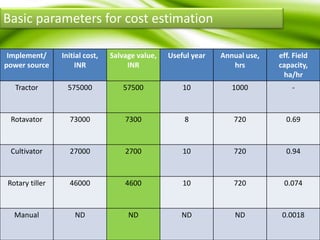
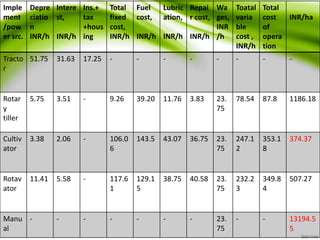
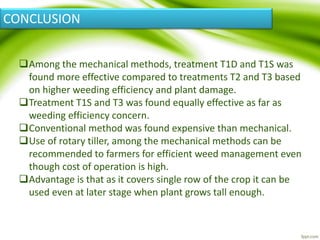
seminar on
COMPARATIVE PERFORMANCE EVALUATION OF DIFFERENT
MECHANICAL IMPLEMENT FOR WEED CONTROL IN
SUGARCANE
PRESENTED BY
BELE G M
2012AE/03B
COLLEGE OF AGRICULTURAL ENGINEERING AND
TECHNOLOGY, V.N.M.K.V. PARBHANI
Different aspects of seminar
1. Introduction
2. Materials and methods
3. Result and discussion
4. Conclusion
INTRODUCTION
• Sugarcane – Saccharum officinarum L.- Gramineae
• Natural agricultural resource-provides sugar, biofuel and co-
products
• Sugar production – 70%
• Sugarcane juice
White sugar Brown sugar Jaggery
• Chief by product- molasses and bagasse
• FAO 2011 Report
Worldwide
Area-
25.44mha
Production -
1794 mln
tons
• Area- 5.22
• Production – 123.46
• Productivity- 58.2
• Area – 3.5
• Production – 96.50 mln tons
• Productivity -50
• Area – 5.09 mha
• Production- 347.67
• Productivity- 68.6
• Area- 9.601 mha
• Production- 721 mln tons
• Productivity- 80 tons/ha
BRAZIL INDIA
CHINATHAILAND
Sugarcane producing countries-
Sugarcane area contribution in India
43%
20.10%
8.46%
7.51%
4.62%
4.01%
3.97%
2.12%
1.87% 1.57% 1.36% 1.89%
UP
MH
KARNATAKA
TN
BIHAR
AP
GJ
UK
HARYANA
PUNJAB
MP
OS
UP
MH
KA
TN
India
2nd largest
Avg 68.6 t/ha
MAHARASHTRA
83 tons/ha
UTTAR PRADESH
63 tons/ha
Karnataka
90 tons/ha
UTTARAKHAND
61 tons/ha
SUGARCANE PRODUCTIVITY IN INDIA
• It is observed that the productivity of sugarcane ,
national avg, is stagnating around 65-70 tons/ha
Because of –
-Non implementation of practices
-Shortage of labour
• It is reported that yield loss caused by weeds may
range from 15-75% depending upon nature and
intensity .(Olaoye and Adekanye, 2006)
• There is need to focus on weed management
practices
Weed control in sugarcane-
• It is perennial crop and remains 3-4 years in same
field. So, all types of seasonal, perennial and annual
grow in field.
• Weeds emerge during rainy season- echionochola
colonum and E.crusgalli(grasses)
• Methods used for weed control are-
 Manual Weeding
 Mechanical weeding
 Chemical weeding
• Manual weeding, which is common practice followed
in different regions.
• Labour requirement for weeding/ interculture
operation ranges between 400-600 man-hr/ha.
OPERATIONS CROPS
Sugarcane Wheat Rice
Planting 35-40 35-40 10-12
Weeding 65-70 25-30 22-25
Irrigation 10-12 10-12 8-10
Fertilizer 5-6 5-7 4-5
Harvesting 150-200 60-70 35-40
Plant protection 12-15 4-5 4-5
Transport 20-35 6-7 15-20
Total 332 158 106
T1. Man days requirement per hectare in different operations-
MATERIALS AND METHODS
 Details of implements used
 Experimental field
 Experimental parameters
 Performance indicators
Details of implements used
Parameter Rotary tiller self
propelled
Cultivator Rotavator
Dimensions (l*w*h),
mm
1280*620*1140 2600*700*103 2100*950*1150
Working width, mm 500 2300 2000
Weight, kg 42 210 446
No. blades in
use/shovels
16 6 12
No. rows covered in
single pass
01 03 03
Type of soil working
tool
C-type blade Reversible shovel L – type blade
Power source Petrol engine Tractor operated Tractor operated
Experimental parameters
 Experiment was laid out in completely randomized
design with five treatments.
 T1S – Single pass of rotary tiller
 T1D – Two passes of rotary tiller
 T2 - Weeding by cultivator
 T3 - Weeding by rotavator
 T4 - Manual weeding
Treatment T1 ROTARY TILLER
T1S – Single pass of rotary tiller
CULTIVATOR – 6 tines in use
T2 - Weeding by cultivator
ROTAVATOR – 3 flanges in use
T3 - Weeding by Rotavator
T4 - Manual weeding
Spades are used for weeding with 20cm wide blade
Experimental field
 Performance evaluation of three mechanical
implement was carried out at University Farm of G.B
Pant University of Agriculture and Technology.
 Sugarcane crop was planted at row spacing of 75cm.
 Soil is of alluvial origin and classified as silty-clay-loam
having 15.1, 55.2, and 29.7 % of sand, silt and clay
respectively.
 Weeding operation was performed after 80 days of
planting of sugarcane crop.
 Main field divided into 20 sub plots of each size
20x6 m.
Layout of Experimental field
T1S
T1D T1D
T1S
T1S
T1DT1D
T1S
T2T2
T2T2
T3
T3
T3 T3
T4T4
T4
T4
R1 R2
R3 R4
20m
6m
Performance indicators
1. Weeding efficiency
2. Plant damage
3. Field capacity
4. Field efficiency
5. Fuel consumption
6. Size of soil aggregates
7. Cost of operation
Performance indicators
1. Weeding efficiency
Weeding efficiency, % = W1 – W2
W1
X 100
Where,
W1 = no. weeds before tilling operation in
10m row length
W2 = no. weeds after tilling operation in 10m
row length
Performance indicators
2. Plant damage
Plant damage, % =
Q2
Q1
X 100
Where,
Q1 = no. plants in row before tilling operation
Q2 = no. plants in row after tilling operation
Performance indicators
3. Actual Field capacity
Field capacity, ha/hr = S x W x E
10
Where,
S – speed of operation (km/h)
W - width of operation (m)
E - field efficiency
Performance indicators
4. Field efficiency
Field efficiency, E, % =
T F C
Where,
EFC- effective field capacity
TFC- theoretical field capacity
E - field efficiency
E F C
X 100
Performance indicators
5. Cost of operation
• Cost analysis was performed by determining the
fixed and variable cost.
• Straight line method was used for determining
depreciation cost.
• Parameters considered while cost analysis
Costanalysis
Fixed cost
Depreciation
Interest
Housing + taxes +
insurance
Variable cost
Fuel
Lubrication
Wages
Results and discussion
Treatments Weeding
efficiency,
%
Plant
damage,
%
Actual field
capacity,
ha/hr
Field
efficiency,
%
T1S 88.01 1.11 0.063 96.93
T1D 93.20 1.83 0.085 94.10
T2 83.22 3.67 0.940 80.92
T3 87.97 2.63 0.690 87.08
T4 98.02 0.56 0.0018 -
Observations found in various treatments
Treatments Fuel
consumption,
l/hr
Fuel
consumption ,
l/ha
Clod size,
mm
T1S 0.58 9.21 7.67
T1D 0.53 6.24 4.01
T2 3.19 3.39 8.08
T3 2.87 4.16 4.98
T4 - - 8.09
Fuel consumption and changes in soil parameter-
Basic parameters for cost estimation
Implement/
power source
Initial cost,
INR
Salvage value,
INR
Useful year Annual use,
hrs
eff. Field
capacity,
ha/hr
Tractor 575000 57500 10 1000 -
Rotavator 73000 7300 8 720 0.69
Cultivator 27000 2700 10 720 0.94
Rotary tiller 46000 4600 10 720 0.074
Manual ND ND ND ND 0.0018
Imple
ment
/pow
er src.
Depre
ciatio
n
INR/h
Intere
st,
INR/h
Ins.+
tax
+hous
ing
Total
fixed
cost,
INR/h
Fuel
cost,
INR/h
Lubric
ation,
INR/h
Repai
r cost,
INR/h
Wa
ges,
INR
/h
Toatal
varia
ble
cost ,
INR/h
Total
cost
of
opera
tion
INR/ha
Tracto
r
51.75 31.63 17.25 - - - - - - - -
Rotar
y
tiller
5.75 3.51 - 9.26 39.20 11.76 3.83 23.
75
78.54 87.8 1186.18
Cultiv
ator
3.38 2.06 - 106.0
6
143.5 43.07 36.75 23.
75
247.1
2
353.1
8
374.37
Rotav
ator
11.41 5.58 - 117.6
1
129.1
5
38.75 40.58 23.
75
232.2
3
349.8
4
507.27
Manu
al
- - - - - - - 23.
75
- - 13194.5
5
CONCLUSION
Among the mechanical methods, treatment T1D and T1S was
found more effective compared to treatments T2 and T3 based
on higher weeding efficiency and plant damage.
Treatment T1S and T3 was found equally effective as far as
weeding efficiency concern.
Conventional method was found expensive than mechanical.
Use of rotary tiller, among the mechanical methods can be
recommended to farmers for efficient weed management even
though cost of operation is high.
Advantage is that as it covers single row of the crop it can be
used even at later stage when plant grows tall enough.
 A.T BHOSALE and T.P SINGH, 2014. Comparative
performance evaluation of implements for weed control in
sugarcane.
 Hasanuzzaman M, Ali MH, Alam MM, Akhtar M,
Fakhrul, Alam K (2009). Evaluation of pre-emergence
herbicide and hand weeding on the weed control efficiency
and performance of transplanted rice. American-Eurasian J.
Agron 2(3)138-143.
 Hunt D (1995). Farm power and machinery management (9th
Edn.). lowa state university press. USA.
 Olaoye and Adekanye (2006). Development and evaluation
of power weeder. Proc.nig.soc. agric.eng. 3:189-199.
 Singh RP, Panghal SS (2012). Mechanization of sugarcane
agriculture solution for low sugar availability in website
www.scribd.com
REFERENCES
Comparative performance evaluation of different mechanical implement for weed control in sugarcane crop

Comparative performance evaluation of different mechanical implement for weed control in sugarcane crop

  • 2.
    seminar on COMPARATIVE PERFORMANCEEVALUATION OF DIFFERENT MECHANICAL IMPLEMENT FOR WEED CONTROL IN SUGARCANE PRESENTED BY BELE G M 2012AE/03B COLLEGE OF AGRICULTURAL ENGINEERING AND TECHNOLOGY, V.N.M.K.V. PARBHANI
  • 3.
    Different aspects ofseminar 1. Introduction 2. Materials and methods 3. Result and discussion 4. Conclusion
  • 4.
    INTRODUCTION • Sugarcane –Saccharum officinarum L.- Gramineae • Natural agricultural resource-provides sugar, biofuel and co- products • Sugar production – 70% • Sugarcane juice White sugar Brown sugar Jaggery • Chief by product- molasses and bagasse
  • 5.
    • FAO 2011Report Worldwide Area- 25.44mha Production - 1794 mln tons
  • 6.
    • Area- 5.22 •Production – 123.46 • Productivity- 58.2 • Area – 3.5 • Production – 96.50 mln tons • Productivity -50 • Area – 5.09 mha • Production- 347.67 • Productivity- 68.6 • Area- 9.601 mha • Production- 721 mln tons • Productivity- 80 tons/ha BRAZIL INDIA CHINATHAILAND Sugarcane producing countries-
  • 7.
    Sugarcane area contributionin India 43% 20.10% 8.46% 7.51% 4.62% 4.01% 3.97% 2.12% 1.87% 1.57% 1.36% 1.89% UP MH KARNATAKA TN BIHAR AP GJ UK HARYANA PUNJAB MP OS UP MH KA TN
  • 8.
    India 2nd largest Avg 68.6t/ha MAHARASHTRA 83 tons/ha UTTAR PRADESH 63 tons/ha Karnataka 90 tons/ha UTTARAKHAND 61 tons/ha SUGARCANE PRODUCTIVITY IN INDIA
  • 9.
    • It isobserved that the productivity of sugarcane , national avg, is stagnating around 65-70 tons/ha Because of – -Non implementation of practices -Shortage of labour • It is reported that yield loss caused by weeds may range from 15-75% depending upon nature and intensity .(Olaoye and Adekanye, 2006) • There is need to focus on weed management practices
  • 10.
    Weed control insugarcane- • It is perennial crop and remains 3-4 years in same field. So, all types of seasonal, perennial and annual grow in field. • Weeds emerge during rainy season- echionochola colonum and E.crusgalli(grasses) • Methods used for weed control are-  Manual Weeding  Mechanical weeding  Chemical weeding
  • 11.
    • Manual weeding,which is common practice followed in different regions. • Labour requirement for weeding/ interculture operation ranges between 400-600 man-hr/ha. OPERATIONS CROPS Sugarcane Wheat Rice Planting 35-40 35-40 10-12 Weeding 65-70 25-30 22-25 Irrigation 10-12 10-12 8-10 Fertilizer 5-6 5-7 4-5 Harvesting 150-200 60-70 35-40 Plant protection 12-15 4-5 4-5 Transport 20-35 6-7 15-20 Total 332 158 106 T1. Man days requirement per hectare in different operations-
  • 12.
    MATERIALS AND METHODS Details of implements used  Experimental field  Experimental parameters  Performance indicators
  • 13.
    Details of implementsused Parameter Rotary tiller self propelled Cultivator Rotavator Dimensions (l*w*h), mm 1280*620*1140 2600*700*103 2100*950*1150 Working width, mm 500 2300 2000 Weight, kg 42 210 446 No. blades in use/shovels 16 6 12 No. rows covered in single pass 01 03 03 Type of soil working tool C-type blade Reversible shovel L – type blade Power source Petrol engine Tractor operated Tractor operated
  • 14.
    Experimental parameters  Experimentwas laid out in completely randomized design with five treatments.  T1S – Single pass of rotary tiller  T1D – Two passes of rotary tiller  T2 - Weeding by cultivator  T3 - Weeding by rotavator  T4 - Manual weeding
  • 15.
    Treatment T1 ROTARYTILLER T1S – Single pass of rotary tiller
  • 16.
    CULTIVATOR – 6tines in use T2 - Weeding by cultivator
  • 17.
    ROTAVATOR – 3flanges in use T3 - Weeding by Rotavator
  • 18.
    T4 - Manualweeding Spades are used for weeding with 20cm wide blade
  • 19.
    Experimental field  Performanceevaluation of three mechanical implement was carried out at University Farm of G.B Pant University of Agriculture and Technology.  Sugarcane crop was planted at row spacing of 75cm.  Soil is of alluvial origin and classified as silty-clay-loam having 15.1, 55.2, and 29.7 % of sand, silt and clay respectively.  Weeding operation was performed after 80 days of planting of sugarcane crop.  Main field divided into 20 sub plots of each size 20x6 m.
  • 20.
    Layout of Experimentalfield T1S T1D T1D T1S T1S T1DT1D T1S T2T2 T2T2 T3 T3 T3 T3 T4T4 T4 T4 R1 R2 R3 R4 20m 6m
  • 21.
    Performance indicators 1. Weedingefficiency 2. Plant damage 3. Field capacity 4. Field efficiency 5. Fuel consumption 6. Size of soil aggregates 7. Cost of operation
  • 22.
    Performance indicators 1. Weedingefficiency Weeding efficiency, % = W1 – W2 W1 X 100 Where, W1 = no. weeds before tilling operation in 10m row length W2 = no. weeds after tilling operation in 10m row length
  • 23.
    Performance indicators 2. Plantdamage Plant damage, % = Q2 Q1 X 100 Where, Q1 = no. plants in row before tilling operation Q2 = no. plants in row after tilling operation
  • 24.
    Performance indicators 3. ActualField capacity Field capacity, ha/hr = S x W x E 10 Where, S – speed of operation (km/h) W - width of operation (m) E - field efficiency
  • 25.
    Performance indicators 4. Fieldefficiency Field efficiency, E, % = T F C Where, EFC- effective field capacity TFC- theoretical field capacity E - field efficiency E F C X 100
  • 26.
    Performance indicators 5. Costof operation • Cost analysis was performed by determining the fixed and variable cost. • Straight line method was used for determining depreciation cost. • Parameters considered while cost analysis
  • 27.
    Costanalysis Fixed cost Depreciation Interest Housing +taxes + insurance Variable cost Fuel Lubrication Wages
  • 28.
    Results and discussion TreatmentsWeeding efficiency, % Plant damage, % Actual field capacity, ha/hr Field efficiency, % T1S 88.01 1.11 0.063 96.93 T1D 93.20 1.83 0.085 94.10 T2 83.22 3.67 0.940 80.92 T3 87.97 2.63 0.690 87.08 T4 98.02 0.56 0.0018 - Observations found in various treatments
  • 29.
    Treatments Fuel consumption, l/hr Fuel consumption , l/ha Clodsize, mm T1S 0.58 9.21 7.67 T1D 0.53 6.24 4.01 T2 3.19 3.39 8.08 T3 2.87 4.16 4.98 T4 - - 8.09 Fuel consumption and changes in soil parameter-
  • 30.
    Basic parameters forcost estimation Implement/ power source Initial cost, INR Salvage value, INR Useful year Annual use, hrs eff. Field capacity, ha/hr Tractor 575000 57500 10 1000 - Rotavator 73000 7300 8 720 0.69 Cultivator 27000 2700 10 720 0.94 Rotary tiller 46000 4600 10 720 0.074 Manual ND ND ND ND 0.0018
  • 31.
    Imple ment /pow er src. Depre ciatio n INR/h Intere st, INR/h Ins.+ tax +hous ing Total fixed cost, INR/h Fuel cost, INR/h Lubric ation, INR/h Repai r cost, INR/h Wa ges, INR /h Toatal varia ble cost, INR/h Total cost of opera tion INR/ha Tracto r 51.75 31.63 17.25 - - - - - - - - Rotar y tiller 5.75 3.51 - 9.26 39.20 11.76 3.83 23. 75 78.54 87.8 1186.18 Cultiv ator 3.38 2.06 - 106.0 6 143.5 43.07 36.75 23. 75 247.1 2 353.1 8 374.37 Rotav ator 11.41 5.58 - 117.6 1 129.1 5 38.75 40.58 23. 75 232.2 3 349.8 4 507.27 Manu al - - - - - - - 23. 75 - - 13194.5 5
  • 32.
    CONCLUSION Among the mechanicalmethods, treatment T1D and T1S was found more effective compared to treatments T2 and T3 based on higher weeding efficiency and plant damage. Treatment T1S and T3 was found equally effective as far as weeding efficiency concern. Conventional method was found expensive than mechanical. Use of rotary tiller, among the mechanical methods can be recommended to farmers for efficient weed management even though cost of operation is high. Advantage is that as it covers single row of the crop it can be used even at later stage when plant grows tall enough.
  • 33.
     A.T BHOSALEand T.P SINGH, 2014. Comparative performance evaluation of implements for weed control in sugarcane.  Hasanuzzaman M, Ali MH, Alam MM, Akhtar M, Fakhrul, Alam K (2009). Evaluation of pre-emergence herbicide and hand weeding on the weed control efficiency and performance of transplanted rice. American-Eurasian J. Agron 2(3)138-143.  Hunt D (1995). Farm power and machinery management (9th Edn.). lowa state university press. USA.  Olaoye and Adekanye (2006). Development and evaluation of power weeder. Proc.nig.soc. agric.eng. 3:189-199.  Singh RP, Panghal SS (2012). Mechanization of sugarcane agriculture solution for low sugar availability in website www.scribd.com REFERENCES