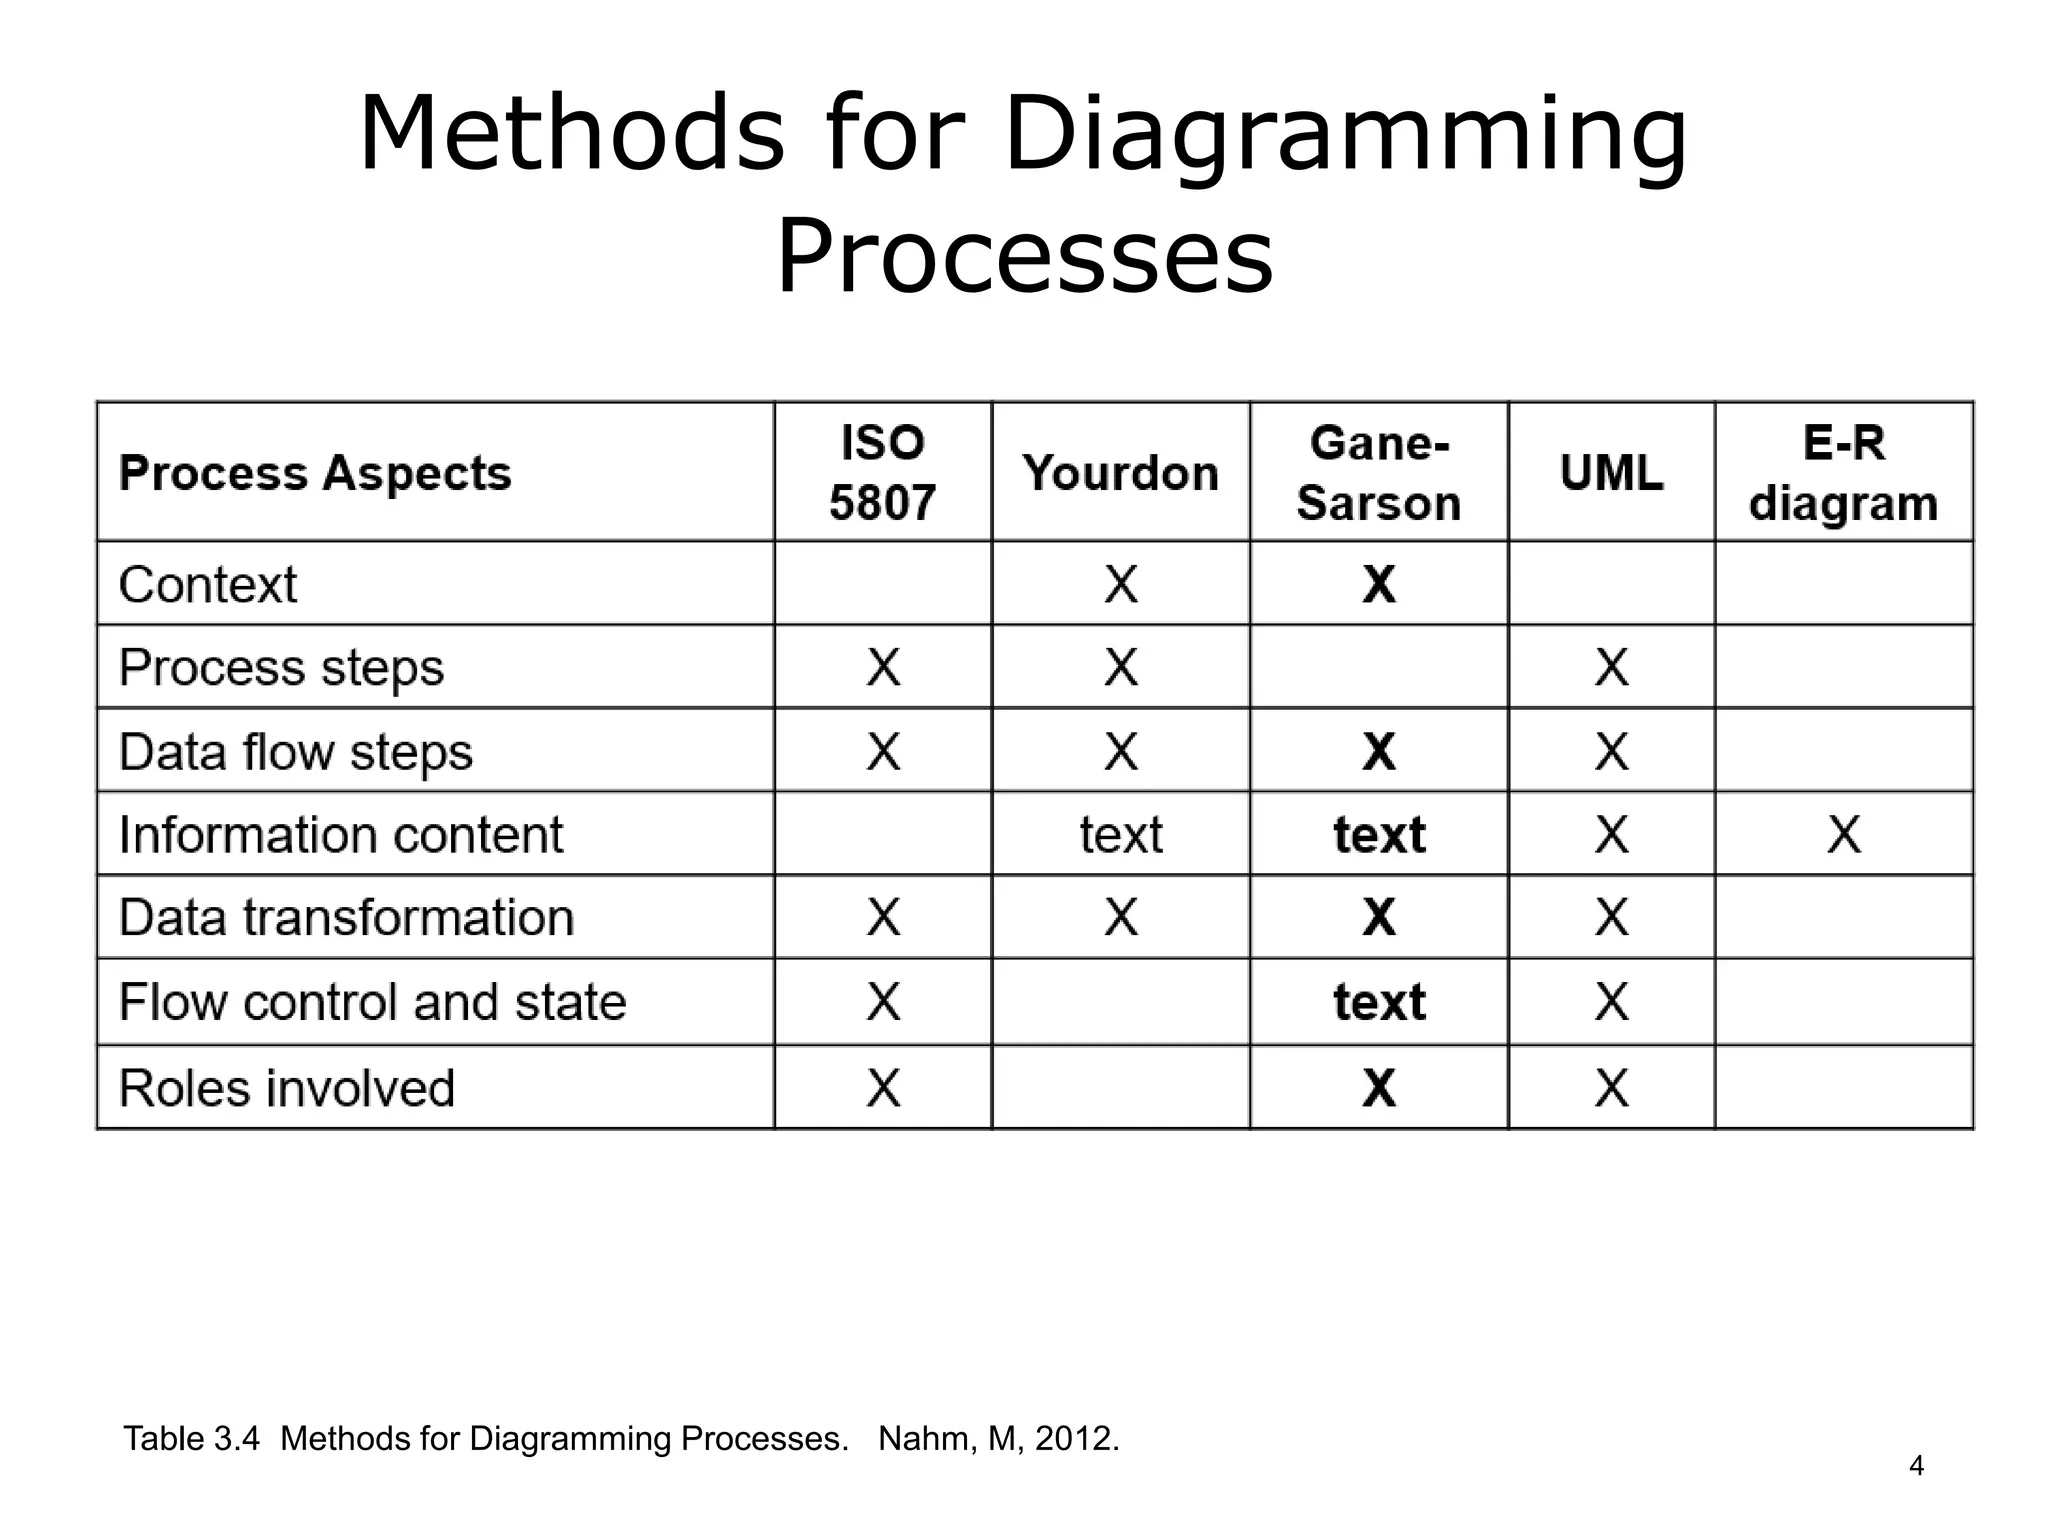
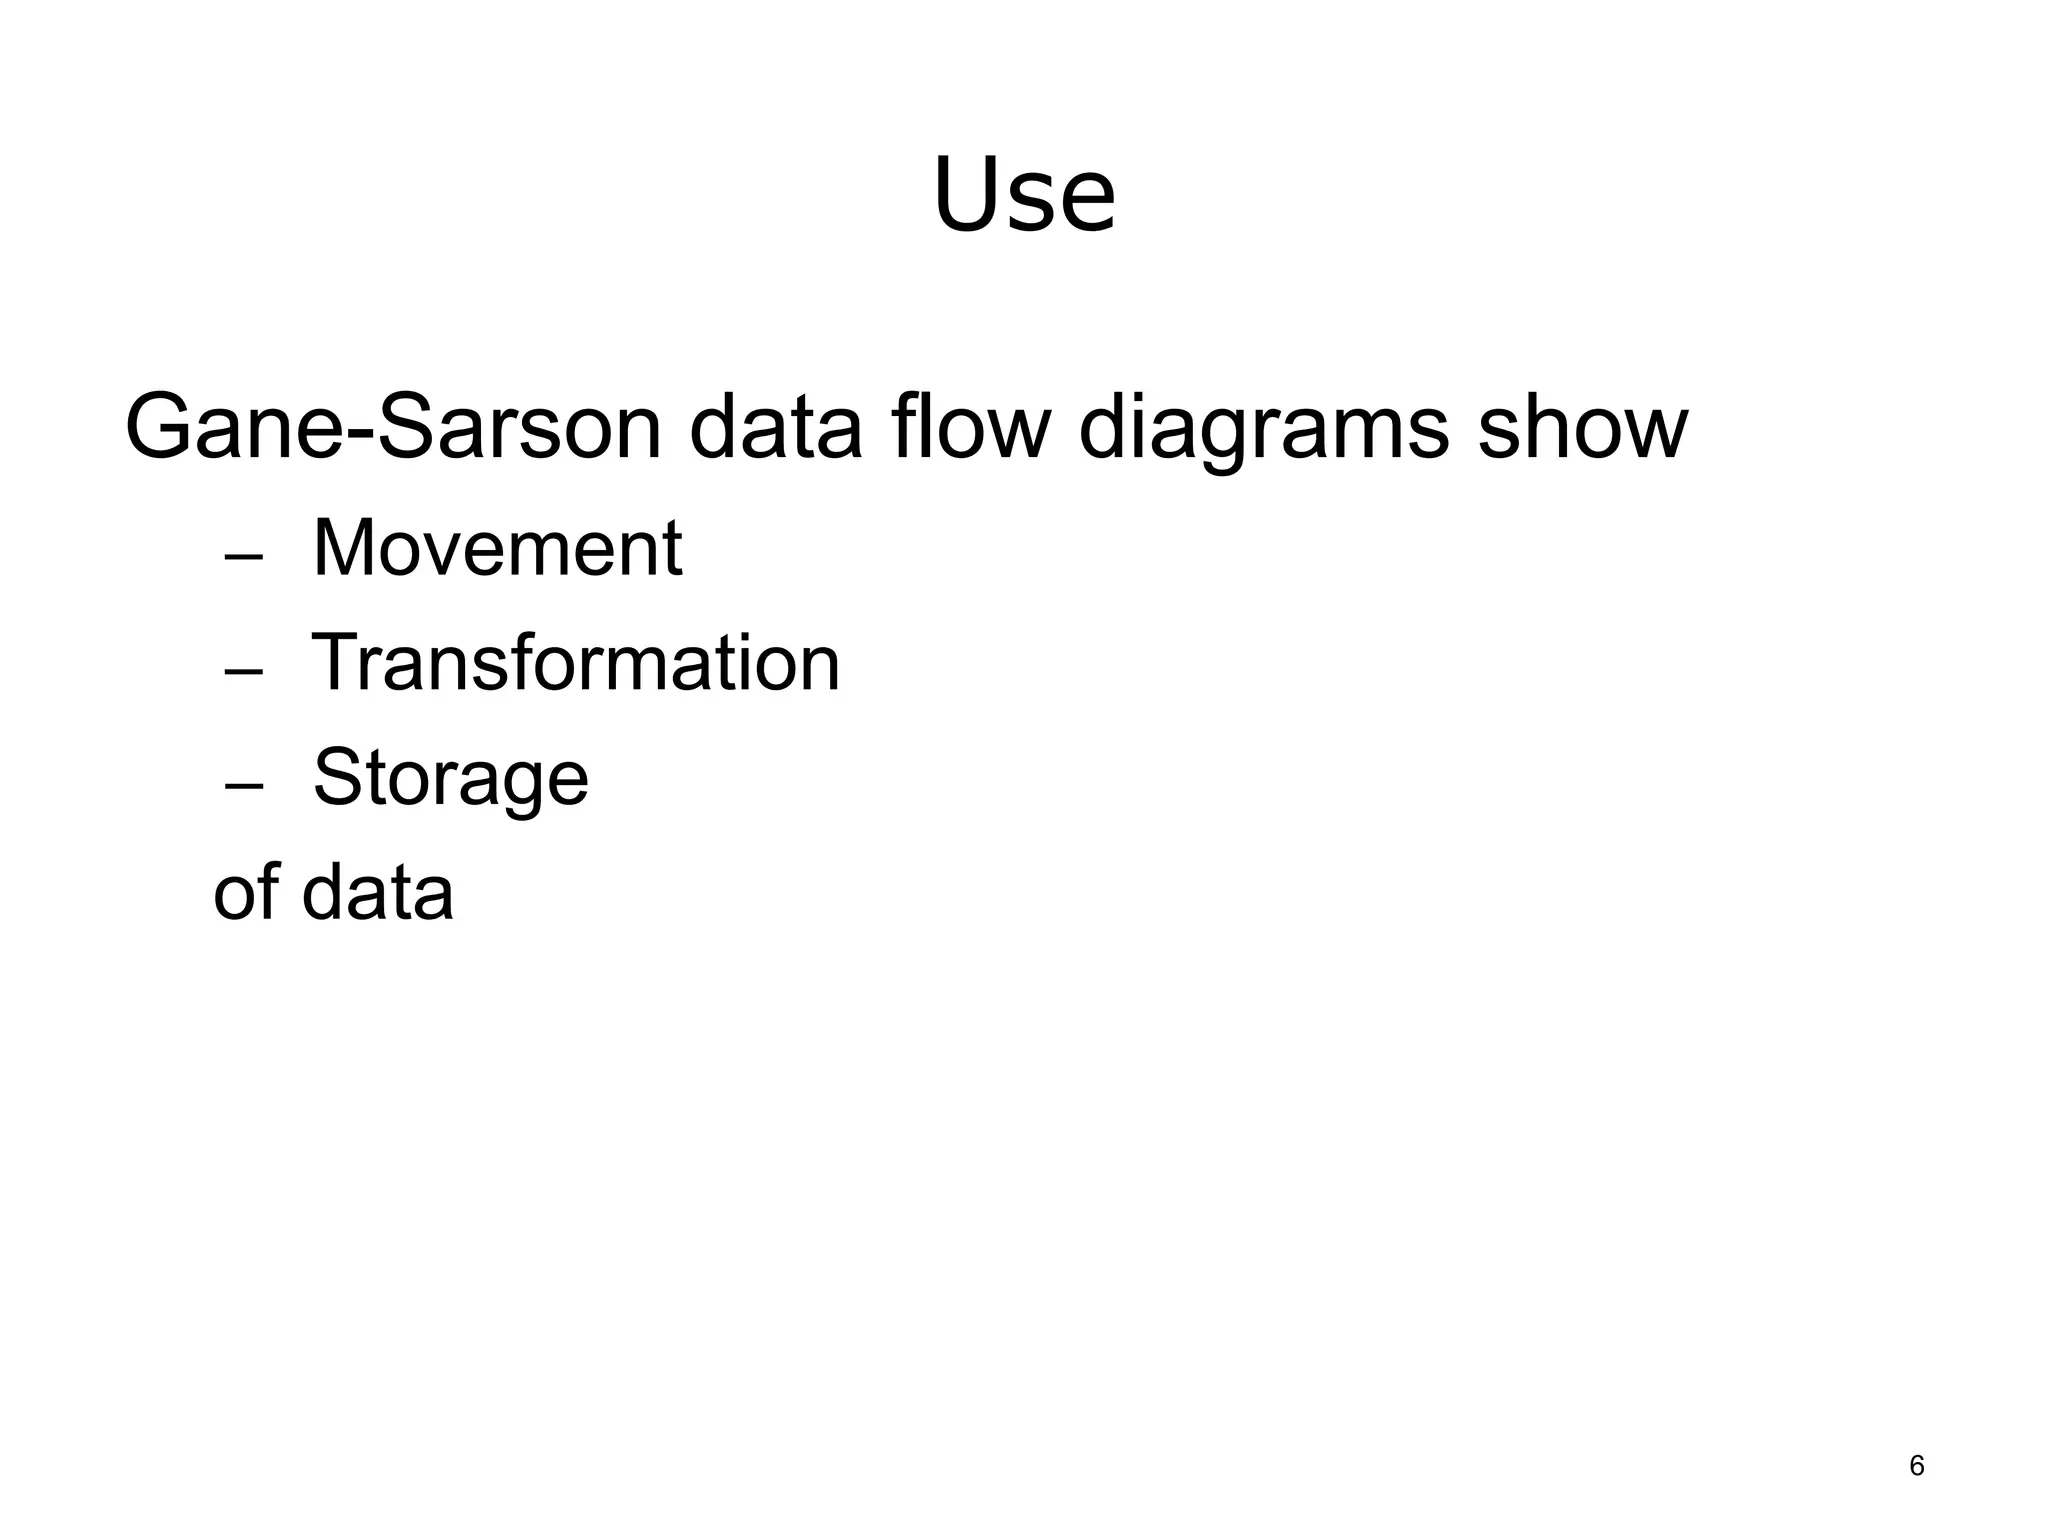
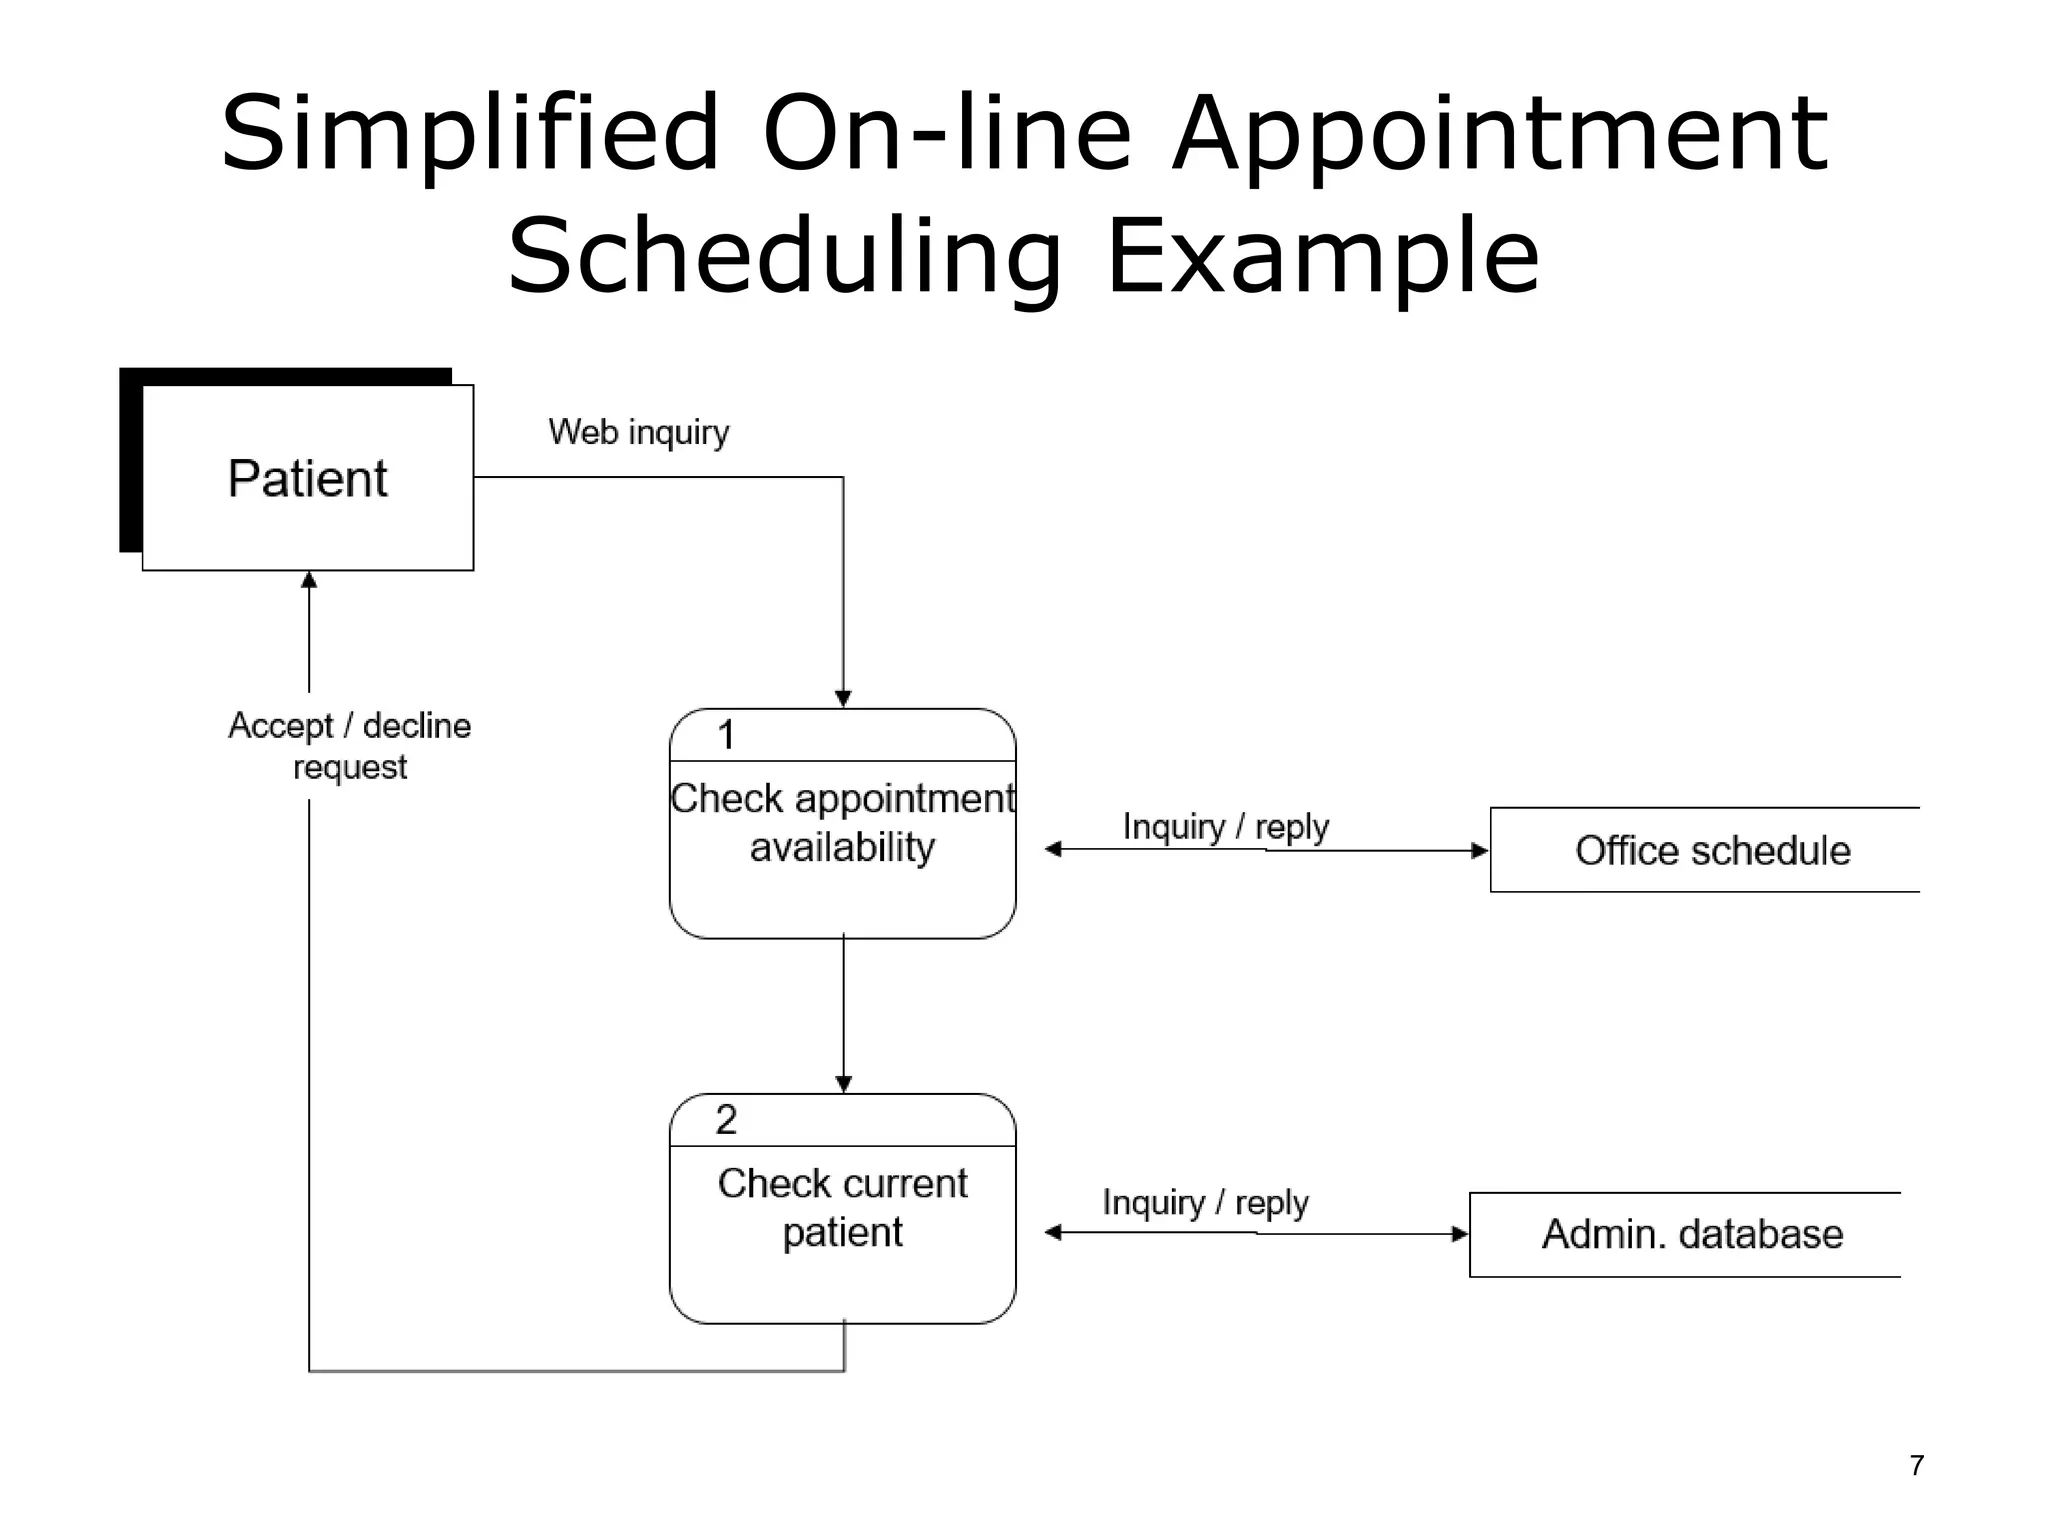
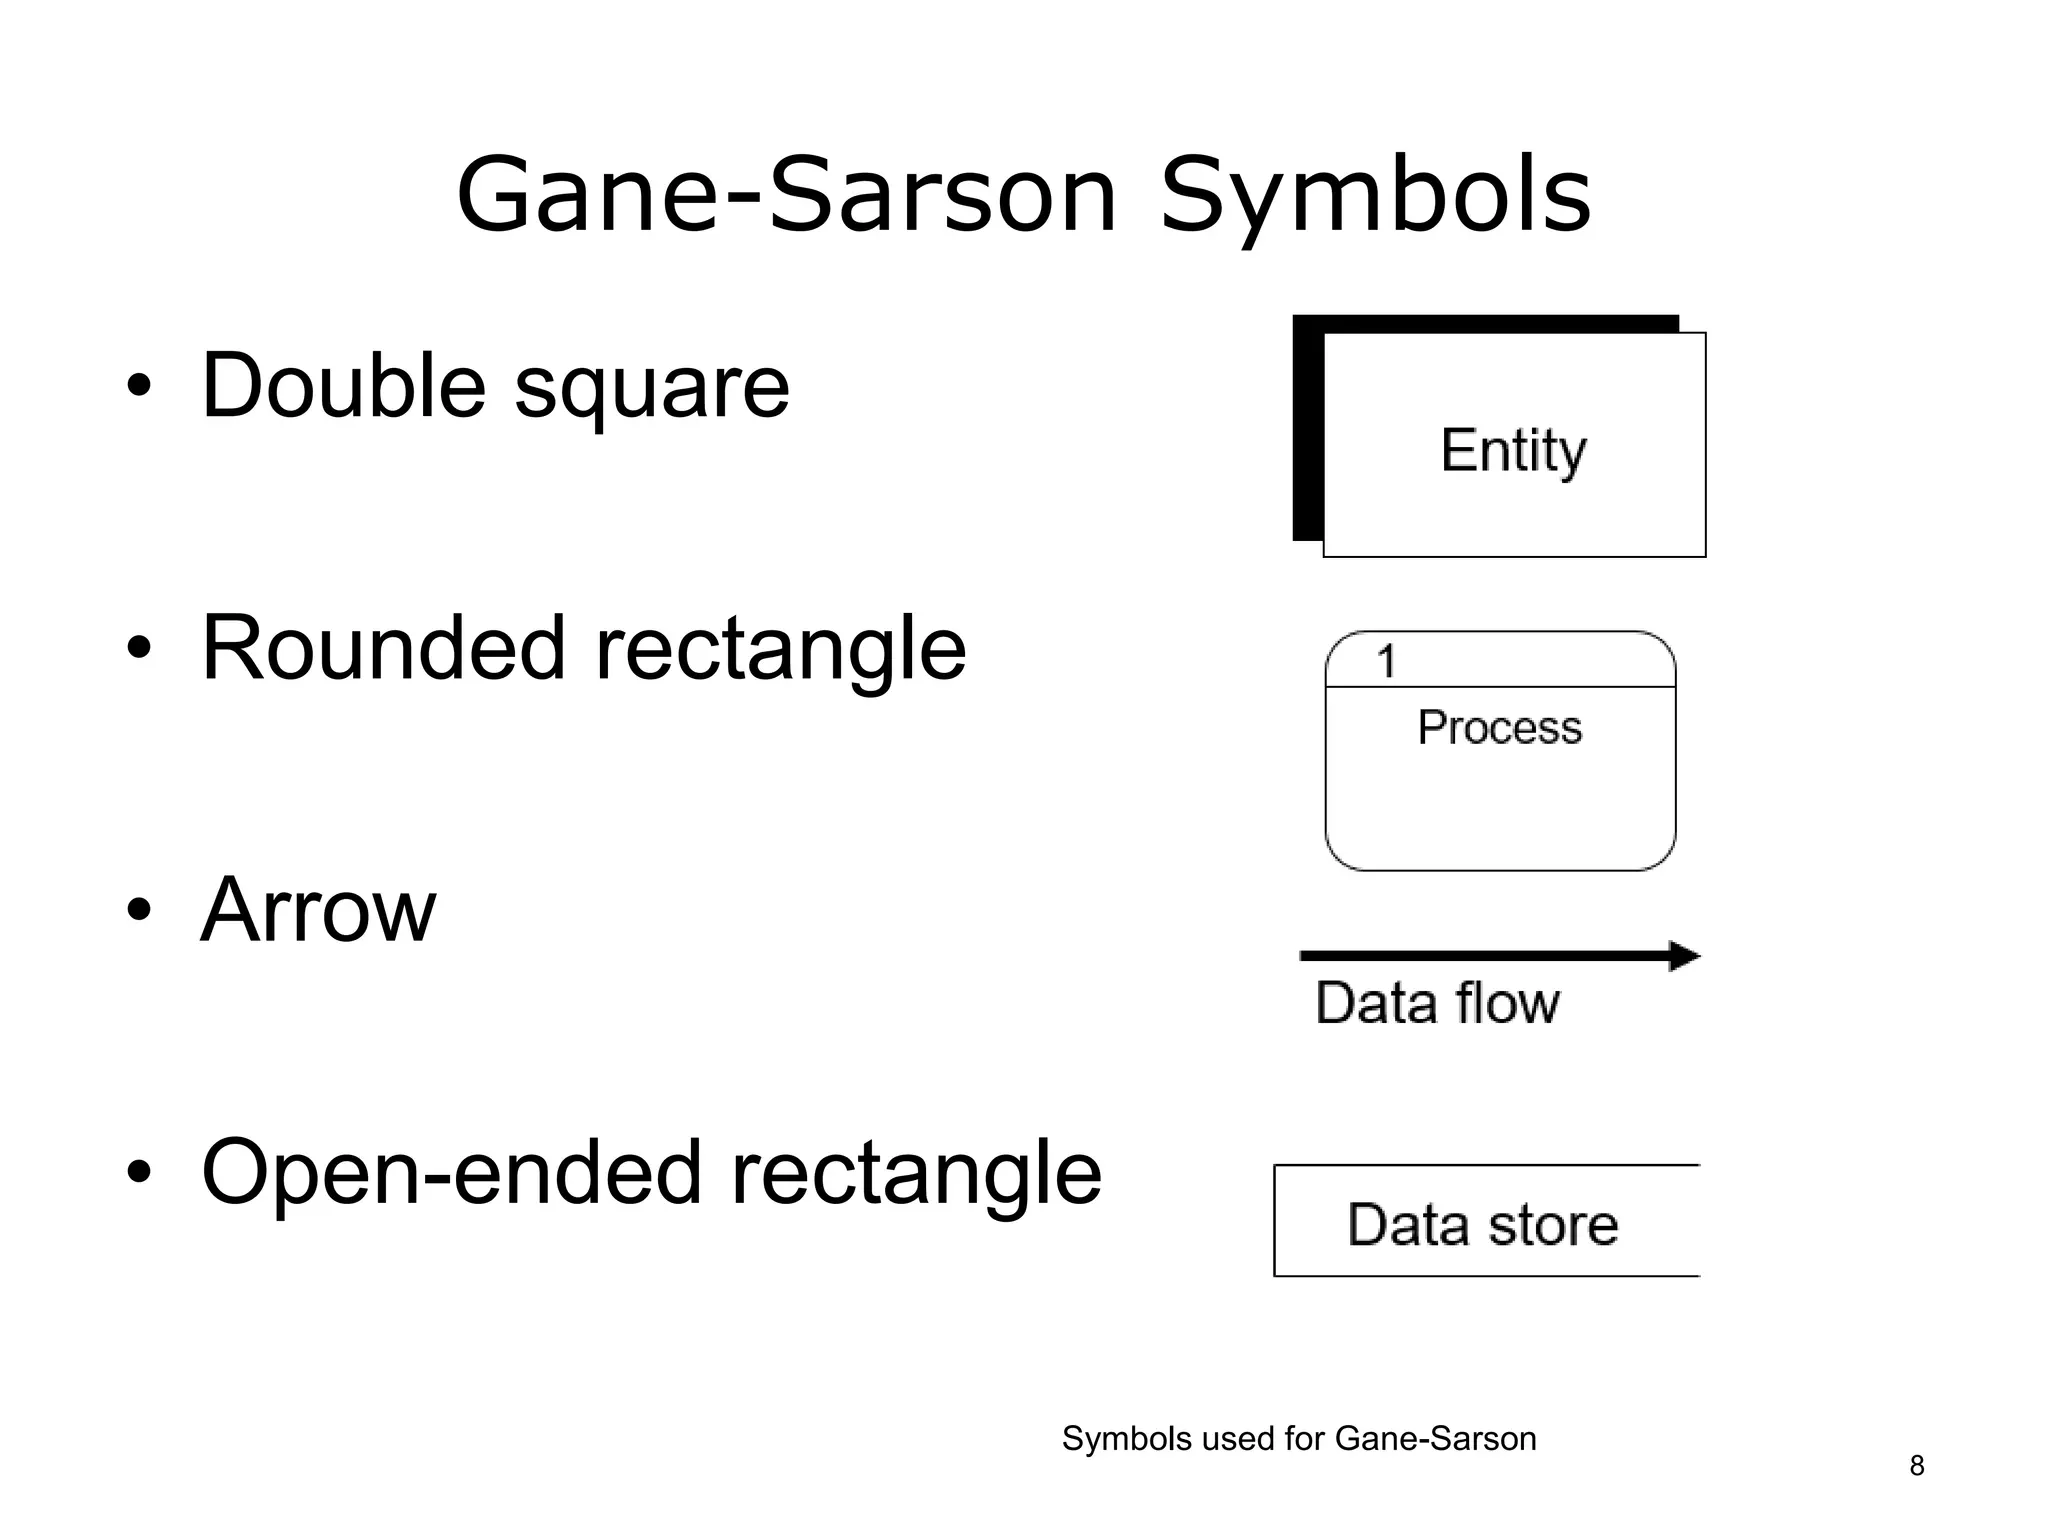
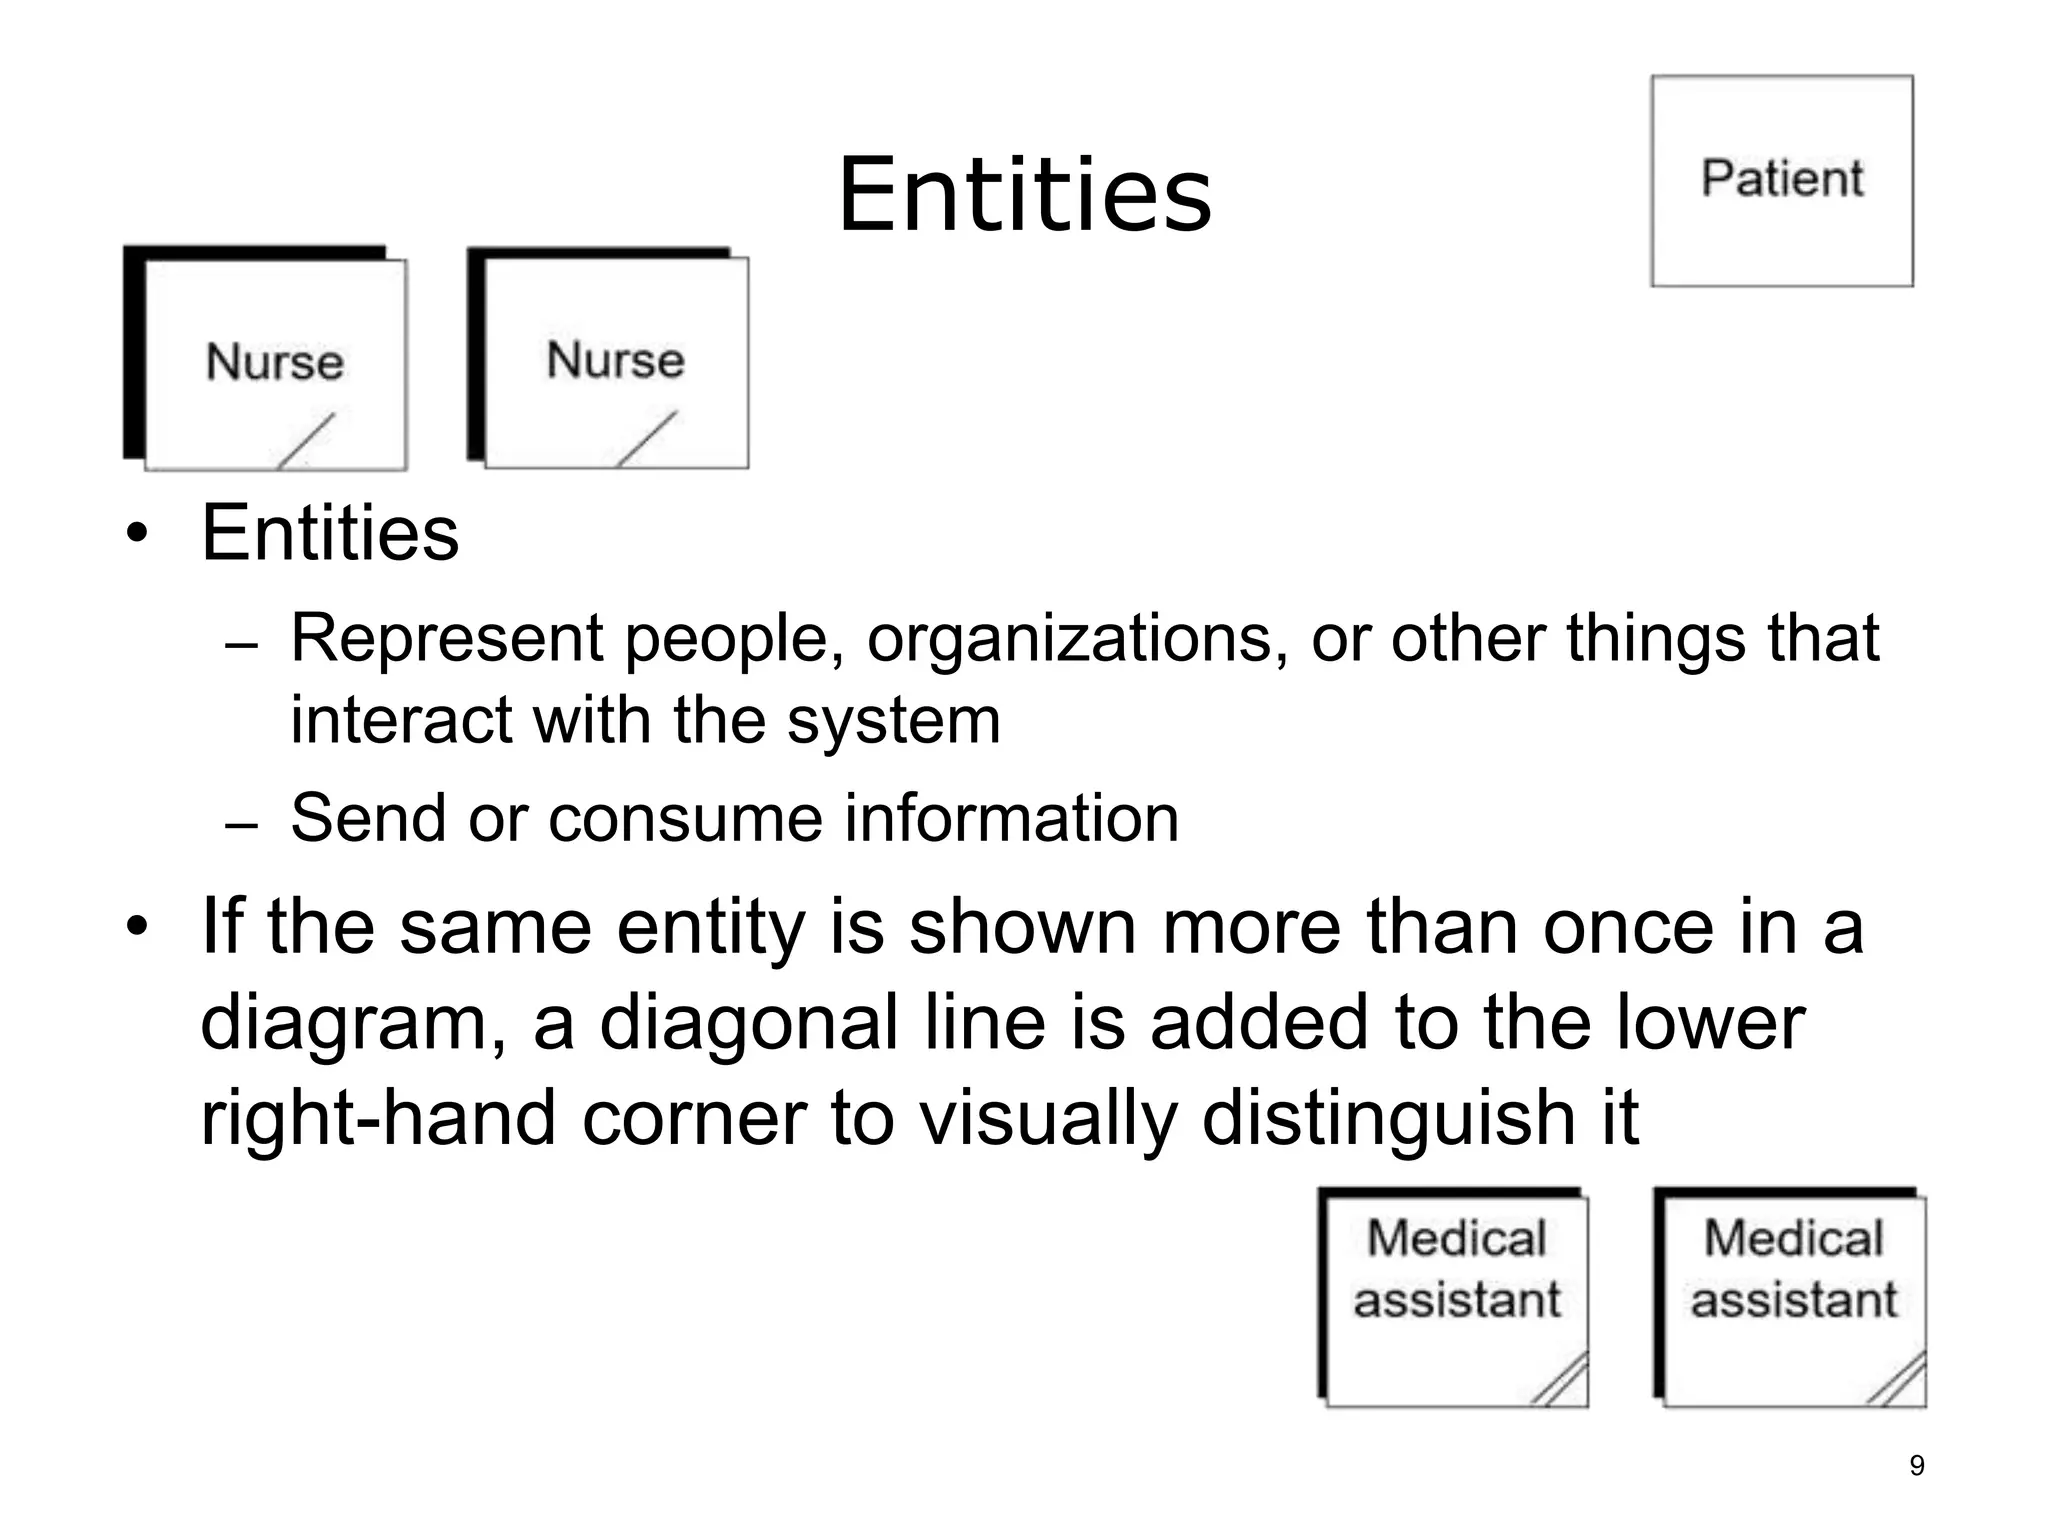
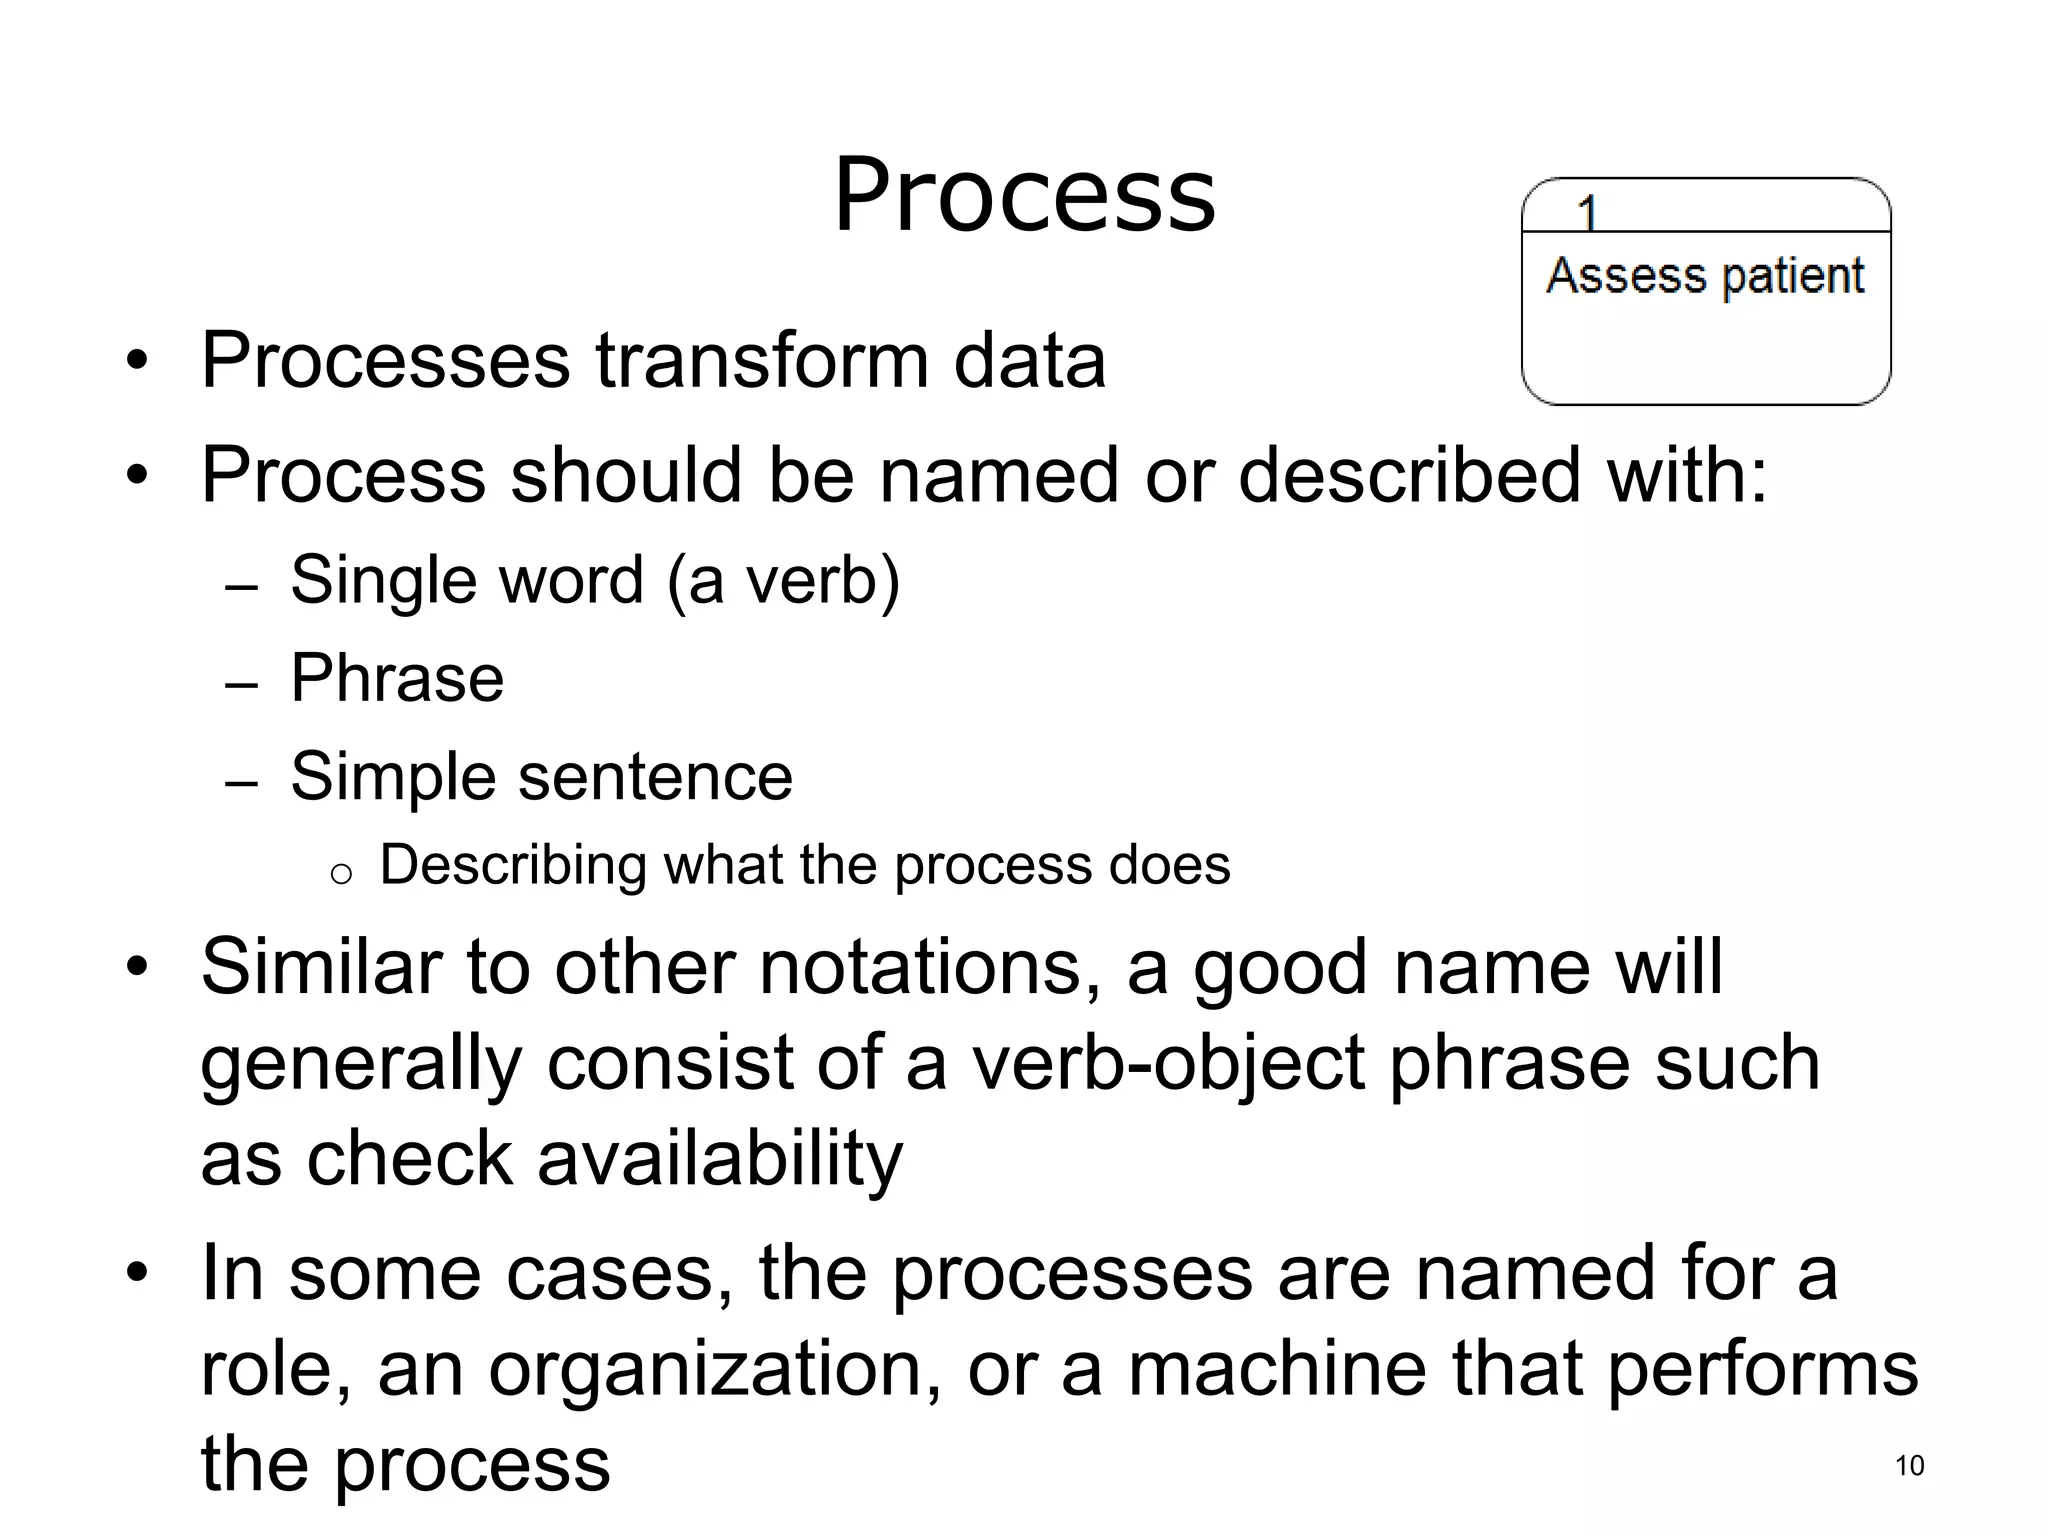
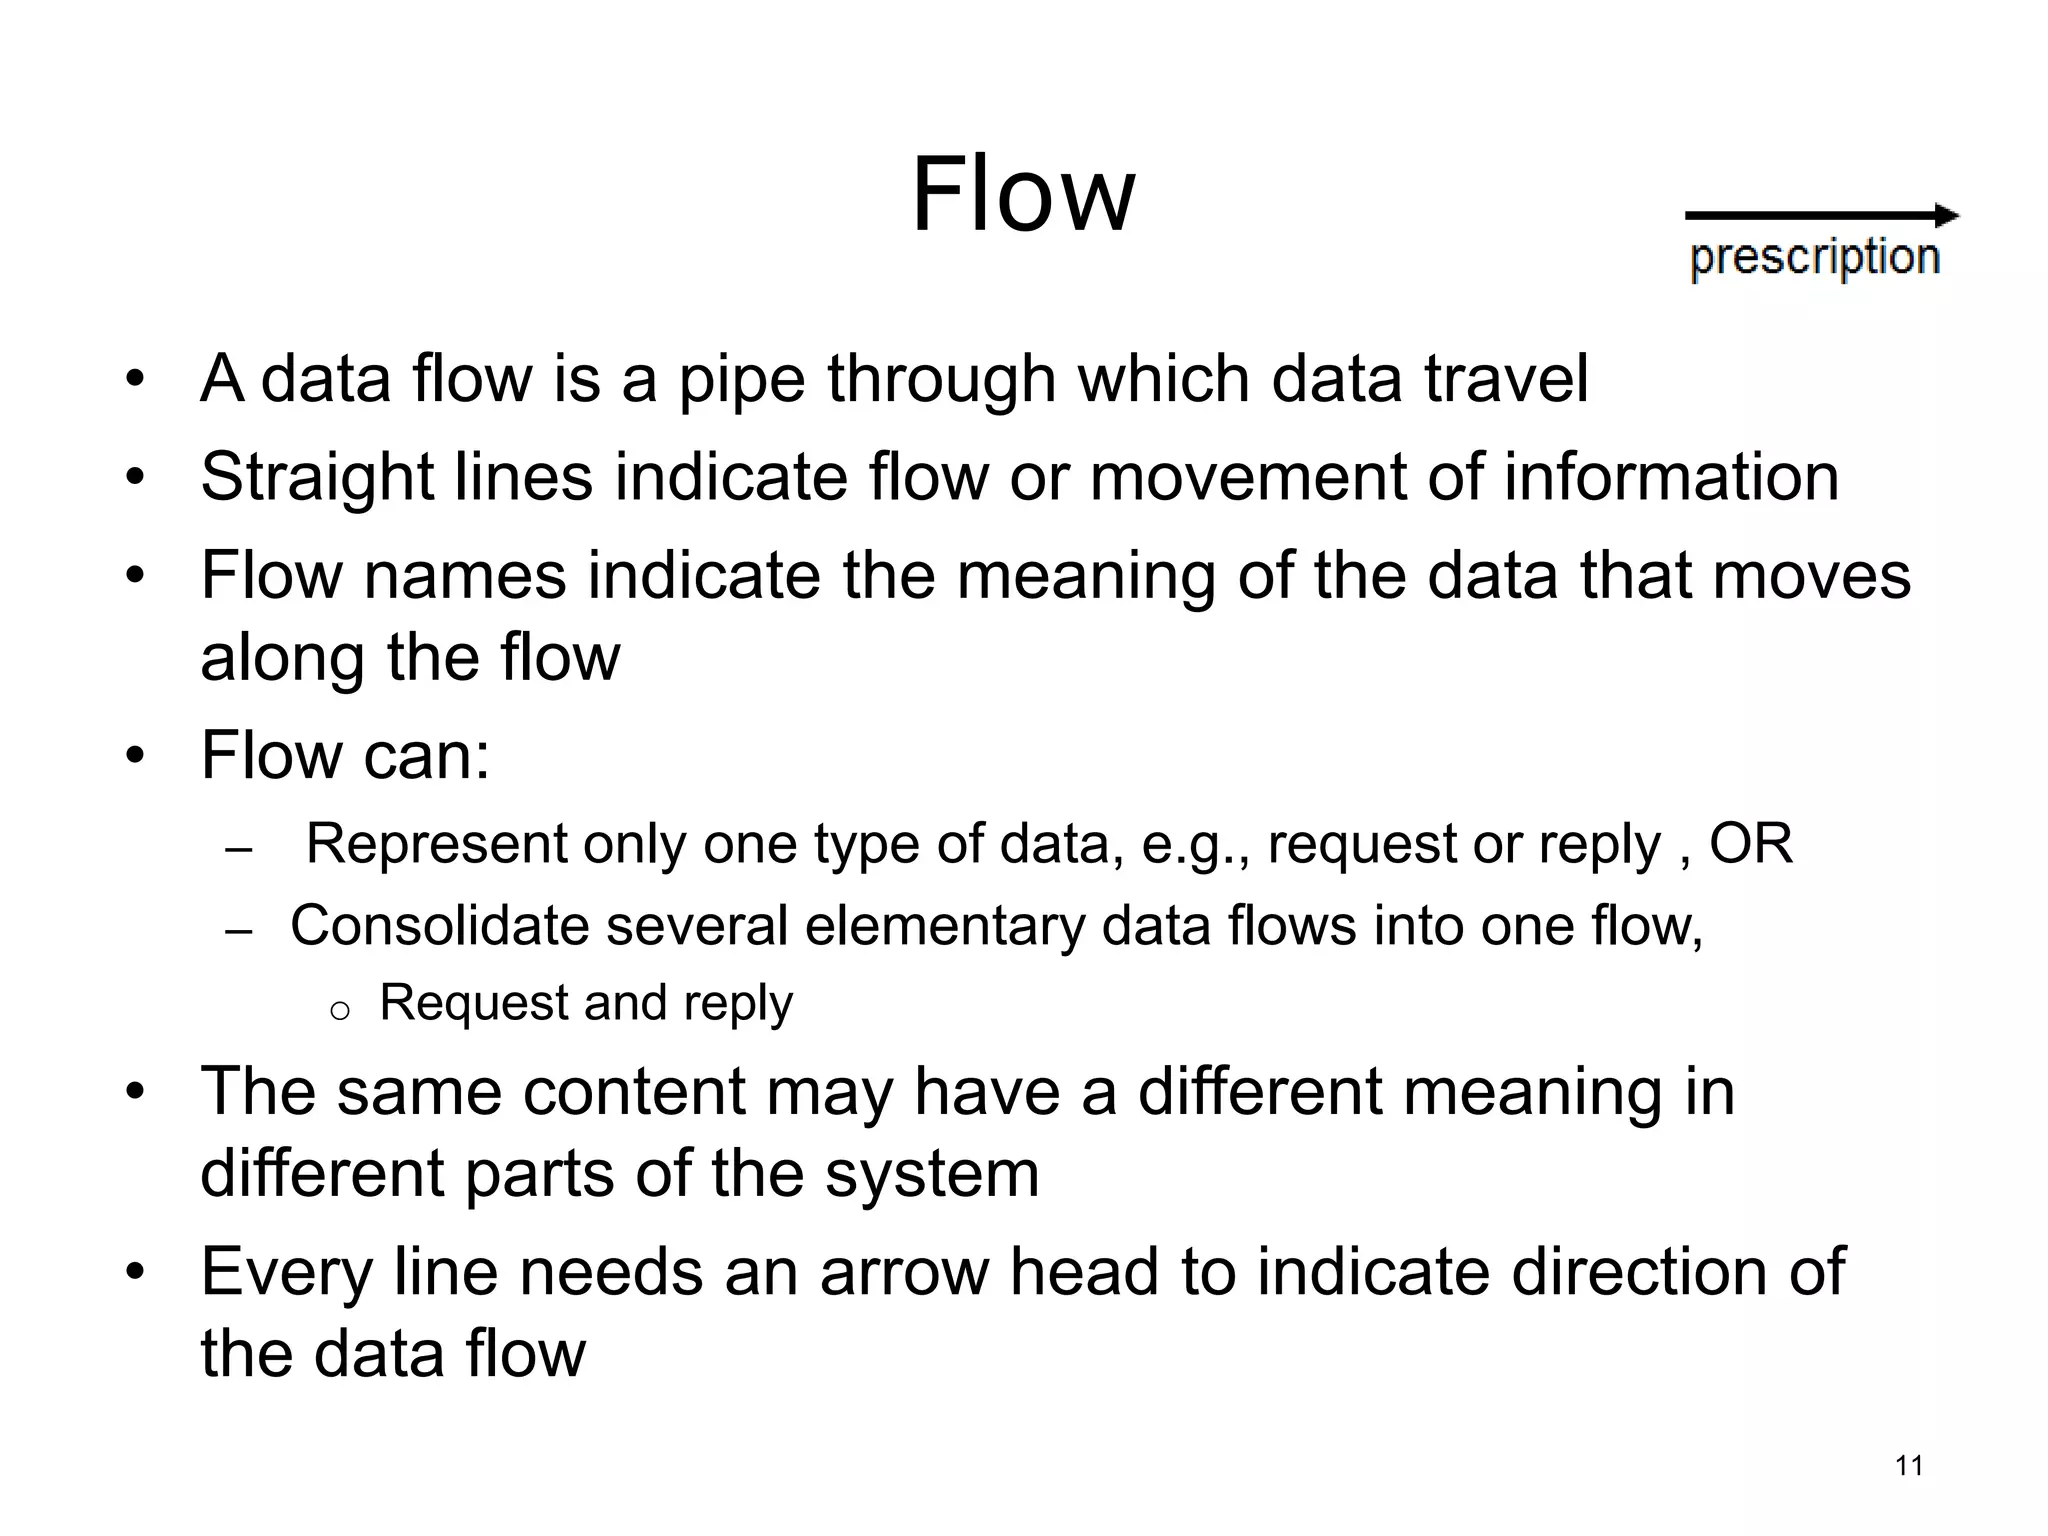
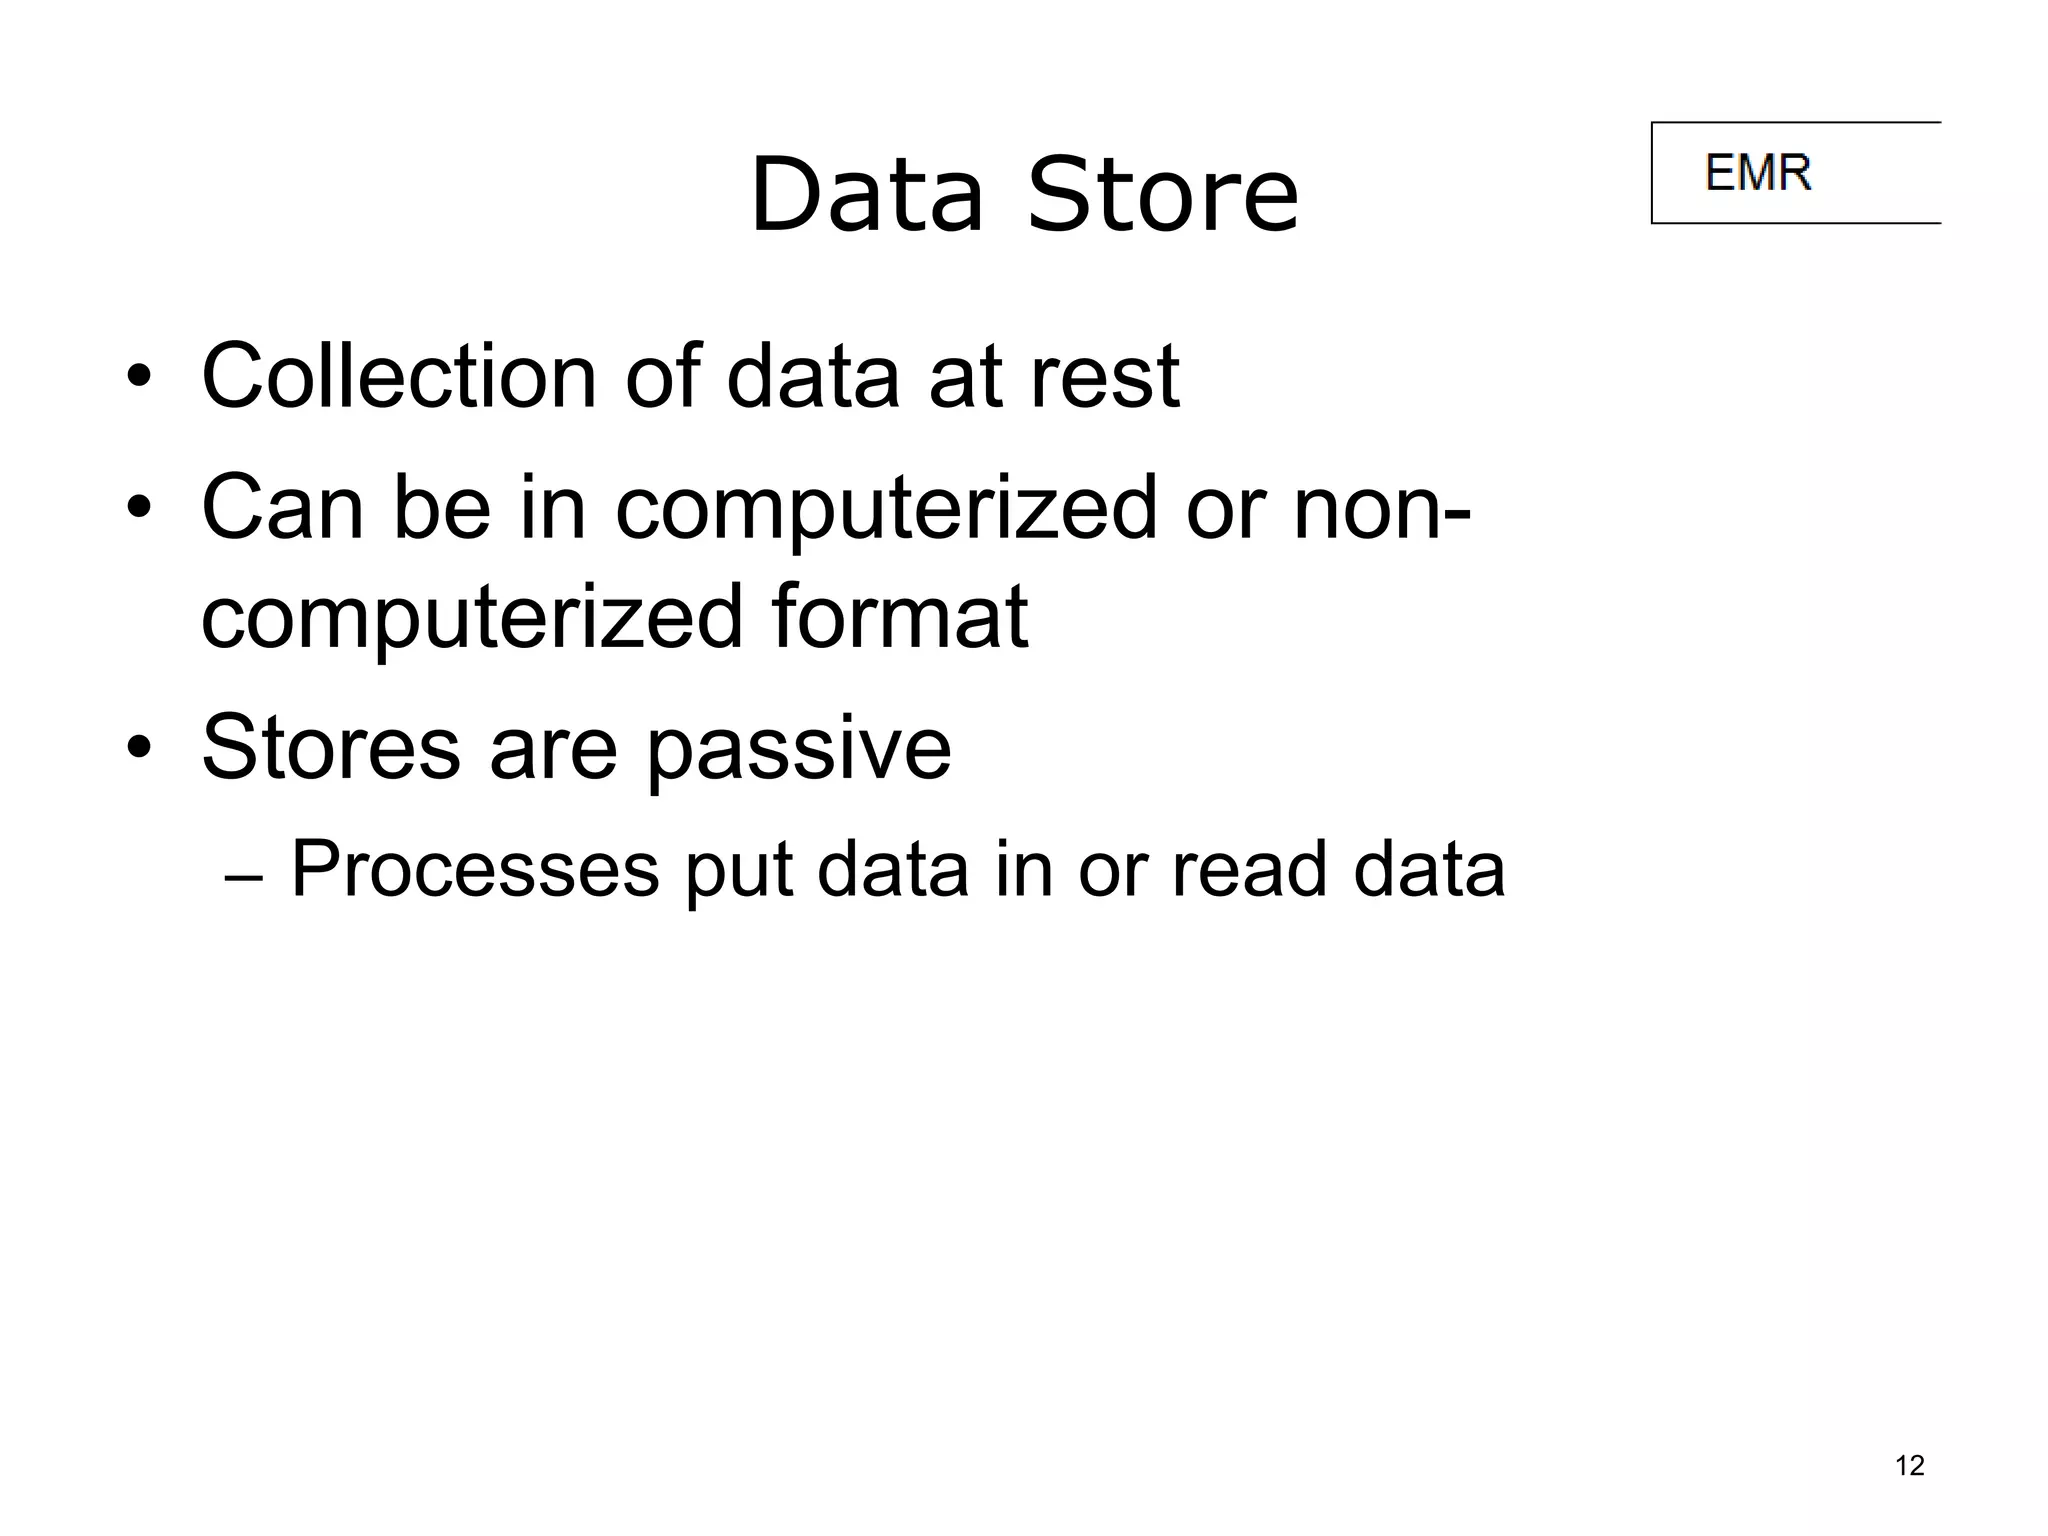
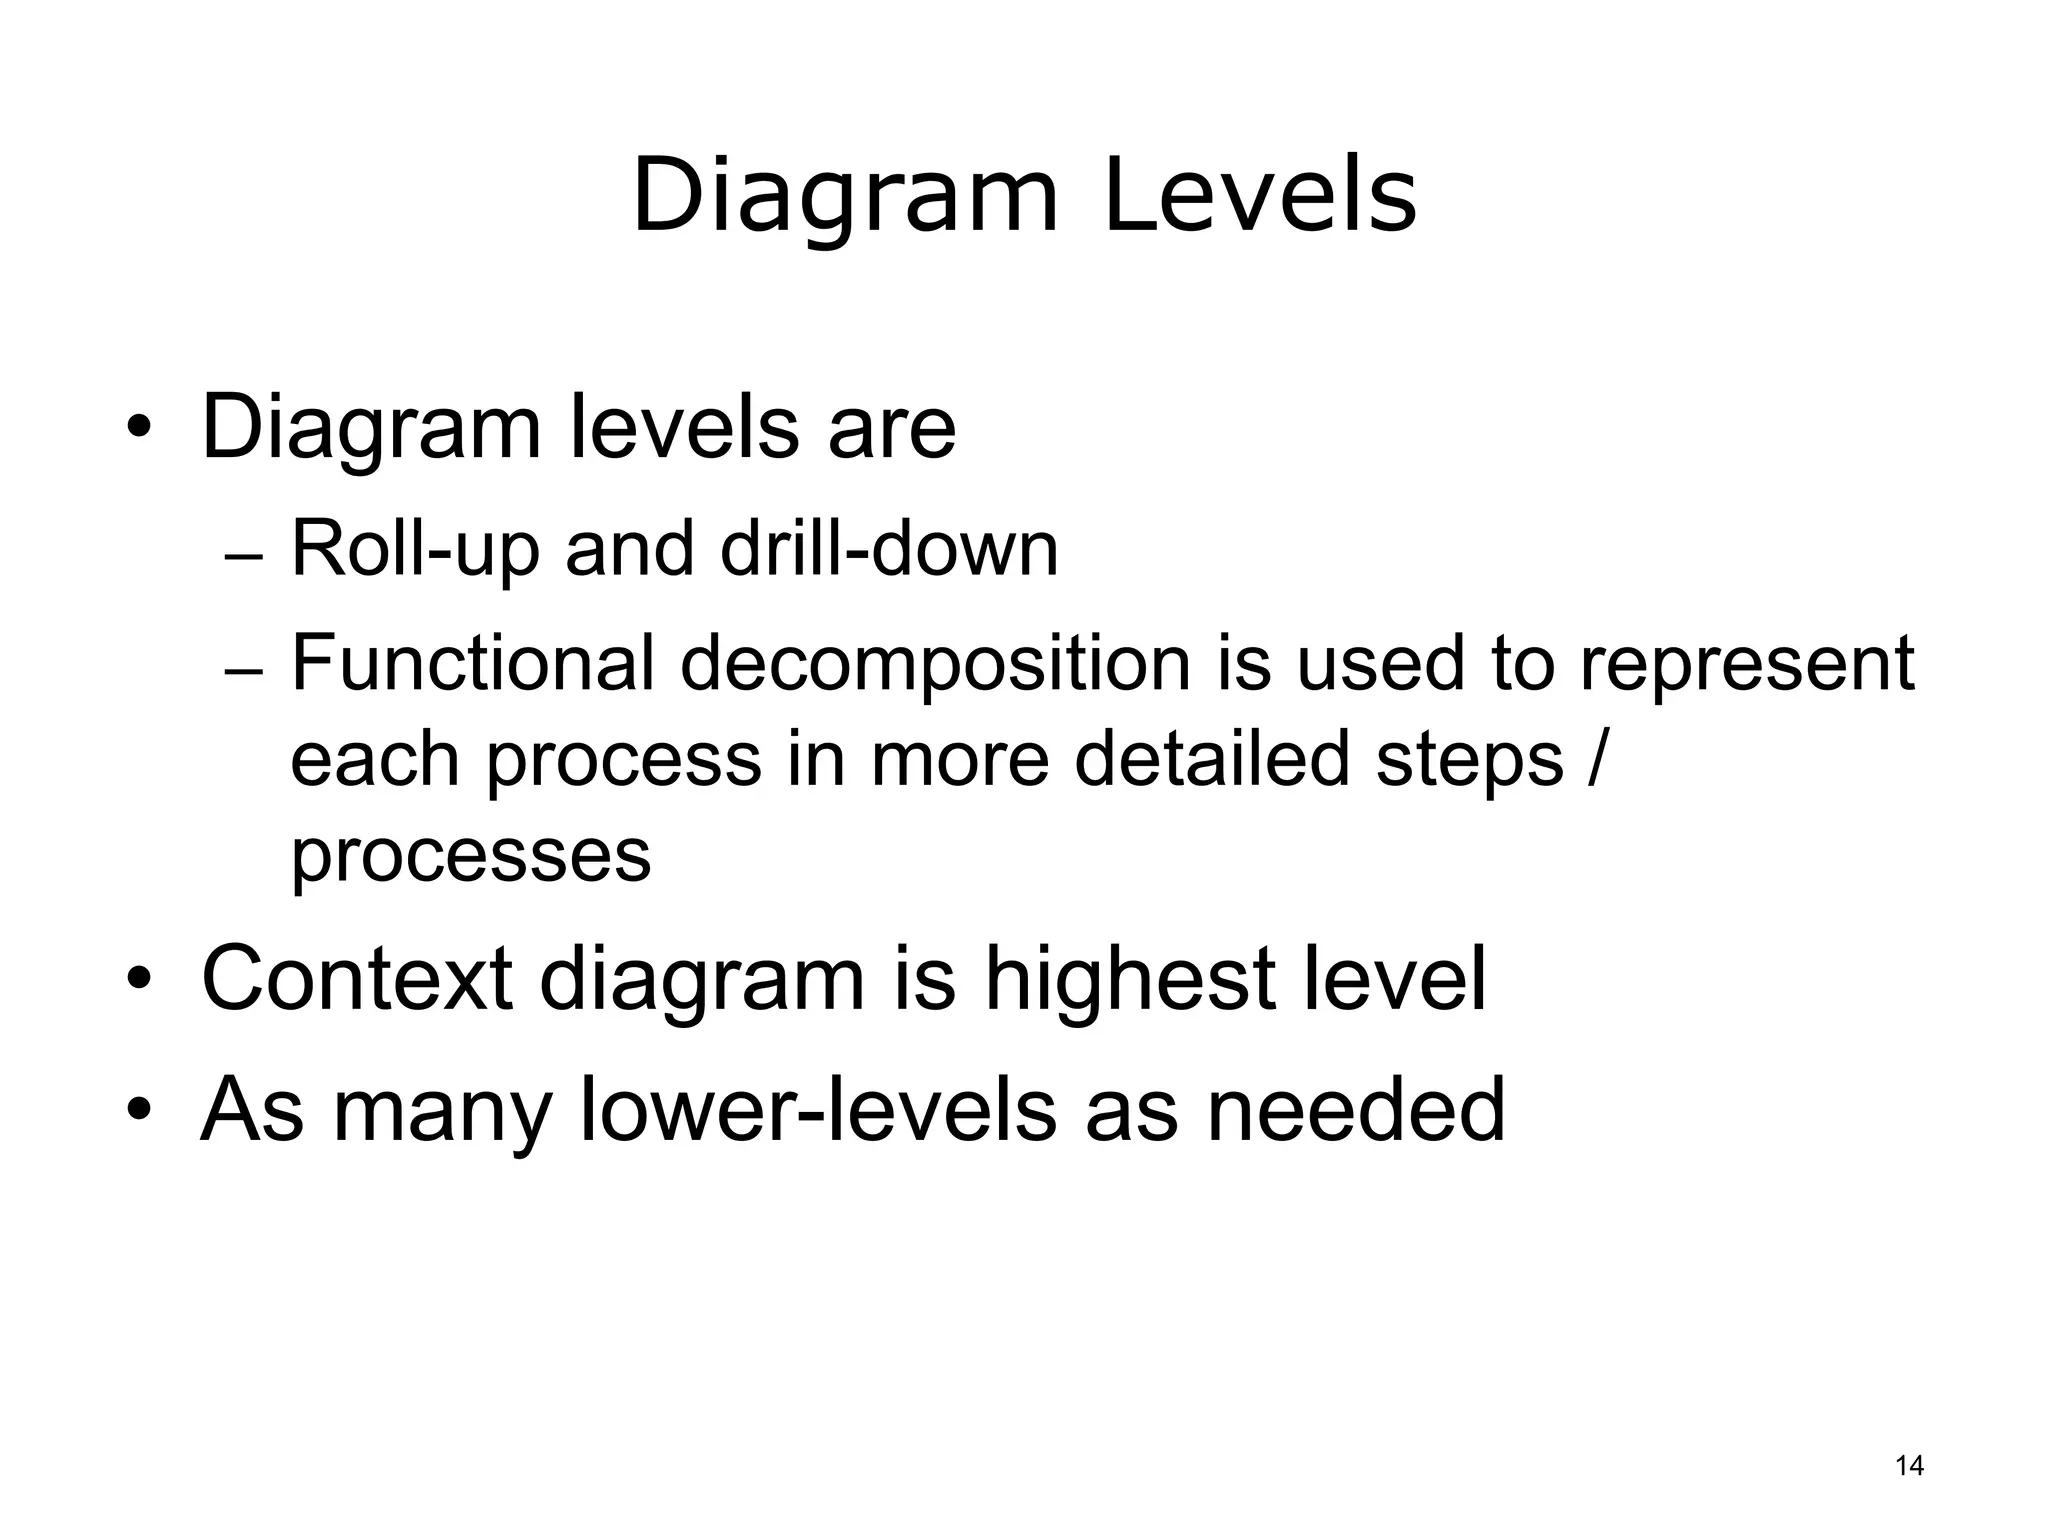
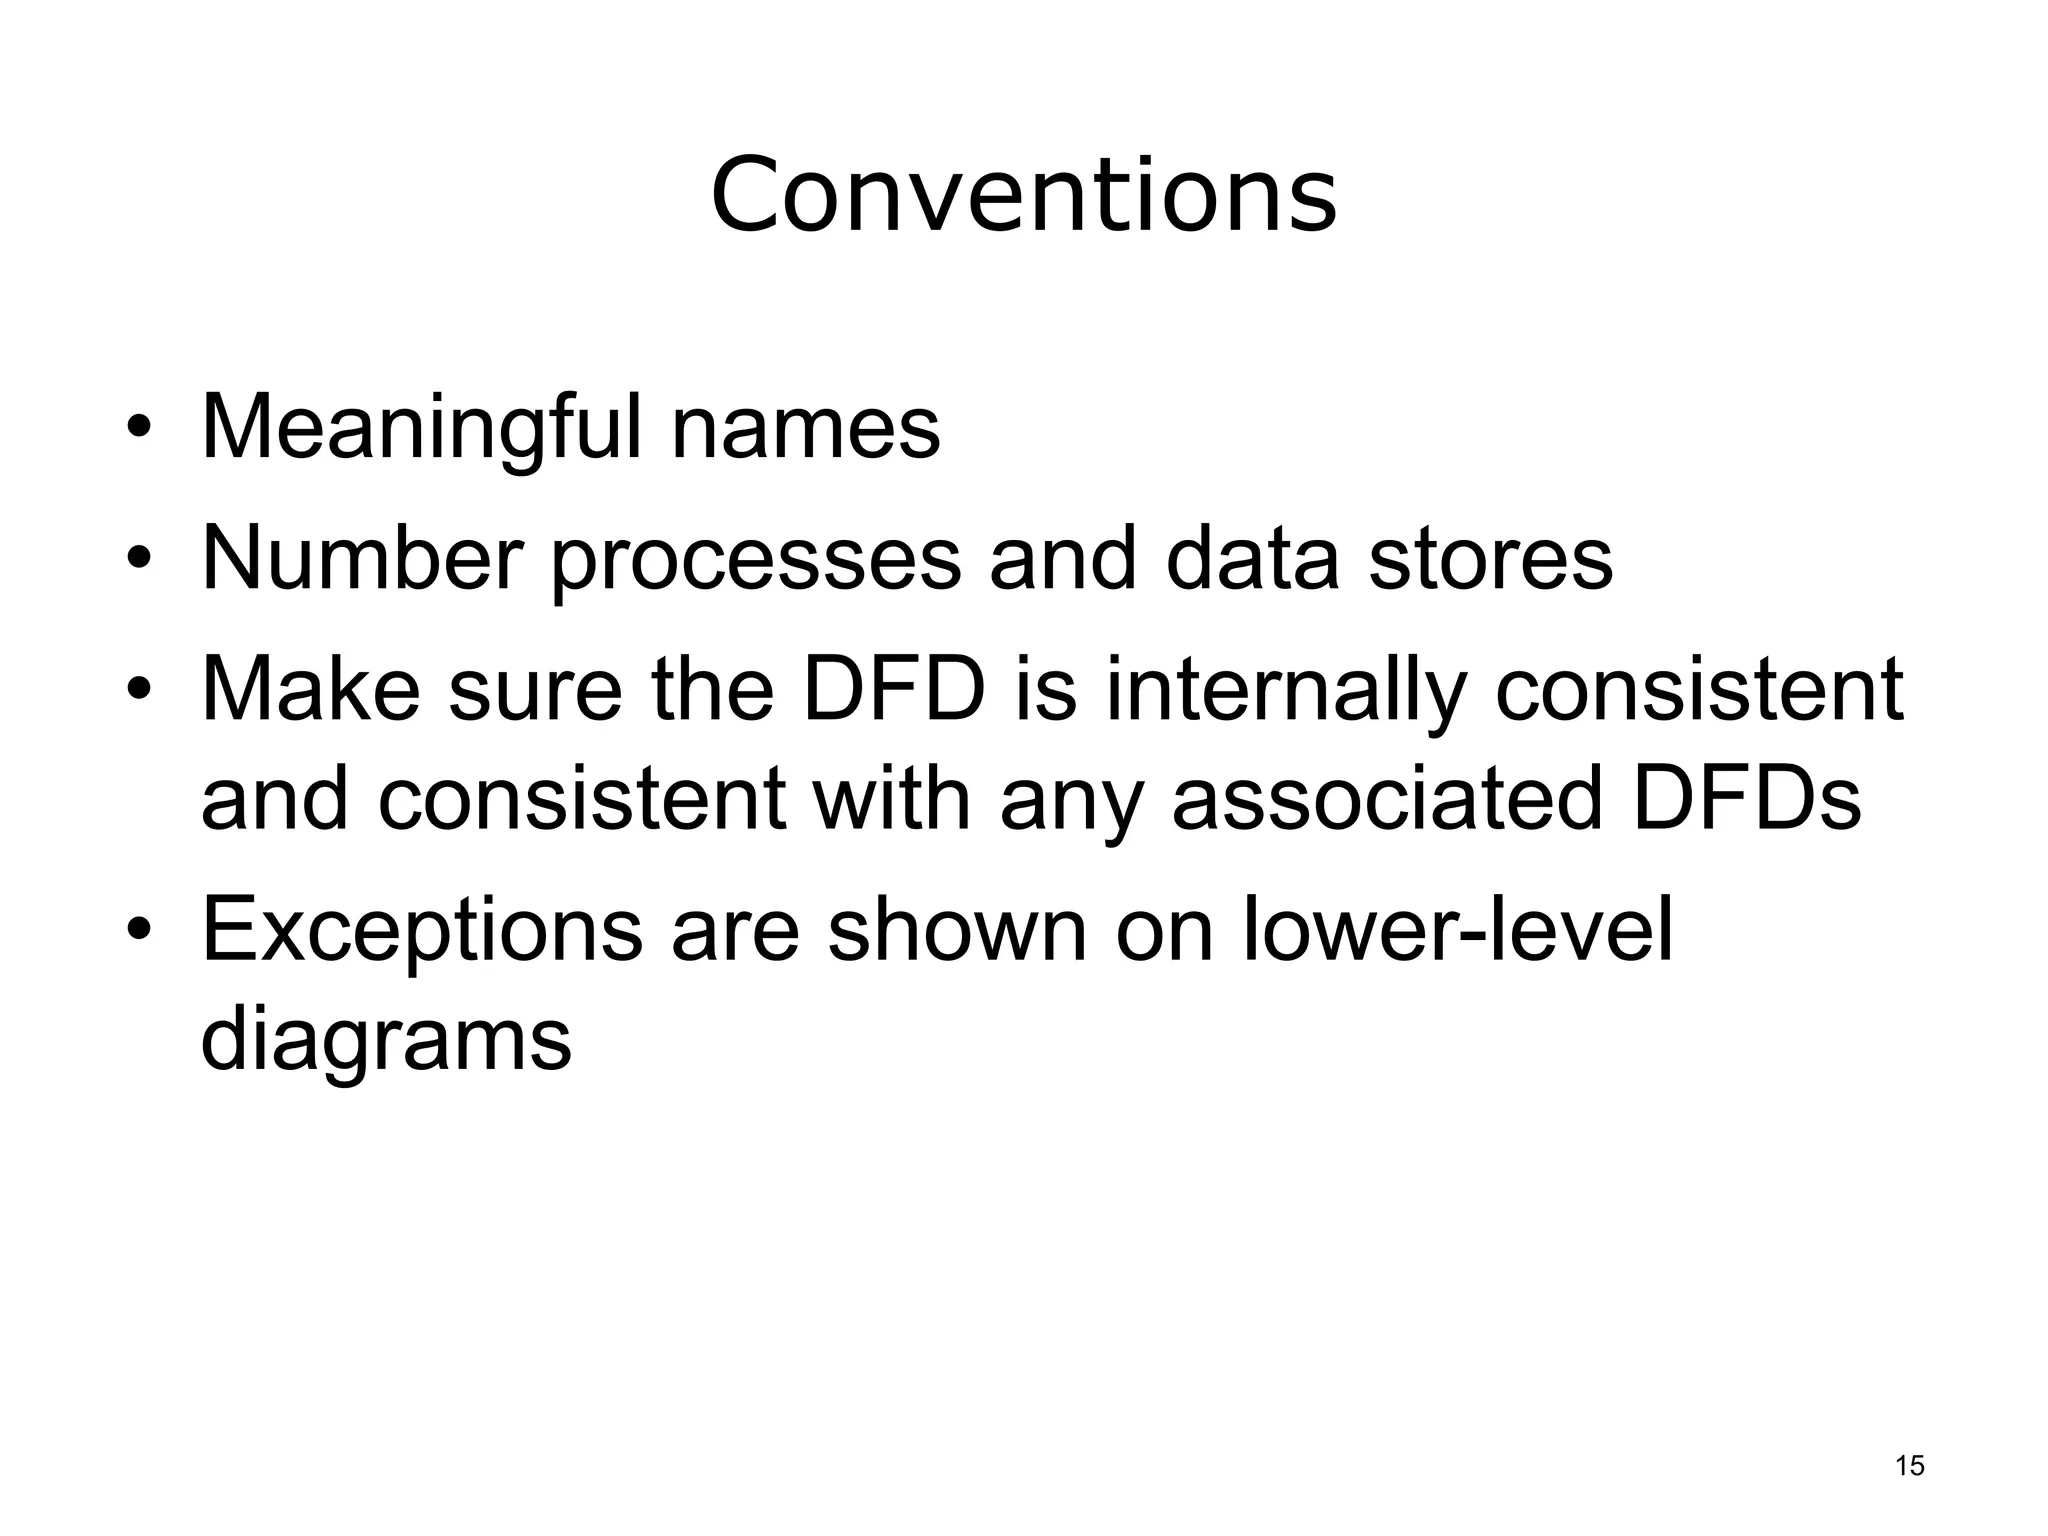
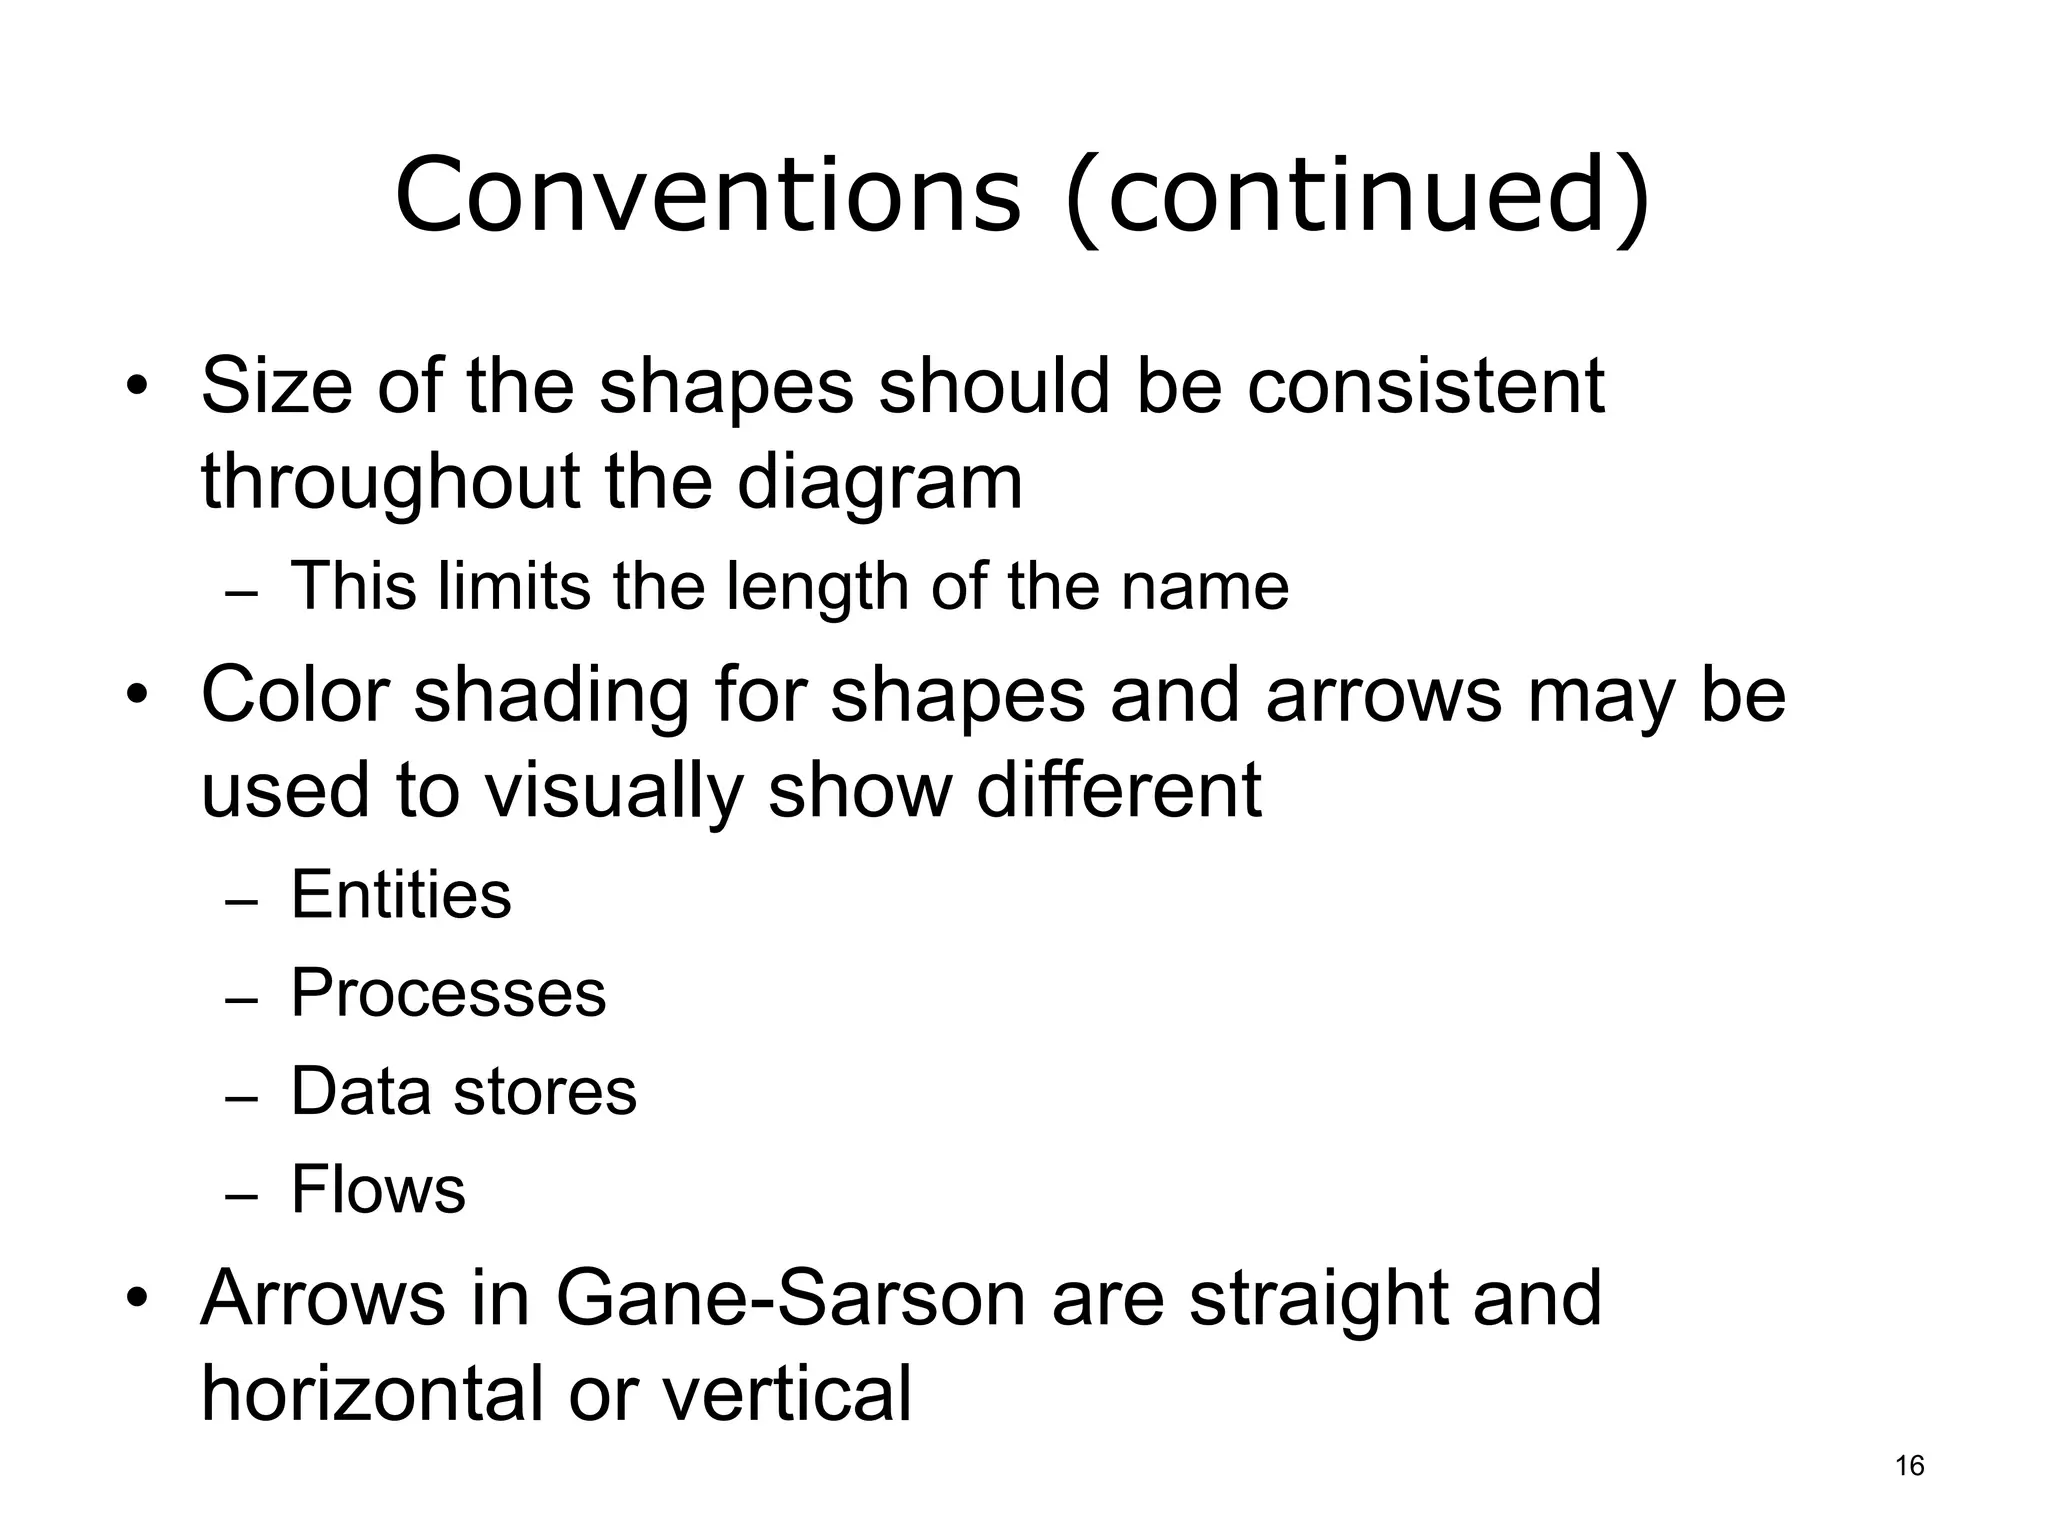
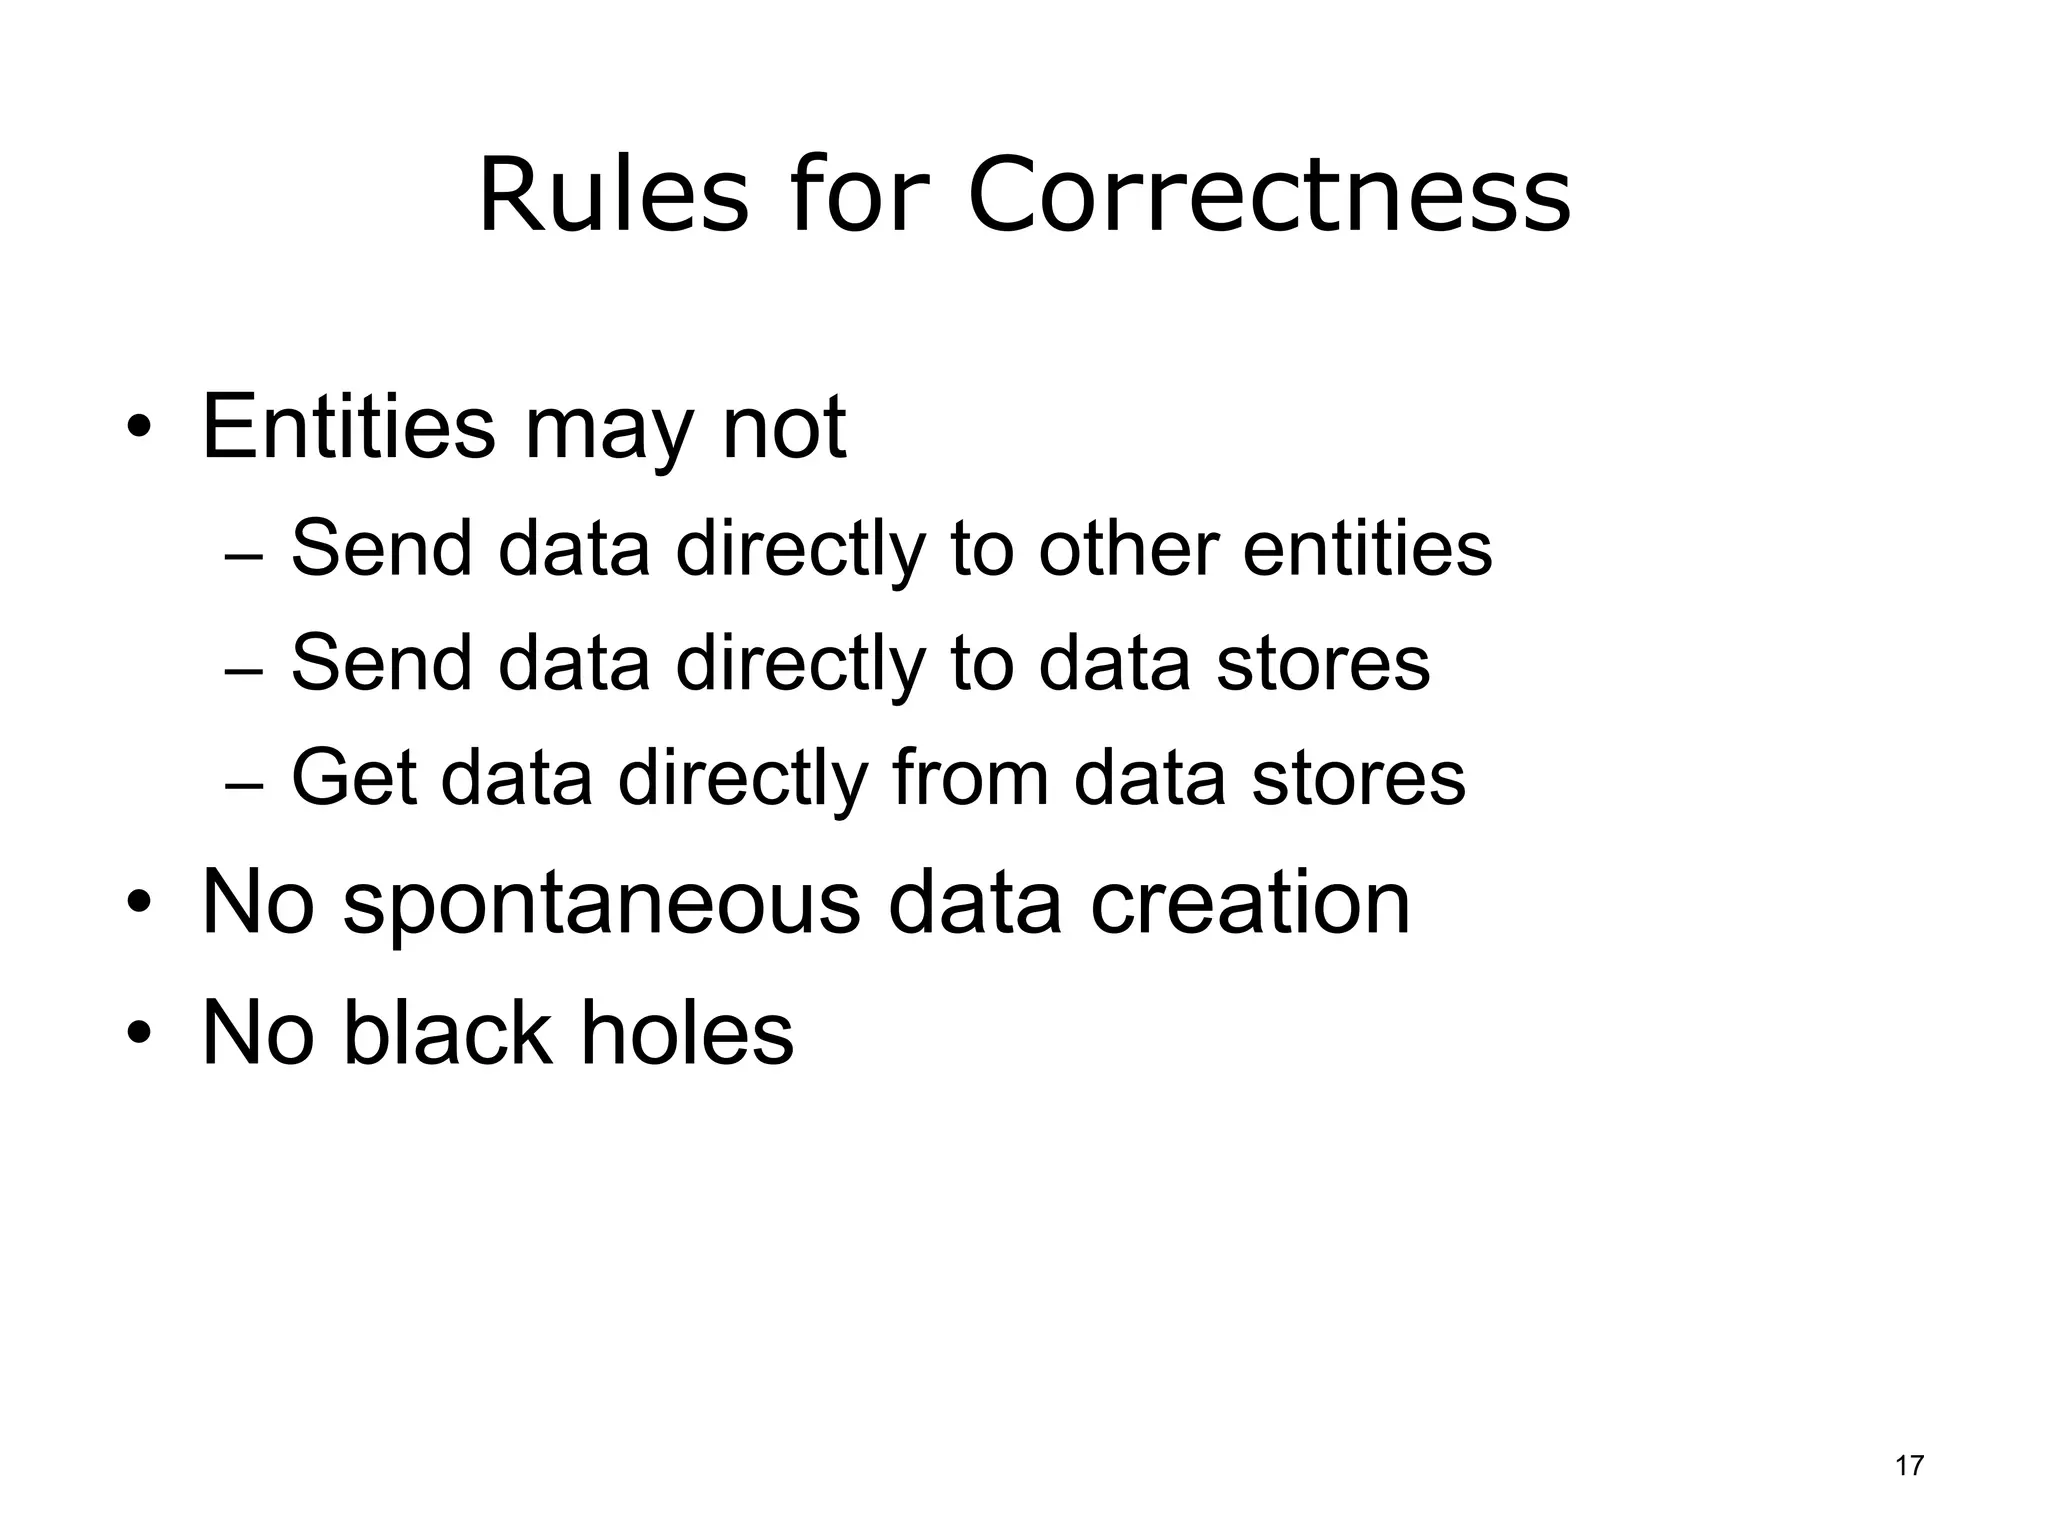
This document discusses process mapping using Gane-Sarson notation. It describes the key symbols and conventions used in Gane-Sarson data flow diagrams, including entities, processes, data flows, and data stores. It provides an example of a simplified online appointment scheduling process mapped out using Gane-Sarson notation. The document also covers best practices for creating and reading Gane-Sarson diagrams, such as using meaningful names and numbering elements consistently.
This presentation gives the idea about Data Preprocessing in the field of Data Mining. Images, examples and other things are adopted from "Data Mining Concepts and Techniques by Jiawei Han, Micheline Kamber and Jian Pei "
These slides cover the following concepts:
~ RDBMS vs DBMS
~ RDBMS structure
~ RDBMS basics for beginners
~ RELATIONAL DATABASE MANAGEMENT SYSTEM
~ DATA, SCHEMA, AND DATABASE
~ WHAT IS RDBMS?
~ FEATURES OF RDBMS
~ RELATIONSHIPS IN DATABASE
~ RULES OF RDBMS
~ ELEMENTS OF RDBMS
~ SQL COMMANDS
~ SQL CONSTRAINTS
~ COMMON SQL CONSTRAINTS
~ DATA DEFINITION LANGUAGE SCRIPT (DDL)
~ DATA MANIPULATION LANGUAGE SCRIPT (DML)
~ DATA CONTROL LANGUAGE SCRIPT (DCL)
~ PRIMARY KEY, FOREIGN KEY
~ EXAMPLE OF PRIMARY AND FOREIGN KEY
~ DBMS VS RDBMS
~ RDBMS NORMALIZATION
~ BENEFITS OF NORMALIZING
~ SQL JOINS
~ INNER JOIN
~ LEFT OUTER JOIN
~ RIGHT OUTER JOIN
~ FULL OUTER JOIN
~ CROSS JOIN
~ SELF JOIN
Data preprocessing techniques are applied before mining. These can improve the overall quality of the patterns mined and the time required for the actual mining.
Some important data preprocessing that must be needed before applying the data mining algorithm to any data sets are completely described in these slides.
This presentation delivered for undergraduate students under the university relations programme of 99X Technology. This presentation covers basic concepts of Unified Modelling Language including some hands-on activities.
The development of modern information systems is a demanding task. New technologies and tools are designed, implemented and presented in the market on a daily bases. User needs change dramatically fast and the IT industry copes to reach the level of efficiency and adaptability for its systems in order to be competitive and up-to-date. Thus, the realization of modern information systems with great characteristics and functionalities implemented for specific areas of interest is a fact of our modern and demanding digital society and this is the main scope of this Presentation.
This presentation gives an overview of Databases and Term used in used in Databases Aspect. It also, help you to understand the clear description of Database Learning. Best Suited for Beginners and advanced level learners.
On multi dimensional cubes of census data: designing and queryingJaspreet Issaj
The primary focus of this research is to design a data warehouse that specifically targets OLAP storage, analyzing and querying requirements to the multidimensional cubes of census data with an efficient and timely manner.
Entity matching and entity resolution are becoming more important disciplines in data management over time, based on increasing number of data sources that should be addressed in economy that is undergoing digital transformation process, growing data volumes and increasing requirements related to data privacy. Data matching process is also called record linkage, entity matching or entity resolution in some published works. For long time research about the process was focused on matching entities from same dataset (i.e. deduplication) or from two datasets. Different algorithms used for matching different types of attributes were described in the literature, developed and implemented in data matching and data cleansing platforms. Entity resolution is element of larger entity integration process that include data acquisition, data profiling, data cleansing, schema alignment, data matching and data merge (fusion).
We can use motivating example of global pharmaceutical company with offices in more than 60 countries worldwide that migrated customer data from various legacy systems in different countries to new common CRM system in the cloud. Migration was phased by regions and countries, with new sources and data incrementally added and merged with data already migrated in previous phases. Entity integration in such case require deep understanding of data architectures, data content and each step of the process. Even with such deep understanding, design and implementation of the solution require many iterations in development process that consume human resources, time and financial resources. Reducing the number of iterations by automating and optimizing steps in the process can save vast amount of resources. There is a lot of available literature addressing any of the steps in the process, proposing different options for improvement of results or processing optimization, but the whole process still require a lot of human work and subject matter specific knowledge and many iterations to produce results that will have high F-measure (both high precision and recall). Most of the algorithms used in the various steps of the process are Human in the loop (HITL) algorithms that require human interaction. Human is always part of the simulation and consequently influences the outcome.
This paper is a part of the work in progress aimed to define conceptual framework that will try to automate and optimize some steps of entity integration process and try to reduce requirements for human influence in the process. In this paper focus will be on conceptual process definition, recommended data architecture and use of existing open source solutions for entity integration process automation and optimization.
Health Education on prevention of hypertensionRadhika kulvi
Hypertension is a chronic condition of concern due to its role in the causation of coronary heart diseases. Hypertension is a worldwide epidemic and important risk factor for coronary artery disease, stroke and renal diseases. Blood pressure is the force exerted by the blood against the walls of the blood vessels and is sufficient to maintain tissue perfusion during activity and rest. Hypertension is sustained elevation of BP. In adults, HTN exists when systolic blood pressure is equal to or greater than 140mmHg or diastolic BP is equal to or greater than 90mmHg. The
COVID-19 PCR tests remain a critical component of safe and responsible travel in 2024. They ensure compliance with international travel regulations, help detect and control the spread of new variants, protect vulnerable populations, and provide peace of mind. As we continue to navigate the complexities of global travel during the pandemic, PCR testing stands as a key measure to keep everyone safe and healthy. Whether you are planning a business trip, a family vacation, or an international adventure, incorporating PCR testing into your travel plans is a prudent and necessary step. Visit us at https://www.globaltravelclinics.com/
How many patients does case series should have In comparison to case reports.pdfpubrica101
Pubrica’s team of researchers and writers create scientific and medical research articles, which may be important resources for authors and practitioners. Pubrica medical writers assist you in creating and revising the introduction by alerting the reader to gaps in the chosen study subject. Our professionals understand the order in which the hypothesis topic is followed by the broad subject, the issue, and the backdrop.
https://pubrica.com/academy/case-study-or-series/how-many-patients-does-case-series-should-have-in-comparison-to-case-reports/
PET CT beginners Guide covers some of the underrepresented topics in PET CTMiadAlsulami
This lecture briefly covers some of the underrepresented topics in Molecular imaging with cases , such as:
- Primary pleural tumors and pleural metastases.
- Distinguishing between MPM and Talc Pleurodesis.
- Urological tumors.
- The role of FDG PET in NET.
CHAPTER 1 SEMESTER V PREVENTIVE-PEDIATRICS.pdfSachin Sharma
This content provides an overview of preventive pediatrics. It defines preventive pediatrics as preventing disease and promoting children's physical, mental, and social well-being to achieve positive health. It discusses antenatal, postnatal, and social preventive pediatrics. It also covers various child health programs like immunization, breastfeeding, ICDS, and the roles of organizations like WHO, UNICEF, and nurses in preventive pediatrics.
CHAPTER 1 SEMESTER V - ROLE OF PEADIATRIC NURSE.pdfSachin Sharma
Pediatric nurses play a vital role in the health and well-being of children. Their responsibilities are wide-ranging, and their objectives can be categorized into several key areas:
1. Direct Patient Care:
Objective: Provide comprehensive and compassionate care to infants, children, and adolescents in various healthcare settings (hospitals, clinics, etc.).
This includes tasks like:
Monitoring vital signs and physical condition.
Administering medications and treatments.
Performing procedures as directed by doctors.
Assisting with daily living activities (bathing, feeding).
Providing emotional support and pain management.
2. Health Promotion and Education:
Objective: Promote healthy behaviors and educate children, families, and communities about preventive healthcare.
This includes tasks like:
Administering vaccinations.
Providing education on nutrition, hygiene, and development.
Offering breastfeeding and childbirth support.
Counseling families on safety and injury prevention.
3. Collaboration and Advocacy:
Objective: Collaborate effectively with doctors, social workers, therapists, and other healthcare professionals to ensure coordinated care for children.
Objective: Advocate for the rights and best interests of their patients, especially when children cannot speak for themselves.
This includes tasks like:
Communicating effectively with healthcare teams.
Identifying and addressing potential risks to child welfare.
Educating families about their child's condition and treatment options.
4. Professional Development and Research:
Objective: Stay up-to-date on the latest advancements in pediatric healthcare through continuing education and research.
Objective: Contribute to improving the quality of care for children by participating in research initiatives.
This includes tasks like:
Attending workshops and conferences on pediatric nursing.
Participating in clinical trials related to child health.
Implementing evidence-based practices into their daily routines.
By fulfilling these objectives, pediatric nurses play a crucial role in ensuring the optimal health and well-being of children throughout all stages of their development.
Trauma Outpatient Center is a comprehensive facility dedicated to addressing mental health challenges and providing medication-assisted treatment. We offer a diverse range of services aimed at assisting individuals in overcoming addiction, mental health disorders, and related obstacles. Our team consists of seasoned professionals who are both experienced and compassionate, committed to delivering the highest standard of care to our clients. By utilizing evidence-based treatment methods, we strive to help our clients achieve their goals and lead healthier, more fulfilling lives.
Our mission is to provide a safe and supportive environment where our clients can receive the highest quality of care. We are dedicated to assisting our clients in reaching their objectives and improving their overall well-being. We prioritize our clients' needs and individualize treatment plans to ensure they receive tailored care. Our approach is rooted in evidence-based practices proven effective in treating addiction and mental health disorders.
Navigating Challenges: Mental Health, Legislation, and the Prison System in B...Guillermo Rivera
This conference will delve into the intricate intersections between mental health, legal frameworks, and the prison system in Bolivia. It aims to provide a comprehensive overview of the current challenges faced by mental health professionals working within the legislative and correctional landscapes. Topics of discussion will include the prevalence and impact of mental health issues among the incarcerated population, the effectiveness of existing mental health policies and legislation, and potential reforms to enhance the mental health support system within prisons.
Navigating Challenges: Mental Health, Legislation, and the Prison System in B...
Comp10 unit3d lecture_slides
1. Health Care Workflow Process
Improvement
Process Mapping
Lecture d
This material (Comp 10 Unit 3) was developed by Duke University, funded by the Department of Health and
Human Services, Office of the National Coordinator for Health Information Technology under Award
Number IU24OC000024. This material was updated by Normandale Community College, funded under
Award Number 90WT0003.
This work is licensed under the Creative Commons Attribution-NonCommercial-ShareAlike 4.0 International
License. To view a copy of this license, visit http://creativecommons.org/licenses/by-nc-sa/4.0/
5. Background
• Gane-Sarson notation was introduced in
Chris Gane and Trish Sarson’s 1977 book
Structured Systems Analysis: Tools and
Techniques
• Gane-Sarson notation is used for data flow
diagrams
5
8. Gane-Sarson Symbols
• Double square
• Rounded rectangle
• Arrow
• Open-ended rectangle
Symbols used for Gane-Sarson
8
9. Entities
• Entities
– Represent people, organizations, or other things that
interact with the system
– Send or consume information
• If the same entity is shown more than once in a
diagram, a diagonal line is added to the lower
right-hand corner to visually distinguish it
9
10. Process
• Processes transform data
• Process should be named or described with:
– Single word (a verb)
– Phrase
– Simple sentence
o Describing what the process does
• Similar to other notations, a good name will
generally consist of a verb-object phrase such
as check availability
• In some cases, the processes are named for a
role, an organization, or a machine that performs
the process 10
11. Flow
• A data flow is a pipe through which data travel
• Straight lines indicate flow or movement of information
• Flow names indicate the meaning of the data that moves
along the flow
• Flow can:
– Represent only one type of data, e.g., request or reply , OR
– Consolidate several elementary data flows into one flow,
o Request and reply
• The same content may have a different meaning in
different parts of the system
• Every line needs an arrow head to indicate direction of
the data flow
11
12. Data Store
• Collection of data at rest
• Can be in computerized or non-
computerized format
• Stores are passive
– Processes put data in or read data
12
13. Entities Instead of Event List
• Gane-Sarson notation does not use event
lists
• Things that stimulate action from a system
are indicated by entities
13
14. Diagram Levels
• Diagram levels are
– Roll-up and drill-down
– Functional decomposition is used to represent
each process in more detailed steps /
processes
• Context diagram is highest level
• As many lower-levels as needed
14
15. Conventions
• Meaningful names
• Number processes and data stores
• Make sure the DFD is internally consistent
and consistent with any associated DFDs
• Exceptions are shown on lower-level
diagrams
15
16. Conventions (continued)
• Size of the shapes should be consistent
throughout the diagram
– This limits the length of the name
• Color shading for shapes and arrows may be
used to visually show different
– Entities
– Processes
– Data stores
– Flows
• Arrows in Gane-Sarson are straight and
horizontal or vertical
16
17. Rules for Correctness
• Entities may not
– Send data directly to other entities
– Send data directly to data stores
– Get data directly from data stores
• No spontaneous data creation
• No black holes
17
18. Maintenance
• Gane-Sarson is a set of symbols and
conventions named for the people who
developed it.
• There is no formal maintenance
organization.
• Individuals use and adapt it to suit their
needs.
18
19. Process Mapping
Summary – Lecture d
• Gane-Sarson symbols and conventions for
process mapping
• Reading Gane-Sarson data flow diagrams
19
20. Process Mapping
References – Lecture d
References
Gane, C., & Sarson, T. (1979). Structured Systems Analysis: Tools and Techniques. Englewood Cliffs,
NJ: Prentice Hall.
Ken Hopkins, Curriculum Council – Suggested Standards for Information Systems 2006: 238/7,
Newman College, 2001. Retrieved from Newman College Website
Information Systems Teachers, Consensus Meetings 2005. (eds.). 2006, January). INFORMATION
SYSTEMS, Suggested Standards for Information Systems Tools (Year 12 E238/7R). Retrieved
from Trinity College Website
Charts, Tables, Figures
3.4 Table. Methods for diagramming processes. Nahm, M, Duke University, 2012.
Images
Slide 7: Simplified on-line appointment scheduling example using Gane-Sarson notation. Nahm M.,
Duke University, 2012.
Slide 8: Gane-Sarson symbols. Nahm M., Duke University, 2012.
Slide 9: Entities symbol in Gane-Sarson notation. Nahm M., Duke University, 2012.
Slide 10: Process symbol in Gane-Sarson notation. Nahm M., Duke University, 2012.
Slide 11: Flow symbol in Gane-Sarson notation. Nahm M., Duke University, 2012.
Slide 12: Data Store symbols in Sane-Garson notation. Nahm M., Duke University, 2012.
20
21. Process Mapping
Lecture d
This material was developed by Duke University,
funded by the Department of Health and Human
Services, Office of the National Coordinator for
Health Information Technology under Award
Number IU24OC000024. This material was
updated by Normandale Community College,
funded under Award Number 90WT0003.
21
Editor's Notes
Welcome to Health Care Workflow Process Improvement: Process Mapping. This is Lecture d, Gane-Sarson Notation .
This lecture covers Gane-Sarson notation for data flow diagrams.
The objective for this lecture is to:
Read and interpret Gane-Sarson data flow diagram.
The topics covered in lecture d are:
details about Gane-Sarson notation for data flow diagrams
Gane-Sarson symbols and conventions for process mapping
Lecture d does not cover other parts of Gane-Sarson notation, and is not meant to teach you how to draw the diagrams, only to understand and interpret them in case you encounter them in practice.
Each of the methods for diagramming a process has its own set of capabilities. Gane-Sarson represents the process context (that is, the process or system boundaries, interactions with the outside world, and the major functions). It also represents information content, the order or sequence of the data flow steps involved in the process, the transformations that occur or should occur, and the roles that perform the processes. While Gane and Sarson recognized the importance of representing information content and flow control, they did so through text data dictionaries (lists of the data elements) and structured “if-then” type statements. Since these are not graphic representations, we will not cover them here.
Gane and Sarson represented context, data flow and data transformation through one diagram type, the Data Flow Diagram (DFD). Their approach used a high-level DFD to show context, and a more detailed (or series of more detailed) diagrams to show data flow steps. Data transformation is represented on the DFD by a “process” symbol that indicates that data transformation occurs. Then the actual transformation is specified using text.
Gane-Sarson notation was introduced in Chris Gane and Trish Sarson’s 1977 book, Structured Systems Analysis: Tools and Techniques. The book was later published in 1979 by Prentice-Hall. (Gane and Sarson, 1979)
Gane-Sarson notation is used for data flow diagrams.
Although we have not seen Gane-Sarson notation used in health care, process analysts might encounter Gane-Sarson style diagrams, thus, we provide introductory-level information to the notation.
Gane-Sarson notation is specific to data flow diagrams which show the movement, transformation and storage of data.
This is an example of a simplified on-line appointment scheduling Gane-Sarson diagram. The diagram describes a data flow where a patient enters a web inquiry which generates two checks against different databases. After which, the information including an option to accept or decline the appointment is returned to the patient for acceptance.
Gane-Sarson data flow diagram notation uses these four symbols:
Entities show the people, roles, organizations or other things with which the system communicates, i.e., sources or consumers of data.
Processes are shown by square rectangles with rounded corners. They represent data processes, i.e., the various individual functions that the system carries out to transform data inputs into outputs. Process boxes can be numbered to show the sequence in which they are carried out.
Flows are shown by straight arrows. They are the connections between the entities, processes, and data stores. They represent the information that the processes require as input and the information they generate as output.
Data stores are shown by an open-ended long rectangle. They represent collections of data that the system must access (read from or write to) or remember for some period of time. Data stores typically exist as files or databases.
Entities represent people, organizations, or other things that interact with the system, i.e. entities are “outside of the system,” that is they are part of a process, but external to the information system.
Entities send or consume information, and in Gane-Sarson notation are also called sources or sinks of information.
If the same entity is shown more than once in a diagram, a diagonal line is added to the lower right-hand corner to visually distinguish it. For example, if the nurse entity was drawn twice, to keep from having a lot of criss-crossing lines on the diagram, a single diagonal line would be added to the lower right-hand corner. Further, if a medical assistant entity was similarly drawn twice on the same diagram, two diagonal lines would be added to visually distinguish it from the nurse and patient entities.
Processes transform data.
The process should be named or described by a single word (a verb), phrase, or simple sentence that describes what the process does.
Similar to other notations, a good name will generally consist of a verb-object phrase such as check availability.
In some cases, the processes are named for a role, an organization, or a machine that performs the process.
Processes are given a number in the upper right-hand corner; this is an identifier and does not imply sequence. Optionally, processes can also have a lower section, similar in appearance to the process identifier part at the top, in which the role or machine that accomplishes the process, or the physical location of the process is undertaken.
Similar to ISO 5807, Gane-Sarson notation uses straight arrows.
Arrows should be named to indicate the meaning of the data that moves along the flow that is, a noun. Data flows with a verb name are incorrect; they signify a process that has been omitted. Data flow in and out of a process must be altered in some way, i.e., not labeled the same thing.
A flow can:
Represent only one type of data, e.g., request or reply , or
Consolidate several elementary dataflows into one flow, e.g., request and reply.
This is dependent on the intended detail-level of the diagram.
The same content may have a different meaning in different parts of the system, for example, address (as input by the receptionist) versus address after validation with the directory.
Arrows indicate direction of the data flow, for example, from the practice EMR to the pharmacy.
The data store is used to model a collection of data at rest.
Data stores can be in computerized or non-computerized form, such as paper charts, microfiche, index cards, etc.
Stores are passive; processes put data in or read data.
Like processes, data stores can be given an identifying number, e.g., D1, D2, etc., where “D” denotes a data store and the number serves as a unique identifier. Like entities, data stores can be drawn more than once on a diagram to avoid crisscrossed lines, in this case, a vertical line is added to the closed end of the data store shape.
Unlike Yourdon notation, Gane-Sarson does not use an event list to indicate things that stimulate action from the system.
Things that stimulate action from a system are indicated by entities.
Gane-Sarson, like Yourdon notation, uses leveled diagrams, that is, a roll-up and drill-down approach where increasing levels of detail are shown on successive diagrams.
A process called functional decomposition is used to represent each process in more detailed steps / processes. Each process in a DFD can be “exploded”, i.e., redrawn to show increasing levels of detail. When this is done, decimal numbers can be used to identify the lower detail level process, while maintaining the links to the “parent” or higher level process on the parent diagram.
Context diagram is the highest level.
There are as many lower-levels as needed.
Gane-Sarson Conventions include:
Choosing meaningful names for processes, flows, stores, and terminators,
Numbering the processes and data stores,
Making sure the DFD is internally consistent and consistent with any associated DFDs, and
Exceptions and error handling are shown on lower-level diagrams.
The size of the shapes should be consistent throughout the diagram. Keeping the size of the boxes consistent means that a short enough process name needs to be found so that it fits in the box, or that the name may be abbreviated.
We found no guidance on the use of color shading for shapes or arrows, and expect that since the notation was developed in the 1970’s, that color was not commonly used on the diagrams. However, today, color may be used to visually show different types of entities, processes, data stores or flows.
Arrows in Gane-Sarson are straight, and horizontal or vertical i.e., no diagonal or curved arrow lines. Double headed arrows can be used instead of two separate arrows in opposite directions, such as to represent request and reply.
Hopkins enumerated “Rules for Correctness” for these diagrams (Hopkins, 2006). These rules can be used to assess the logical consistency of the diagrams and include:
Entities may not send data directly to other entities,
Entities may not send data directly to data stores (data must be processed in some way first), and
Entities may not get data directly from data stores (data must be processed in some way first).
Information is neither created nor destroyed, it must come from and go to somewhere. Information comes from and goes to entities and data stores via processes. Watch for spontaneous data creation and black holes. Note: “in-only” data stores may be ok, as when being read by another system. Also “out-only” data stores may be ok, as when getting data from another system.
Data flows with a verb name signify a process that has been omitted.
Like Yourdon notation, Gane-Sarson is a set of symbols and conventions named for the people who developed it.
Gane-Sarson notation has not been adopted as a standard. As such, there is no formal maintenance organization.
Individuals use and adapt it to suit their needs.
This concludes Lecture d, Process Mapping, Gane-Sarson Notation.
You should now be able to;
Understand Gane-Sarson symbols and conventions for data flow diagrams, and
Be able to read and interpret data flow diagrams that use Gane-Sarson notation.