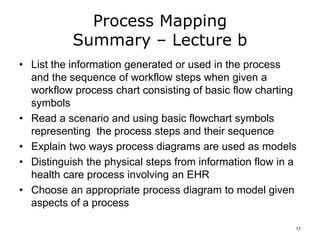
This document provides an overview of process mapping concepts and techniques. It discusses how process maps can be used as models to represent different aspects of reality at varying levels of detail. The document outlines key aspects of processes that can be diagrammed, including context, steps, information flow, and the roles involved. It describes different process mapping methods and provides examples of typical scenarios where process mapping is useful, such as for documenting existing workflows and identifying areas for improvement. Examples of process mapping a health care facility workflow are also presented.
Real Time Web-based Data Monitoring and Manipulation System to Improve Transl...CSCJournals
The use of the internet technology and web browser capabilities of the internet has provided researchers/scientists with many advantages, which includes but not limited to ease of access, platform independence of computer systems, relatively low cost of web access etc. Hence online collaboration like social networks and information/data exchange among individuals and organizations can now be done seamlessly. In practice, many investigators rely heavily on different data modalities for studying and analyzing their research/study and also for producing quality reports. The lack of coherency and inconsistencies in data sets can dramatically reduce the quality of research data. Thus to prevent loss of data quality and value and provide the needed functionality of data, we have proposed a novel approach as an ad-hoc component for data monitoring and manipulation called RTWebDMM (Real Time Web-based Data Monitoring and Manipulation) system to improve the quality of translational research data. The RTWebDMM is proposed as an auditor, monitor, and explorer for improving the way in which investigators access and interact with the data sets in real time using a web browser. The performance of the proposed approach was evaluated with different data sets from various studies. It is demonstrated that the approach yields very promising results for data quality improvement while leveraging on a web-enabled environment.
Selection of Articles Using Data Analytics for Behavioral Dissertation Resear...PhD Assistance
Outcomes in health-related issues including psychological, educational, Behavioral, environmental, and social are intended to sustain positive change by digital interferences. These changes may be delivered using any digital device like a phone or computer, and make them gainful for the provider. Complex and large-scale datasets that contain usage data can be yielded by testing a digital intervention. This data provides invaluable detail about how the users interact with these interventions and notify their knowledge of engagement, if they are analyzed properly. This paper recommends an innovative framework for the process of analyzing usage associated with a digital intervention .
PhD Assistance is an Academic The Best Dissertation Writing Service & Consulting Support Company established in 2001. specialiWeze in providing PhD Assignments, PhD Dissertation Writing Help , Statistical Analyses, and Programming Services to students in the USA, UK, Canada, UAE, Australia, New Zealand, Singapore and many more.
Website Visit: https://bit.ly/3dANXUD
Contact Us:
UK NO: +44-1143520021
India No: +91-8754446690
Email: info@phdassistance.com
The tasks You are assumed to be one of the software consultants .docxsarah98765
The tasks
You are assumed to be one of the software consultants appointed to shoulder the system analysis responsibilities in, the project outlined in, the case study. You will plan and manage the project as well as investigate and document its system requirements. You will produce a report that discusses this project based on your understanding of it and the related investigation results through the tasks below.
Task 1:
Approaches to Systems Development • How would you go about developing Hospital Information System? Compare different Software Development approaches to consider the best suited for developing HIS. • Justify the choice of your selected approach to systems development.
Task 2: Systems Requirements • What are the primary functional requirements for the system in the case study? List and discuss
Length: 2000 words
these requirements. • What are the non-functional requirements for the system in the case study? List and discuss these non-functional requirements. Justify the choice of your non-functional requirements
Task 3: Project Cost Benefit Analysis • Discuss your project Cost Benefit Analysis (CBA). CBA should focus the following two main points: a. To determine if an investment (or decision) is sound, ascertaining if – and by how much – its benefits outweigh its costs; and b. To provide a basis for comparing investments (or decisions), comparing the total expected cost of each option with its total expected benefits. • Provide an excel spread sheet with details in a Project Cost Benefit Analysis.
Task 4:) Project Schedule • Show a work breakdown structure and a project schedule as a Gantt Chart. Explain both of them and discuss how they relate to each other.
• Given the system goals, requirements, and scope as they are currently understood, is the project schedule reasonable? Why or why not?
Task 5: System Information Requirement Investigation Techniques • Who are the stakeholders involved? • Explain your choice of the 3 most useful investigation techniques. • Justify the usefulness of these 3 investigation techniques.
Information Systems Analysis and Design
Assessment - Systems Development
Lecturer: Lecturer Name
Tutor: Tutor Name
Prepared by:
Student Name
Student Number
Table of Contents (TOC)
Insert a word generated table of contents here
How to create a table of contents in Microsoft Word
1. Apply the built-in Heading styles to the headings in your text.
2. In Word 2007 and Word 2010: References > Table of Contents > choose an option from the menu.
1. Introduction
Add your contents here.
Note: In this section, you provide a clear definition of the aims of this report. You also identify the project objectives. Explain all findings in the reporting document.
2. Approach to Systems Development
Please add your contents here. There are many approaches to Systems development such as Water fall SDLC, Agile, RAD JAD. etc. You need to clearly explain which .
Just tried to make a project proposal of my "Hospital Management Project". It may have errors.I have taken help from some source.It will be pleasure to me this proposal it helps someone.
Process Improvement ProjectProcess IdentificationIn thisDaliaCulbertson719
Process Improvement Project
Process Identification
In this paper, a process that will be improved through the DMAIC methodology will be identified. In this case, the process to be evaluated is the service offered to an a la carte menu (Nandakumar et al., 2020). This is a type of menu whereby the food is prepared after being ordered by a customer. In this process, the first step is the customer entering the store. The second process is the waiter approaching the customer and asking them the meal that they want to take. After taking the order, the waiter then takes the order to the chef so that it may be prepared. When the order is prepared, the food is then taking to the customers and they pay after receiving all the services needed.
High-level Processes
The high-level processes, in this case, including taking the customer’s order. In this process, the waiting staff ensures that they get the order right before taking the order to be cooked. The other high-level process is cooking the order. That entails using all the ingredients required to ensure that the food cooked is of high quality. The third high-level process is serving the customer with the food. That ensures that the customer receives the order that they wanted. The last high-level process s making payments. After the customer is satisfied with the services, they pay for their services before walking away.
Inefficiencies
Some inefficiencies have been identified in the process and they should be corrected for better service provision. One of the inefficiencies is that the customers are not provided with the menu unless they ask for it. They should be provided with the menu and be given some time to choose the food they want. The second inefficiency is that the waiting staff does not consult the payment method the customers want to use. Additionally, since it is an a la carte menu, the customers have to wait for some time before being served. Thus, they should be engaged in activities that will help them to pass the time.
References
Nandakumar, N., Saleeshya, P. G., & Harikumar, P. (2020). Bottleneck identification and process improvement by lean six sigma DMAIC methodology. Materials Today: Proceedings, 24, 1217-1224.
MGT 4399: Quality Management
Module 4 Case Study Assignment: Creating a Data Collection Plan
Guidelines and Rubric
Before measuring process data, it is important to first create a data collection plan. This is a detailed document describing the exact steps
needed to gather the right quantity of targeted data items in a cost-effective manner. This data plan should facilitate collecting and measuring
relevant data needed to evaluate the process problem.
For this assignment, you will refer back to the Case Study: Applying Lean Six Sigma in a Financial Services Firm (pp. 56-59) in An Introduction
to Six Sigma & Process Improvement and create a brief data collection plan based on the case study.
Specifically, be sure to address the followi ...
It is especially designed to automate and streamline IT services, help desk and customer support processes. Its also provides an integrated knowledge base with built-in customizable search feature for instant business intelligence features such as alerts, reports and emails.
DECODING THE RISKS - ALCOHOL, TOBACCO & DRUGS.pdfDr Rachana Gujar
Introduction: Substance use education is crucial due to its prevalence and societal impact.
Alcohol Use: Immediate and long-term risks include impaired judgment, health issues, and social consequences.
Tobacco Use: Immediate effects include increased heart rate, while long-term risks encompass cancer and heart disease.
Drug Use: Risks vary depending on the drug type, including health and psychological implications.
Prevention Strategies: Education, healthy coping mechanisms, community support, and policies are vital in preventing substance use.
Harm Reduction Strategies: Safe use practices, medication-assisted treatment, and naloxone availability aim to reduce harm.
Seeking Help for Addiction: Recognizing signs, available treatments, support systems, and resources are essential for recovery.
Personal Stories: Real stories of recovery emphasize hope and resilience.
Interactive Q&A: Engage the audience and encourage discussion.
Conclusion: Recap key points and emphasize the importance of awareness, prevention, and seeking help.
Resources: Provide contact information and links for further support.
TEST BANK For Accounting Information Systems, 3rd Edition by Vernon Richardso...rightmanforbloodline
TEST BANK For Accounting Information Systems, 3rd Edition by Vernon Richardson, Verified Chapters 1 - 18, Complete Newest Version
Rate Controlled Drug Delivery Systems, Activation Modulated Drug Delivery Systems, Mechanically activated, pH activated, Enzyme activated, Osmotic activated Drug Delivery Systems, Feedback regulated Drug Delivery Systems systems are discussed here.
Stem Cell Solutions: Dr. David Greene's Path to Non-Surgical Cardiac CareDr. David Greene Arizona
Explore the groundbreaking work of Dr. David Greene, a pioneer in regenerative medicine, who is revolutionizing the field of cardiology through stem cell therapy in Arizona. This ppt delves into how Dr. Greene's innovative approach is providing non-surgical, effective treatments for heart disease, using the body's own cells to repair heart damage and improve patient outcomes. Learn about the science behind stem cell therapy, its benefits over traditional cardiac surgeries, and the promising future it holds for modern medicine. Join us as we uncover how Dr. Greene's commitment to stem cell research and therapy is setting new standards in healthcare and offering new hope to cardiac patients.
ALKAMAGIC PLAN 1350.pdf plan based of door to door delivery of alkaline water...rowala30
Alka magic plan 1350 -we deliver alkaline water at your door step and you can make handsome money by referral programme
we also help and provide systematic guideline to setup 1000 lph alkaline water plant
LGBTQ+ Adults: Unique Opportunities and Inclusive Approaches to CareVITASAuthor
This webinar helps clinicians understand the unique healthcare needs of the LGBTQ+ community, primarily in relation to end-of-life care. Topics include social and cultural background and challenges, healthcare disparities, advanced care planning, and strategies for reaching the community and improving quality of care.
Trauma Outpatient Center is a comprehensive facility dedicated to addressing mental health challenges and providing medication-assisted treatment. We offer a diverse range of services aimed at assisting individuals in overcoming addiction, mental health disorders, and related obstacles. Our team consists of seasoned professionals who are both experienced and compassionate, committed to delivering the highest standard of care to our clients. By utilizing evidence-based treatment methods, we strive to help our clients achieve their goals and lead healthier, more fulfilling lives.
Our mission is to provide a safe and supportive environment where our clients can receive the highest quality of care. We are dedicated to assisting our clients in reaching their objectives and improving their overall well-being. We prioritize our clients' needs and individualize treatment plans to ensure they receive tailored care. Our approach is rooted in evidence-based practices proven effective in treating addiction and mental health disorders.
CHAPTER 1 SEMESTER V PREVENTIVE-PEDIATRICS.pdfSachin Sharma
This content provides an overview of preventive pediatrics. It defines preventive pediatrics as preventing disease and promoting children's physical, mental, and social well-being to achieve positive health. It discusses antenatal, postnatal, and social preventive pediatrics. It also covers various child health programs like immunization, breastfeeding, ICDS, and the roles of organizations like WHO, UNICEF, and nurses in preventive pediatrics.
Navigating Challenges: Mental Health, Legislation, and the Prison System in B...Guillermo Rivera
This conference will delve into the intricate intersections between mental health, legal frameworks, and the prison system in Bolivia. It aims to provide a comprehensive overview of the current challenges faced by mental health professionals working within the legislative and correctional landscapes. Topics of discussion will include the prevalence and impact of mental health issues among the incarcerated population, the effectiveness of existing mental health policies and legislation, and potential reforms to enhance the mental health support system within prisons.
1. Health Care Workflow Process
Improvement
Process Mapping
Lecture b
This material (Comp 10 Unit 2) was developed by Duke University, funded by the Department of Health and
Human Services, Office of the National Coordinator for Health Information Technology under Award
Number IU24OC000024. This material was updated by Normandale Community College, funded under
Award Number 90WT0003.
This work is licensed under the Creative Commons Attribution-NonCommercial-ShareAlike 4.0 International
License. To view a copy of this license, visit http://creativecommons.org/licenses/by-nc-sa/4.0/
2. Process Mapping Lecture b
Learning Objectives
1. Analyze an existing workflow process chart in
terms of the information that could be
generated, and the sequence of steps that are
being communicated.
2. Choose the correct scope and detail level for a
process map.
3. Choose an appropriate process mapping
methodology.
4. Create a process map for a health care system
(or system component) using correct symbols
and conventions. 2
3. Process Mapping Concepts
Model: a
representation of
reality
“Essentially, all
models are wrong,
but some are useful.”
- George Box, industrial statistician
Box, 2006
Source: http://en.wikipedia.org/wiki/George_Box 3
4. Different Models
Models represent different aspects and features of reality.
Models can have differing levels of detail, and represent
different perspectives. The best model is the one that
communicates the needed information accurately.
4
5. Different Purposes
Models have different purposes. The features included, the level of
detail, and the perspective reflect the purpose for which the model was
created. The best model is the one that communicates the needed
information accurately.
Representation of reality
(House) Kravtchenko,2010 Blueprint. http://commons.wikimedia.org/wiki/
5
6. Process Diagrams as Abstracts
and Templates
• Some process diagrams are used to visualize
the sequence of tasks and to identify tasks that
are inefficient
– Process diagram used as an abstraction
• Some process maps are used as templates,
for example
– As part of software development
– As part of process redesign
• Process maps as abstracts and templates
document and model the requirements
– Serve as “the holder of the knowledge” 6
7. Physical and Mental Process Steps
Processor
Physical
Steps
Mental
Steps
Information
Processing
Human X X
Physical
and/or
Mental
Machine X Physical
Table 2.1 Physical and Mental Process Steps
7
8. Aspects of Work and Information
Processes that We Diagram
• Context
• Process steps
• Information flow
• Information content
• Information transformation
• Step sequence, control, and status
• Who or what performs the process steps
8
9. Diagramming a Process
• First: Identify the purpose for which the
diagram will be used
• Second:
– Get clear about which process aspects need
to be visualized; choose diagram type
– Decide the required level of detail
• Third: Pick appropriate notation
9
10. Process Diagramming Methods:
So Many to Choose From
• Several methods and notations for diagramming
processes exist
– Main ones include:
o ISO 5807 Flow Charting
o Yourdon including
Yourdon-code
Yourdon-DeMarco)
o Gane-Sarson
o Unified Modeling Language (UML)
o E-R diagram
• They differ in notation and in the process
aspects covered
10
11. Process Features
• Context
• Process steps
• Information flow
• Information content
• Information transformation
• Step sequence, control, and status
• Who or what performs the process steps
11
13. Exercise
• List the steps required to contact a health
care facility and set up an appointment to
meet with a specified team at the facility.
Use those steps to create a flowchart.
13
14. Recommended diagrams for health
care facility workflow
• Context
• Data Flow
• Process steps
– Information content
– Information transformation
• Step sequence, control and status
• Roles (who or what) performs the steps
14
15. Typical Workflow Diagramming
Scenario
• Need to diagram the process as it is
• Context diagram to capture:
– The whole
– High-level data flow so that necessary data
exchange is documented
• ISO 5807 Flowchart to capture:
– Process steps
– Sequence and control of steps
– Roles performing steps
15
16. Cabarrus Health Alliance
• Robert Woods Johnson Foundation grant
• Public Health Informatics Institute
• Cabarrus Health Alliance (CBA) process
analysis and improvement through information
technology introduction.
• Excellent case study of using the methods
described above to analyze and evaluate
improvements in process and informatics for
their Public Health Department.
http://www.cabarrushealth.org/CommonGround/
16
17. Process Mapping
Summary – Lecture b
• List the information generated or used in the process
and the sequence of workflow steps when given a
workflow process chart consisting of basic flow charting
symbols
• Read a scenario and using basic flowchart symbols
representing the process steps and their sequence
• Explain two ways process diagrams are used as models
• Distinguish the physical steps from information flow in a
health care process involving an EHR
• Choose an appropriate process diagram to model given
aspects of a process
17
18. Process Mapping
References - Lecture b
References
Box, G. Improving almost anything. Ideas and essays. 2006.
Coiera, E. (2003). Guide to Health Informatics (2nd ed.). London: Hodder Arnold Publishers.
EMR/Practice Management Evaluation Project for Local Public Health Clinics & Case Management.
(n.d.). Retrieved from Cabarrus Health Alliance website: ISO/ANSI 5807 Information processing -
Documentation symbols and conventions for data, program and system flowcharts, program
network charts and system resources charts. 1985.
Juran, JM, Gryna, FM. (eds.) Juran’s Quality Control Handbook. 1988 McGraw-Hill, Inc. New York.
Public Health Institute, 2006. Taking Care of Business: A Collaboration to Define Local Health
Department Business Processes. Decatur, GA: Public Health Informatics Institute. Retrieved
from Public Health Informatics Institute.
Yourdon E. Just Enough Structured Analysis. 2006 revision. Retrieved from Yourdon Chapter 9.
Charts, Tables, Figures
Table 2.1 Physical and Mental Process Steps. Nahm, M (2012)
Table 2.2 Methods for Diagramming Processes. Nahm, M (2012)
18
19. Process Mapping
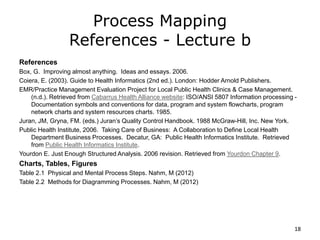
References - Lecture b, continued
Images
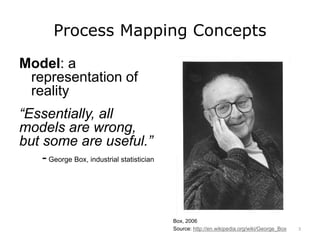
Slide 3: George Box [Photograph]. Retrieved from: Wikipedia
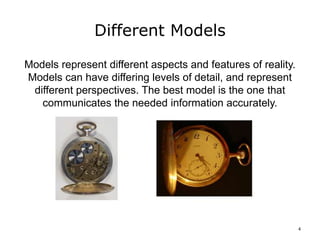
Slide 4: Grobe, H. [Photographer]. Elgin pocket watch [Photograph]. (1930?). Retrieved from:
Wikipedia Commons
Slide 4: Bananenfalter. [Photographer]. Pocket Watch [Photograph]. Retrieved from: Wikipedia
Commons
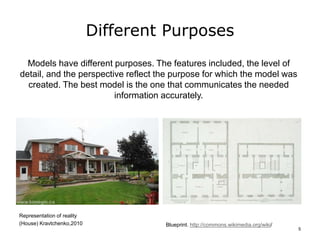
Slide 5: Kravtchenko, I. [Photographer]. Dairy Farm [Photograph]. (2010). Retrieved 2 from:
Wikipedia Commons
Slide 5: (Right) blueprint, obtained from Wikipedia Commons
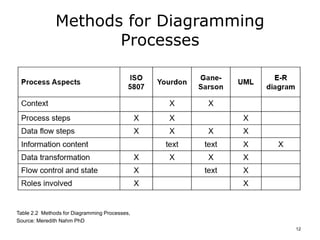
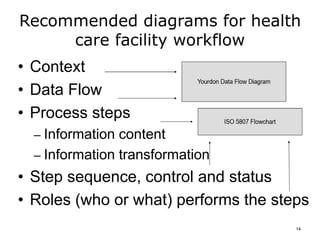
Slide 14: Source: Nahm, H. (2012)
•1
20. Process Mapping
Lecture b
This material was developed by Duke University,
funded by the Department of Health and Human
Services, Office of the National Coordinator for
Health Information Technology under Award
Number IU24OC000024. This material was
updated by Normandale Community College,
funded under Award Number 90WT0003.
20
Editor's Notes
Welcome to the Health Care Workflow Process Improvement, Process Mapping. This is Lecture b, Diagramming Tools.
The objectives for this lecture, Process Mapping Diagramming Tools are to:
Analyze an existing workflow process chart in terms of the information that could be generated, and the sequence of steps that are being communicated.
Choose the correct scope and detail level for a process map.
Choose an appropriate process mapping methodology.
Create a process map for a health care system (or system component) using correct symbols and conventions.
The most important thing to remember about process diagramming is that:
a process diagram is a model; one representation of a process;
there are multiple, often many valid representations from which to choose; and
all models are wrong; i.e., a model is a representation of reality, as such, it can never encompass reality, only the part represented in the model.
For example, a toy remote control car represents the shape, and maybe color, of the make and model after which it is fashioned. The toy also moves on wheels like the real car. However, there are many ways in which the toy is not an exact replica of the actual car. For one, it is smaller; secondly, the toy uses AA batteries for power. Another valid representation of the actual car would be a photograph or a set of engineering drawings.
A process diagram, like the toy car, picture, and engineering drawings, is only a model of the process that it represents. The analyst chooses the most appropriate diagram to represent the needed process aspects.
To sell the watch at auction, the picture on the right may be the most appropriate. However, to show the inner mechanical parts, the picture on the left is probably best. Similarly, to look for potential explosive and other harmful objects, airport security uses x-rays to view the contents of luggage and packages rather than video images of the outside of the bags. Importantly, each perspective, inner workings and outward appearance is a model of the actual item, each represents different aspects of the item.
In his book, Guide to Health Informatics, Enrico Coiera makes the distinction between models as abstractions of the real world versus models used as templates. For example, a photograph or painting is one model of a house. A set of drawings is a model of different aspects of the house and is also used for a different purpose, i.e., as a blueprint for building the house. The blueprint or model is used as a template from which more houses like the one it represents can be built. The abstraction – template distinction -- is based on how the model will be used.
Some process diagrams are used to visualize the sequence of tasks and to identify tasks that are inefficient. This is a process diagram used as an abstraction, i.e., a representation of the process that shows the aspects that can help us identify unnecessary or wasteful steps.
Other process maps are used as templates, for example
as part of software development. Using increasing levels of detail and specificity, analysts work with users and developers to elicit and document requirements that can be used by computers to generate computer programs or software to meet the requirements or
as part of process redesign. Process maps for changes or new processes can be used to guide the necessary workflow changes. In examples 1 and 2, the process maps document and model the requirements, and serve as “the holder of the knowledge.” Process maps can be updated as needed. The knowledge resides in the model that everyone understands, rather than in the computer code or in an individual’s mind, that few people understand.
This unit provides methods to document and preserve process knowledge.
A process is composed of tasks accomplished by both humans and machines. From cognitive science, we know that humans can perform both physical and mental steps or tasks. Further, we know that today, machines can only perform physical tasks, i.e., machines, even computers, cannot think like a human.
However, today we commonly use computers for information processing tasks. While the computer performs the physical manipulations on the information, interpretation and thinking remain the role of the human. Thus, humans interact with computers both in physical work flow and in information flow. Further, we make machines perform human-like tasks by reducing human thought into a set of conditions that a machine can recognize and a set of instructions that a machine can carry out under the conditions.
Process diagramming is complicated by the intertwined nature of humans and computers in information processing. One approach to dealing with this complexity is to use different representations of processes, some that concentrate on physical steps, others that concentrate on information flow, others that depict information content, and others that represent some aspect of thinking or decisions (sometimes called flow control), i.e., how different paths in the process are chosen.
Since the 1920’s (Juran, 1988) and maybe earlier, flowchart-like diagrams have been used as representations of processes. This is a vast oversimplification, though.
The fact is that there are many different aspects of both work and information processes that we may be interested in, for example:
the context in which the process operates,
process steps/tasks,
information flow,
the information content needed for the process,
how the information is altered through the process,
the sequence and other control of steps or tasks, and
the roles involved in the process.
Visually depicting a process first and foremost involves identifying the purpose of the process diagram, abstraction or template, that is, “why is the diagram needed?” Then identifying the aspect(s) of the process that we are interested in, and choosing a diagram or set of diagrams that emphasizes those aspects of interest and de-emphasizes, or completely eliminates (from view) the others. It is also important to determine the necessary level of detail. Then third, pick an appropriate style and notation to use.
There are several methods and notations for diagramming or mapping the clinical workflow processes, including: ISO 5807 information processing diagrams, (the same symbols used for flow charting); Yourdon notation for data flow diagrams; Gane-Sarson notation for data flow diagrams; Unified Modeling Language (UML) that represents several different aspects of processes; and Entity relationship (E-R) diagrams that concentrate solely on information content. These methods differ in notation used, and most importantly, the aspects of processes and information flow that each is designed to cover.
In this section, we will review the process aspects that each notation covers and show an example of each type of diagram.
The process aspects to be featured will determine the type of diagram to be used, i.e. the diagram that best represents the process aspects that you are interested in. The seven important process aspects are:
Context,
Process steps,
Information flow,
Information content,
Information transformation,
Sequence and other control, and
Who or what role performs the step.
The table on the following slide indicates which process aspects are covered by the notations or diagramming methods.
Note: The health care setting in which you work may have standardized on one particular notation or method for their process representation. Further, health care facilities may have participated in quality improvement or software development efforts, in which case, there may be existing process diagrams that may be of use to you. So, while you may prefer a particular method, and can select that method of use in this course, it is important to be aware of the major notations or methodologies, and to understand the basic uses and notation of each.
Unit 3 covers five notations that are commonly used to diagram processes: ISO 5807, Yourdon, Gane-Sarson, UML, and E-R diagrams. ISO 5807 can be used to represent process steps and their sequence and control, as well as information transformation and roles involved in the process. Yourdon represents context, process steps, and information transformation. Gane-Sarson represents the latter two process aspects. Unified Modeling Language, developed a few decades after and heavily influenced by the earlier methods, was designed to represent all but the Yourdon-style context diagram. The Entity-Relationship diagram is designed to represent only information content.
Eventually, you will need to contact a health care facility and set up an appointment to meet with a team to diagram the workflow process in that facility. After these instructions, pause the slides. Think through and list the steps required to contact the facility and set up the meeting. Using the basic flowchart symbols covered in part 1 of this presentation, create a simple process flowchart.
We suggest using MS Word, MS PowerPoint, or MS Visio to create your diagram – these are relatively inexpensive and widely available, however there are many other tools that could be used. Demonstrations are available on the Microsoft website and may be listed with your course materials.
Pause the slides and do the exercise now.
Not all of the process aspects noted earlier are critical for process analysis and redesign work covered here. For the health care workflow process analysis and redesign we recommend the following:
Yourdon – Data Flow Diagrams or
ISO 5807/Flowcharts – Process steps, step sequence and other control diagrams, as well as Roles performing the steps.
Yourdon Data Flow Diagrams and ISO 5807 flowcharts are covered in a separate unit. We recommend you review those thoroughly.
The primary slides that we have just reviewed provide the concepts and background for these diagrams and simple examples. In later units we provide more detailed instructions on how to create and use the diagrams. We will also provide additional symbols that are needed to diagram more complex processes.
Later units also cover the necessary diagrams and provides examples and practice for creating the Yourdon Data Flow Diagrams and ISO 5807 flowcharts.
The goal of workflow analysis and process redesign is to represent aspects of the process that help the analyst and health care facility staff identify areas where the process can be improved. The diagrams recommended here meet this need by concentrating on process steps data flow, roles, and visualizing the whole. There are other process aspects that are not critical to this analysis, and thus will not be considered.
Other efforts where these methods have been used to successfully analyze and redesign health care processes include the Public Health Institute’s Business Process Analysis and Redesign program, (Public Health Institute, 2006) to improve the performance of the US public health system. We strongly recommend that you review this reference.
The Robert Woods Johnson Foundation provided a grant to the Public Health Informatics Institute to improve the performance of the US Public Health System. As part of this effort, the Cabarrus Health Alliance (CBA) analyzed the process improvement through information technology introduction. This effort provides an excellent case study of using the methods described above to analyze and evaluate improvements in process and informatics for their Public Health Department (PHI, 2006).
This concludes Process Mapping Diagramming Tools lecture b.
You should be able to:
List the information generated or used in the process and the sequence of workflow steps when given a workflow process chart consisting of basic flow charting symbols
Read a scenario and use basic flowchart symbols representing the process steps and their sequence
Explain two ways process diagrams are used as models
Distinguish the physical steps from information flow in a health care process involving an EHR
Choose an appropriate process diagram to model given aspects of a process