The document summarizes the history of flooding in the Colusa Basin Watershed prior to flood management efforts. It describes how the Sacramento River would flood broad areas of the valley floor annually during high flows. Early private flood protection efforts failed due to their small scale and lack of coordination. The state later established swampland districts to organize larger, engineered projects but with limited success. Ultimately, a federal flood control project was needed to comprehensively address Sacramento River flooding in the watershed.

![Colusa Basin Watershed Assessment
Final
H. T. Harvey & Associates
15 December 2008
193
planned, and by engineers appointed by the Board of Swamp Land Commissioners, not by the
landowners.
But after 5 years of poor results under this program, the state legislature considered passage of
AB 591 that would dissolve the Board of Swamp Land Commissioners and pass the same
responsibility to the boards of supervisors of individual counties. Will S. Green of Colusa, is
credited with representing Colusa and Tehama counties in influencing the legislature to pass a
version of AB 591 in 1868: the Green Act or Green’s Land Act. According to Kelley (1989):
In his new legislation Green gave the Republicans’ “district” concept a revealing Democratic
twist: he radically localized it. That is, when purchasers of half or more of a tract of swamp and
overflowed land “susceptible of one mode of reclamation” – in practice, now, this simply meant
whatever land the group owned – wished to build protective levees, they needed only to petition
their local County Board of Supervisors for creation of a swampland district (which could be
limited, now, to a single piece of property), informing them of their desire “to adopt measures to
reclaim the same.” The board, in its turn, was to make certain that the lands to be included were
properly described, after which it had no choice but to authorize formation of the district. It no
longer possessed, in short, any authority to examine and approve, or disapprove, proposed levee
systems around the property, their alignment or nature, or whether they interfered with the
Valley’s natural drainage patterns…
Kelley (1989) lamented that:
. . . the result was that for the most of the next half-century, the Sacramento Valley would be
scissored into a crazy-quilt of small reclamation districts whose levees followed property lines,
not the Valley’s natural drainage pattern. Flood control anarchy, and therefore massive flood
control failure, would be the result.
He was correct that an early opportunity to exact a more comprehensive and physically sensible
flood control solution for the Sacramento Valley certainly had existed in the 1860s when
millions of contiguous acres of overflow and swamp lands were held by the State, an opportunity
that vanished with the passage of Green’s Land Act in 1868, which saw those millions of acres
pass into private landownership within just 3 years, in individual blocks as large as 250,000
acres. Practically, as Kelley lamented, this meant that the ultimate configuration of flood control
levees would not necessarily conform to the sinuous boundaries of natural drainage paths. And
some of the earliest private levees would block the most common sense ‘path of least resistance’
pathways for safely directing the inevitable Sacramento River overflows, those pathways where
there are today designated flood bypasses.
And flood control anarchy did ensue. As early as 1867 Colusa County dammed off Wilkins
Slough along the west bank of the river about 18 mi south of Colusa, but within a week of its
completion local people in the Wilkins Slough area destroyed it. This was just the beginning of
vigilante violence over flood control.
By 1870, Reclamation District [RD] 108 had been established and completed some 45 mi of
levee on the west bank of the Sacramento River from Knights Landing upstream to the vicinity
of Upper Sycamore Slough. The first levee was built 60 ft back from the river bluff and just 3-ft-
high, 1 ft above the highest river flood level known at the time. It closed 5 major sloughs (Upper](https://image.slidesharecdn.com/4c82b37c-7541-4a09-8822-29cd2458f66a-160709111313/85/Colusa_11_FloodMgmt-5-320.jpg)

![Colusa Basin Watershed Assessment
Final
H. T. Harvey & Associates
15 December 2008
195
Some 20 years after the Parks Dam controversy ended, Kelley (1989) quoted the Colusa Sun
commenting that “The landowners of 108 expect to be drowned out about two years in five.
They fight the water like heroes.”
After these years of continually struggling against the river and repairing the west bank levee,
one of RD108’s largest landowners and leading flood fighters, A. H. Rose, now State
Commissioner of Public Works, reported the state of affairs to governor Markham, as told by
Kelley (1989):
Looking out on the Sacramento Valley in 1895, a quarter of a century after he and his fellow
investors had launched RD 108, Commissioner Rose saw a discouraging scene. Vast sums of
money, he remarked in his first annual report to the governor, had been spent on levees, and much
of it had been wasted. The subject of flood control in the Sacramento Valley needed to be treated
as a whole, he said, but instead the Valley “is divided into several hundred [independent]
Reclamation Swamp Land or Protection Districts.” Some of them had natural boundaries, but
most were “arbitrarily bounded by property or other lines.” Each district was supreme so far as
the location and height of its levees were concerned, which in many cases they had built with no
attention whatever to their effects on anyone else or on the river, “the prime object being the
protection of the lands of their district according to the local objects to be obtained, which
generally means the construction of levees powerful enough to overtop or force a break on the
other side.” Quite out of their concern had been making certain that channelways were of
appropriate size, or that there was suitable outfall for floodwaters to flow down valley. How had
this happened? Reported Rose: “This unfortunate condition has been the direct outgrowth of the
policy of the State to sell lands prior to their reclamation by the State; or even to prescribe the
limits and locations of levees and drainage channels.”
Sacramento River Flood Chronology
1850 – January Two weeks of inundation damaged buildings within a mile from river in
Sacramento. Afterwards, first levee in the Sacramento Valley constructed,
entirely around the town of Sacramento.
1852 – March Caused Sacramento ring levee to fail and flooded Sacramento. Marysville also
flooded.
1852 – December Deeper inundation than January 1850. Entire valley south of Colusa under water.
Thousands of cattle drowned.
1853 – March Marysville was inundated 1 ft deeper than March 1852.
1860 – March flood
1861 – March widespread overflow in the flatlands
1861 – December part of “double-flood of 1861-1862 . . . lasting for more than a month…and far
exceeding anything people had earlier seen”
1862 – January “double-flood of 1861-1862 . . . The inland sea had rarely ever spread so widely
or had been so deep”](https://image.slidesharecdn.com/4c82b37c-7541-4a09-8822-29cd2458f66a-160709111313/85/Colusa_11_FloodMgmt-7-320.jpg)
![Colusa Basin Watershed Assessment
Final
H. T. Harvey & Associates
15 December 2008
196
1864 – December “heavy and pounding rains”
1866 – December Will S. Green: “Without doubt, more water passed down the valley [during the
flood] than ever before since its settlement by whites in the same length of time. .
. . One sheet of water more than 20 miles across was reported to cover the valley
floor between Marysville and Colusa. . . . The river tore out several large cuts in
its east bank, and torrents of water flowed out into the tule lands.”
1867 – February “‘one continuous body of water’ many miles across straddling the whole course
of the Sacramento River from above Colusa southward. . . from three to eight
miles wide on the west side of the river, perhaps half that area being covered on
the east.”
1867 – December “Colusa Sun reports that town and its environs were ‘now an island; above,
below, to the right and left is one vast sheet of water. Between town and the
Coast Range the water presents the appearance of an inland sea.’”
1868 – March “the area downriver from Colusa was experiencing the highest water it had ever
known. ‘The county … on either side,’ wrote Green, ‘is completely inundated.’”
(p.118)
1872 – January “Caused winter rains of December 1871 and early January 1872. From Colusa,
Green observed that “great oceans of water…are to be seen in every direction
from town” First edition of Parks Dam across the opening of Butte Slough was
destroyed by “masked men” that “overpowered the guards and cut the structure at
2 places between Butte Slough and the highlands bordering Sutter Buttes.” (p.
160); “The Sacramento River reached its highest mark at Colusa since American
Settlement.”
1874 – January “the rains continued, sweeping in from the southwest day after day, and the great
Sacramento River continued to swell” washing out the second construction of
Parks Dam.
1875 – January “an enormous deluge of storm waters in early January battered the Valley day
after day and produced a catastrophic flood” on the Yuba and Feather Rivers.
“…for many miles north and south of Colusa the Sacramento poured heavily
through openings on the east bank…”, causing failure of the third construction of
Parks Dam. (p. 169)
1875 – December “more disastrous flooding”
1876 – January RD70 levee on east bank of Sacramento River near the head of Butte Slough
failed and washed homes away in that district. District members subsequently
cut fourth construction of Parks Dam. (p.170)
1878 – February “the Sacramento, which had been running higher than ever before because of
debris in its bed, burst through a levee downstream from the city of Sacramento.”
(p. 181)](https://image.slidesharecdn.com/4c82b37c-7541-4a09-8822-29cd2458f66a-160709111313/85/Colusa_11_FloodMgmt-8-320.jpg)


![Colusa Basin Watershed Assessment
Final
H. T. Harvey & Associates
15 December 2008
201
The Ridge Cut provides an alternate gravity outlet for lower Colusa Basin floodwaters. It
reduces the duration of flooding, but it does not prevent flooding; when the Yolo Bypass stage is
high, the backwater effect can extend upstream as far as College City. This also creates an
additional backwater effect in the lower reaches of the Colusa Basin Drain (Navigant Consulting,
Inc. 2000).
By a 1937 agreement, the floodwater gravity drain outlet elevation of the Ridge Cut was set to
25.5 ft so that floodwaters, ponded in the valley basin lands between the Back Levee and high
ground to the west and south, pass unimpeded to the Yolo Bypass while sustaining a pool
sufficient for rediversion rights for irrigation with Colusa Basin Drain water entering the Ridge
Cut (DWR 1990).
Structural and Non-structural Projects for Relieving Residual Flooding Problems in the
Watershed
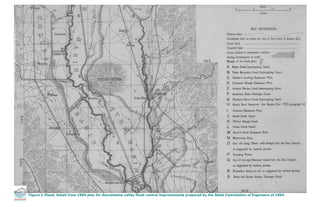
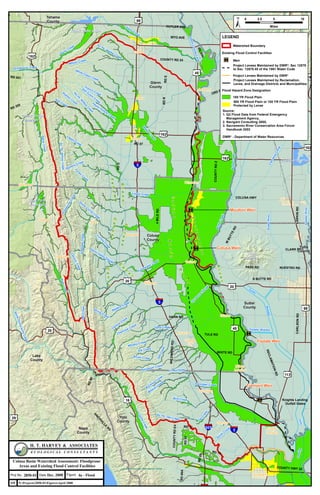
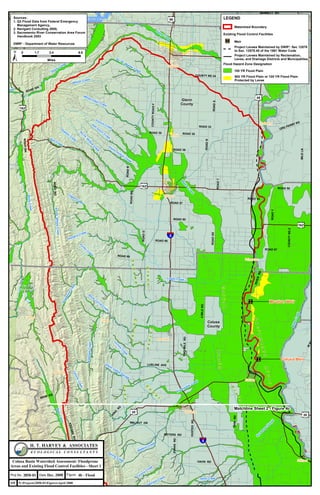
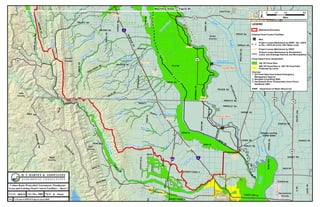
The current FEMA 100-year floodplain (Figure 4-Flood) shows that almost all of the
historically flooded lands of Colusa Basin Watershed would be flooded during a large flood
event with the Sacramento River Flood Control Project in place. The project generally prevents
Sacramento River flooding during less frequent floods. Black Butte Dam on Stony Creek has
eliminated the smaller historical contributions of Stony Creek floodwaters to the watershed north
of Willows, but there are substantial areas in the watershed that are subject to relatively frequent
flooding from the foothill streams. The FEMA 100-year floodplain map does not describe well
the pattern of more frequent flooding in the watershed. DWR (1962) produced a map of
“historically inundated areas” that seems to describe the pattern of the more frequent,
approximately 5-year floodplain.
Willows Area. The FEMA 100-year floodplain map (Figure 4-Flood) shows that several
foothill streams, including South Fork of Willow Creek, coalesce along a low, broad ridge of
land northwest of Willows. These combined flood waters inundate parts of Willows regardless
of stage in the Sacramento River or presence of flood overflows from the Sacramento onto the
valley flat lands. Alternatives for reducing the frequency and extent of flooding in this area are
currently being evaluated by the CBDD and USBR (CH2MHill 2003), and are summarized
below.
Residual Colusa Basin Flooding. DWR (1962) summarizes the typical pattern of routine
flooding occurring along the Colusa Basin Drain resulting from foothill streams runoff in the
winter and rice irrigation water releases in the summer:
Flood conditions, including those arising from poor drainage, impede agriculture and economic
development in portions of the Colusa Basin [Watershed]. Problems of flooding exist along
Willow Creek, along the Colusa Basin [Drain] and its tributary drainage channels, and in portions
of the Yolo Bypass below the Knights Landing Ridge Cut. These problems are caused by
improper and insufficient individual farm drainage, inadequate facilities to remove drainage from
low lying areas into the Colusa Basin [Drain] and other major drainage canals, insufficient
channel capacities of flood and drainage canals tributary to the Colusa Basin [Drain], and
inadequate discharge capacity of the Colusa Basin [Drain] into either the Sacramento River or the
Yolo Bypass.](https://image.slidesharecdn.com/4c82b37c-7541-4a09-8822-29cd2458f66a-160709111313/85/Colusa_11_FloodMgmt-13-320.jpg)
![Colusa Basin Watershed Assessment
Final
H. T. Harvey & Associates
15 December 2008
202
During the winter flood period, roughly October through March, floods are caused by
precipitation within the [watershed] and runoff from the foothill region to the west. The
magnitude of the discharge in these winter storms is very large when compared with the channel
capacity of the Colusa Basin [Drain]. The channel capacity in the upper reaches, for example, is
exceeded when the discharge at Highway 20 near Colusa is greater than 2,100 second-feet. The
maximum mean daily discharge of record occurred on February 21, 1958, and was 23,900
second-feet at that point. Because the channel is inadequate to handle the discharge, the excess
flows flood an extensive area along the channel. In 1958, the flooded area extended continuously
from Knights Landing to Orland, a distance of 70 miles. The flooded areas are frequently large at
this time of year, but the damages are relatively light since the lands inundated are principally
agricultural and idle during the winter. Highways, roads, and public utilities, as well as the
limited urban or domestic development within the floodplain are subject to damage.
In the spring months, April through June, flooding is caused principally by irrigation return flows
rather than by precipitation. During the spring, precipitation is generally insignificant. The
channel capacity of the Colusa Basin [Drain] is usually adequate to handle the irrigation return
flows, except in the reach between College City and Knights Landing where flooding of a small
area occurs regularly. The resulting damages are large since this flooding occurs in the normal
growing season. This spring flooding results from local agricultural practices which cause
irrigation return flows that cannot be dissipated by works constructed to relieve winter flood
conditions.
According to DWR (1962), releases of water from rice fields typically peaks in May when high
stage also typically prevails in the Sacramento River. This prevents the released water from
draining though the Outfall Gates, and the outlet of the Knights Landing Ridge Cut is also
backed up or otherwise inadequate to pass the released water. There is presumably less summer
flooding along the Colusa Basin Drain today than there was at the time of DWR’s (1962)
characterization of the problem, as would have the resulted from better coordinated releases.
In addition, land has been put into agricultural production up to the western edge of the Colusa
Basin Drain [canal], and the levees have been built along the western edge of the canal to protect
agricultural lands. These levees may act to constrict the canal’s capacity and thereby
incrementally raise the canal water surface elevation in places. DWR (1962) reported that
between 1 April and 1 June in 15 of the last 40 years, water has overflowed the banks of the
drainage canal between College City and Knights Landing.
DWR (1962, 1964) prepared hydraulic models of the Colusa Basin Drain channel to serve as a
basis for evaluating the flood benefits in terms of reduced inundation area resulting from a range
of management actions: (1) improved drainage facilities from the Knights Landing Ridge Cut
through the Yolo Bypass, (2) systems of levees along the Colusa Basin Drain, (3) flood control
reservoirs in the western foothills, and (4) watershed management. DWR (1990) updated the
evaluation of these alternatives, many of which are still under consideration, and added a fifth
evaluation of enlarging the Knights Landing Ridge Cut.
Yolo Basin Project. DWR (1962) evaluated the flood management benefits for the lower
backwater affected reaches of the Colusa Basin Drain of constructing a new 10,000-ft-long
unlined 130-ft-wide trapezoidal drainage canal in the Yolo Basin from the outlet of the Knights
Landing Ridge Cut downstream to the Tule Canal and comparably enlarging Tule Canal by](https://image.slidesharecdn.com/4c82b37c-7541-4a09-8822-29cd2458f66a-160709111313/85/Colusa_11_FloodMgmt-14-320.jpg)
![Colusa Basin Watershed Assessment
Final
H. T. Harvey & Associates
15 December 2008
203
addition of 15,300-ft-long levees. DWR (1962) concluded that the project was economically
justified (cost-benefit ratio of 1.34:1) even though most of the benefits would accrue to
landowners on the downstream end of the watershed. DWR (1990) reevaluated the Yolo Basin
Project as having a total project cost of about $8 million, and a 50-yr period cost-benefit analysis
of the project at an 8.875% discount rate yielded an updated cost-benefit ratio of 0.25. The
reduced cost-benefit ratio compared to DWR (1962) is due to new water quality concerns and the
estimated $5 million additional project cost introduced by the need to extend the North Bay
Aqueduct’s Barker Slough Pumping Plant intake to Miner Slough.
Enlarge Knights Landing Ridge Cut. DWR (1990) evaluated various alternative methods and
configurations for increasing the conveyance capacity of the Ridge Cut, including a range of
design channel base widths up to 1400 ft. DWR (1990) found that the conveyance capacity
could be increased by 7300 cfs at a cost of about $12 million. Fifty-year period cost-benefit
analysis of the project at an 8.875% discount rate yielded an updated cost-benefit ratio of 0.15.
DWR (1990) noted that the evaluated alternative included removal of the heavily vegetated
existing islands, the environmental impacts of which would be controversial.
Colusa Basin Drain Levees. First, DWR (1962, 1964) considered the potential benefits of
constructed new and/or enlarged levees along the existing Colusa Basin Drain to create a
maximum channel top width of 450 to 1,000 ft. The levees would range from 18-ft-high in the
south to 11-ft-high in the north and would, for example, provide for 27,000 cfs conveyance
capacity at the Highway 20 crossing. Pumping stations and flap gates would be used to drain
floodprone areas. Cost-benefit analysis of the 50-year protection level project indicated that the
levee project was not economically justified, yielding ratio of 0.33 at a 4% interest rate.
DWR (1990) reevaluated the levee project, estimating it then to cost $76 million for protecting
180,000 acres. Fifty-year period cost-benefit analysis of the 100-year protection level project at
an 8.875% discount rate yielded an updated cost-benefit ratio of 0.19. The levee protection
alternative has generally been abandoned in favor of projects that use reservoirs on the foothill
streams to detain floodwaters.
Foothill Reservoir Project. DWR (1962) evaluated the potential benefits of constructing flood
detention reservoirs on 17 foothill streams, finding it a generally less desirable solution to
flooding problems than building levees along the Colusa Basin Drain. DWR (1990) reevaluated
the project considering 29 moderate-sized reservoir sites at total cost of $82 million. Seven of
the 29 sites ranked highest on a cost per square mile drainage area controlled basis: South Fork
Willow Creek, Logan Creek, Hunter Creek, Funks Creek, Stone Corral Creek, Freshwater Creek,
and Cortina Creek (generally the larger foothill subwatersheds). These 7 reservoirs were
estimated to cost about $27 million. Fifty-year period cost-benefit analysis of the seven reservoir
project alternative at an 8.875% discount rate yielded a cost-benefit ratio of 0.65. DWR (1990)
found in general that “the limited runoff of Westside tributaries makes it unlikely that significant
water supply or recreation benefits could be developed in a multiple-purpose reservoir.”
The Colusa Basin Drainage District [CBDD] resumed evaluation of alternatives including
different numbers and combinations of 14 foothill reservoirs as part of comprehensive flood
control and watershed management alternatives (Navigant Consulting, Inc. 2000).](https://image.slidesharecdn.com/4c82b37c-7541-4a09-8822-29cd2458f66a-160709111313/85/Colusa_11_FloodMgmt-15-320.jpg)
![Colusa Basin Watershed Assessment
Final
H. T. Harvey & Associates
15 December 2008
204
Watershed Management. DWR (1962) did not evaluate the potential benefits of watershed
management due to lack of data about the existing conditions of the foothill subwatersheds. As
discussed below in this section of the assessment, the CBDD is presently considering watershed
management and other non-structural flood reduction measures as part of comprehensive flood
control and watershed management project alternatives (Navigant Consulting, Inc. 2000).
Local Flooding Problems Associated with Transportation Infrastructure. Road and railroad
crossings do not always provide sufficient flood conveyance capacity. Moreover, because most
of the crossings are not clear-span bridge decks, they are prone to partial to near complete
blockage with vegetation and debris floated from upstream, including large woody debris
transported by floods from upper watershed areas.
Ongoing Efforts to Reduce Residual Flooding
Many of the project alternatives generally evaluated by DWR (1962, 1964, 1990) have not been
implemented due to cost-benefit ratios and other reasons, but continue to be reevaluated in the
changing planning and economic context.
Most recently, CBDD has evaluated feasibility of constructing stormwater detention reservoir
facilities on two foothill streams in the northern part of the watershed. The South Fork Willow
Creek Detention Facility is completely designed and has a construction bid packet ready for
distribution should the CBDD secure adequate funds to construct (Gene Massa, CBDD, pers.
comm., May 2007). CBDD has all permits secured to construct except the Army Corp's 404(b)
permit. The CBDD has not yet completed the feasibility study for the proposed Wilson Creek
Detention Facility. The CBDD has completed studies identifying other project sites in Glenn
and Colusa Counties targeted for remediation measures including, but not limited to detention
facilities.
Residual Colusa Basin Flooding. Navigant Consulting, Inc. (2000) evaluated alternatives for
the Integrated Resourced Management Plan [IRMP] for Flood Control proposed by the CBDD
and USBR. This flood control program and associated programmatic EIR/EIS included
structural measures composed of up to 14 stormwater detention reservoirs at foothill stream
subwatershed outlets of most of the 32 ephemeral and intermittent streams draining the Eastern
Slope of the Coast Range foothills across the watershed flatlands. The feasibility-level designed
detention facilities would improve flood control and supplement water supply for multiple uses,
including groundwater recharge on the valley flats and incidental habitat enhancement provided
by using streams as conveyance facilities from the foothill reservoirs to the groundwater
recharge area on the lower fan areas and valley flats.
Willows Area Flooding. CH2MHill (2003) then prepared a project-specific EIR for the
CBDD’s Integrated Watershed Management Plan [IWMP]. This plan tiers off of the previous
watershed-wide IRMP (Navigant Consulting, Inc. 2000) and evaluates alternatives to reduce
flooding in the vicinity of Willows (and presumably, to some extent, also reducing flooding
south of Willows in areas receiving commingled floodwaters). This watershed-scale analysis
evaluated the flood management benefits and other effects of various structural and non-
structural flood control measures. While the analysis was specific to the Willow Creek and](https://image.slidesharecdn.com/4c82b37c-7541-4a09-8822-29cd2458f66a-160709111313/85/Colusa_11_FloodMgmt-16-320.jpg)