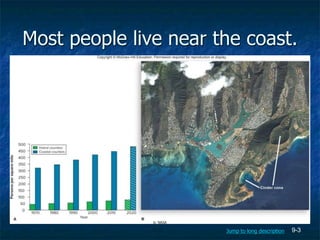
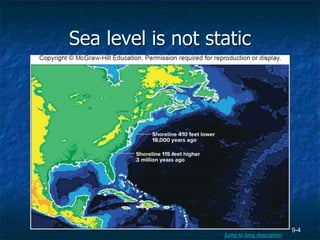
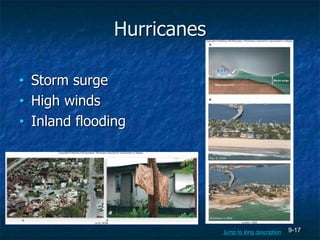
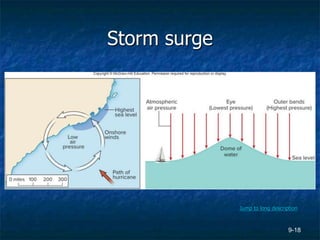
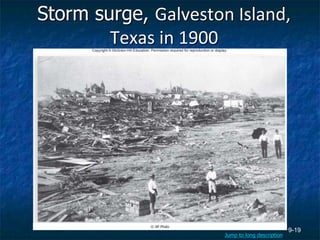
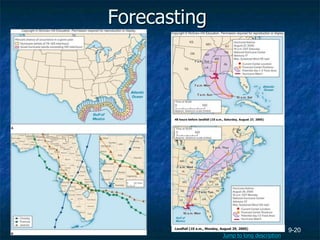
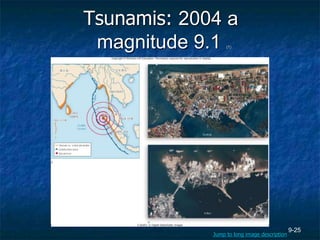
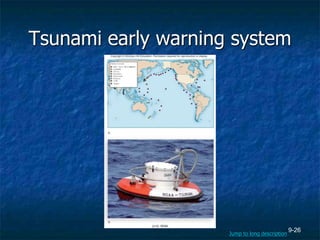
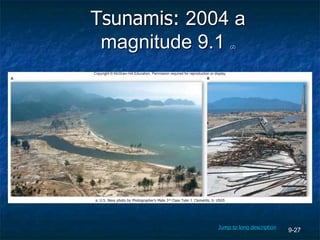
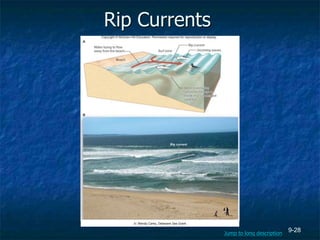
20. 9-20
Forecasting
48 hours before landfall (10 a.m., Saturday, August 27, 2005)
Landfall (10 a.m., Monday, August 29, 2005)
Jump to long description
23. 9-23
Mitigating Storm Hazards (1)
• Avoid building in areas of high % landfall
• Better forecasting and early warning
• Good emergency planning
Jump to long description
34. 9-34
Mitigating Effects of Shoreline
Processes (4)
South Amelia Island, Florida
Photo by Elizabeth Pendleton/Woods Hole Science Center, USGS
Jump to long description
36. 9-36
Most people live near the coast. Long Description
Plot (A) showing how population density in the United States is much higher in coastal counties, and
continues to increase. Satellite image (B) showing highdensity development near Hanauma Bay on
the Hawaiian island of Oahu. Note how development is concentrated on low-lying terrain closest to
the shore and in valleys leading to the sea. These areas make better construction sites compared to
the surrounding rugged terrain. Also note the extinct cinder cones, one of which has been breached,
forming a small bay.
Jump back to slide containing original image
37. 9-37
Sea level is not static Long Description
Climate change and the transfer of water between the oceans and glacial ice over the past 3 million
years have led to large fluctuations in global sea level and dramatic changes in the positions of
shorelines. Sea level worldwide had been rising at a rate of 0.6 feet (0.2 m) per century since 1900,
but recent measurements indicate that the rate has increased to nearly 1.0 feet (0.3 m) per century
due to global warming. Sea-level rise could accelerate more dramatically should the warming
destabilize the ice sheets on Greenland and Antarctica.
Jump back to slide containing original image
38. 9-38
Leading-edge and Trailing-edge
Coastlines Long Description
Tectonically active continental margins typically have steep terrain that produces irregular shorelines
where beaches are commonly restricted to coves. On continental margins where tectonic activity is
minimal, shorelines generally have broad, straight beaches and low-lying terrain that extends far
inland.
Jump back to slide containing original image
39. 9-39
Coastal Processes Long Description
Earth’s oceans bulge outward because of forces created by the planet’s spinning motion and
gravitational interaction with the Moon and Sun. Ocean tides form as the Earth rotates so that points
on its surface move with respect to the bulges within the oceans. Note that the Moon has a greater
tidal influence because it is much closer to the Earth than the Sun. The maximum tides, called spring
tides, occur when the Moon and Sun align such that their gravitational effects reinforce each other.
Jump back to slide containing original image
40. 9-40
Waves (1) Long Description
As wave energy travels horizontally through water, water molecules move in circular paths that get
progressively smaller with depth. The level at which all movement stops, called wave base, gets
deeper with increasing wave energy. Floating objects do not move horizontally with a passing wave,
but rather bob up and down due to the motion of the water molecules.
Jump back to slide containing original image
41. 9-41
Waves (2) Long Description
As waves enter shallow water, wave base will eventually meet the seafloor, creating friction that
causes the waves to slow down. This, in turn, causes the wavelength to decrease as the waves grow
in height and become less symmetrical. Eventually the waves become so asymmetric that they fall
over on themselves and form breaking waves
Jump back to slide containing original image
42. 9-42
Wave Refraction & Longshore CurrentsLong Description
As a wave approaches land, the end closest to shore encounters the seafloor first, forcing it to slow
down while the other end travels at its original velocity. This velocity difference causes the wave to
bend or refract toward shore. Breaking waves push water up the beach, creating a zigzagging path
as the water flows back into the surf zone. This process is important as it causes sediment to drift
parallel to shore. Wave refraction also forces water to flow parallel to shore in what is known as a
longshore current.
Jump back to slide containing original image
43. 9-43
Shoreline Evolution (1) Long Description
Headlands are places where waves first make contact with land and have the greatest amount of
energy; hence, erosion is high at these locations. As the waves refract around both sides of the
headlands, eroded material is transported into coves via longshore currents and deposited, forming
isolated beaches.
Jump back to slide containing original image
44. 9-44
Shoreline Evolution (2) Long Description
Once tectonic activity ceases, irregular coastlines slowly evolve into trailing-edge shorelines with
more low-lying terrain and broad, straight beaches. Initially waves break on headlands, forming
longshore current cells that transport eroded material into coves. As the headlands become smaller,
the beaches and longshore cells eventually merge, forming relatively straight sections of beach
where sediment is transported parallel to shore.
Jump back to slide containing original image
45. 9-45
Barrier Islands Long Description
a) Shoreline retreat on barrier islands primarily occurs during storms when sea level increases and
sediment is more easily transported over the island by wind and waves, allowing the islands to
essentially roll over on themselves.
b) Barrier islands are elongated sediment deposits separated from the mainland by open water or
wetlands. Tides move sand within inlets in an oscillating manner, creating submerged ebb-tidal
and flood-tidal deltas. The islands themselves are highly prized locations for development
because of their wide sandy beaches, but their low elevation makes them vulnerable to being
overwashed during major storms.
Jump back to slide containing original image
46. 9-46
Coastal Hazards & Mitigation Long Description
Cyclones, hurricanes, and typhoons (A) are different terms used to describe large, rotating storm
systems that originate over warm tropical waters. These storms generally follow curved paths toward
higher latitudes and can produce winds in excess of 150 miles per hour and dump torrential amounts
of rain, wreaking havoc on coastal areas. Satellite image (B) showing Hurricane Katrina prior to
making landfall in Louisiana and Mississippi in 2005.
Jump back to slide containing original image
47. 9-47
Hurricane Long Description
Hurricanes (A) form around low-pressure disturbances as evaporation removes heat energy and
water from tropical waters. The resulting convection combined with Earth’s spinning motion produces
a rotating storm system with an area of low pressure in the center, or eye. Intense winds, rains, and
wave action cause major damage to coastal areas. Radar image (B) of Hurricane Irene in 2011,
showing spiral bands of heavy precipitation rotating around the eyewall.
Jump back to slide containing original image
48. 9-48
Hurricanes Long Description
a) This neighborhood (A) near Miami, Florida, experienced extreme damage from the 145-mile-per-
hour winds produced by Hurricane Andrew in 1992. A piece of lumber (B) driven through a tree
during Andrew demonstrates the destructive power of airborne debris.
b) Storm surge (A) not only inundates areas normally above high tide, but also brings breaking
waves that demolish structures. Photo (B) of Mantoloking, New Jersey, showing the effects of
storm surge and waves associated with Hurricane Sandy in 2012. Arrows mark the same house
that appears in both images. Notice the destroyed houses and roads and extensive beach
erosion. Also note the large volume of sand that was deposited on the back side of the island.
Jump back to slide containing original image
49. 9-49
Storm surge Long Description
Storm surge forms in part because of the decrease in air pressure toward the eye of a hurricane.
This allows the sea surface to rise, creating a dome of water that follows the storm inland. Even
higher storm surge is generated on the northeastern side of the eye due to the storm’s
counterclockwise rotation and intense winds.
Jump back to slide containing original image
50. 9-50
Storm surge, Galveston Island, Texas in
1900 Long Description
In 1900 a storm surge from a category 4 hurricane swept over Galveston Island, Texas, killing an
estimated 6,000 to 10,000 people in a city of 35,000 residents. Photo showing the pile of debris that
formed as breaking waves progressively destroyed city block after city block. Open ocean is to the
right in the photo.
Jump back to slide containing original image
51. 9-51
Forecasting Long Description
A. Yellow areas show the percent probability of a moderate hurricane (category 1 to 2) striking sections
of the U.S. coast in a given year. Red shows the chance of a major strike (category 3 to 5).
B. Because strike probabilities are statistical, multiple strikes are possible in a single year, as was the
case in South Florida in 2004 when three hurricanes struck the same region.
Computer models can accurately predict the path of a hurricane, as illustrated by these three-day
forecasts for Hurricane Katrina in 2005. The projected path takes the shape of a cone because the
storm’s position becomes less certain as distance from the eye increases. The center line within the cone
represents the most likely position at any given time. Note how the 48-hour forecast of where Katrina
would make landfall was very close to the actual location.
Jump back to slide containing original image
52. 9-52
Frequency of Hurricanes Long Description
Histogram showing the frequency of hurricanes (blue) and tropical storms (red) in the Atlantic since
1950. There has been an increase in the number of storms, but it is not yet clear if this trend is due
to global warming or natural oscillations. Model projections indicate that hurricanes may not become
more frequent, but will produce more rainfall and be more likely to develop into powerful category 4–
5 storms. Insurance companies and emergency managers are concerned that hurricane activity may
be entering a more active and dangerous phase.
Jump back to slide containing original image
53. 9-53
Hurricane Katrina Long Description
Map showing the intensity of 2005 Hurricane Katrina in terms of wind speed. Note how the storm
developed into a category 5 hurricane, but then weakened into a category 3 to 4 just before making
landfall.
(B) taken before and after Hurricane Katrina.
Jump back to slide containing original image
54. 9-54
Mitigating Storm Hazards (1) Long Description
In addition to being damaged by airborne debris, buildings can be destroyed when a hurricane’s high
winds blow over and through a structure, which increases the amount of vertical lift on the roof such
that it is removed.
Jump back to slide containing original image
55. 9-55
Mitigating Storm Hazards (2) Long Description
Structural damage from hurricanes can be greatly reduced by elevating a building above the storm
surge so that wave energy can freely pass underneath. Boarding up windows and strapping the roof
and frame help keep the roof from being lifted off the structure. The building can be strengthened
further by anchoring the frame to the underlying structure.
Jump back to slide containing original image
56. 9-56
Tsunamis: 2004 a magnitude 9.1 (1) Long Description
In 2004 a magnitude 9.1 earthquake off the Indonesian coast (A) generated a tsunami that swept
across the Indian Ocean, killing an estimated 225,000 people. Before and after photos (B) of the city
of Banda Aceh, which was the closest to the epicenter, provide a dramatic testament to the
devastating power of the waves.
Jump back to slide containing original image
57. 9-57
Tsunami early warning system Long Description
Map (A) showing the location of buoy and bottom sensor stations that are part of the tsunami early
warning systems in the Pacific and Indian oceans. Photo (B) showing one of the stations operated by
the United States. Each station consists of a buoy connected to a bottom sensor; the stations are
designed to detect passing tsunami waves and then relay an alert to land-based centers via satellite.
Jump back to slide containing original image
58. 9-58
Tsunamis: 2004 a magnitude 9.1 (2) Long Description
Aerial view (A) of Indonesia’s coastline where towns and villages once stood, but were obliterated by
the 2004 tsunami. Development along this rugged coastline was concentrated on small strips of level
ground adjacent to the sea. Notice in the photo how the shape of the shoreline would have helped
funnel the waves, thereby increasing the wave height. Photo at ground level (B) illustrating how the
powerful waves ripped buildings off their foundations, leaving only the foundations themselves and
steel-reinforcing rods that were once embedded in concrete walls.
Jump back to slide containing original image
59. 9-59
Rip Currents Long Description
Rip currents (A) form when backwash from the surf zone funnels through a break in underwater sand
bars. Photo (B) showing a rip current flowing back out to sea through the surf zone in the Monterey
Bay area of California. Note that the rip current can be recognized by how it disrupts breaking waves
within the surf zone.
Jump back to slide containing original image
60. 9-60
Dauphin Island near Mobile Bay,
Alabama Long Description
Photo sequence of Dauphin Island near Mobile Bay, Alabama, showing how shoreline retreat occurs
in pulses during major storm events. As the island retreats, homes become closer to the surf zone.
Note in the bottom photo the missing homes and the oil rig that came ashore during the storm.
Jump back to slide containing original image
61. 9-61
Mitigating Effects of Shoreline Processes(1) Long Description
Seawalls (A) are physical barriers designed to keep waves from impacting areas landward of the
shoreline. Over time, waves reflecting off the seawall will cause the beach to be redeposited
offshore. As shown in the photos of Jekyll Island, Georgia (B), this movement of sediment ultimately
results in the beach being present only during low tide.
Jump back to slide containing original image
62. 9-62
Mitigating Effects of Shoreline Processes(2) Long Description
Groins are built perpendicular to shore in order to trap sand moving with the longshore current. As
the beach widens on the up-drift side of a groin, shoreline retreat is reduced. Note however that
beaches down-drift become starved, causing shoreline retreat to accelerate there.
Jetties normally come in pairs and are placed at the mouths of inlets to help keep the longshore
movement of sand from clogging navigational channels. This unfortunately also causes down-drift
areas to experience rapid shoreline retreat as beaches become starved of sand.
Jump back to slide containing original image
63. 9-63
Mitigating Effects of Shoreline Processes(3) Long Description
A breakwater is a barrier placed just offshore and used to keep waves from directly impacting the
shoreline. Although effective in reducing erosion and providing a quiet area for mooring boats, a
breakwater also disrupts the longshore current and creates unwanted deposition behind the structure
and increased erosion in down-drift areas.
Jump back to slide containing original image
64. 9-64
Mitigating Effects of Shoreline Processes(4) Long Description
Beach nourishment involves removing sand from offshore deposits and spreading it on an eroding
beach. Although expensive, this is often the only solution for bringing back a recreational beach in
areas of chronic erosion. Olsen Associates, Inc.
Aerial view showing the Cape Hatteras Lighthouse on the Outer Banks of North Carolina shortly after
it was moved in 1999. The historic lighthouse was moved inland to a safer location as shoreline
retreat had progressed to where the structure was at the edge of the active beach. Note the groin
that had previously been installed to widen the beach in front of where the lighthouse once stood.
Jump back to slide containing original image