Download to read offline


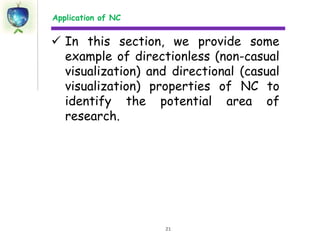


This document discusses mapping and visualizing the core of scientific domains using social network analysis techniques. It introduces the concept of a "Network of the Core" (NC) to represent relationships between theoretical constructs, models, and concepts. NCs can be directional, showing causal relationships, or directionless, showing general connections. NCs can reveal hidden characteristics of a research domain like central constructs. The document demonstrates directional and directionless NCs for information systems research domains. NCs help conceptualize domains, identify missing links, and explore research opportunities. Future work should construct more detailed NCs to analyze research domain structures.