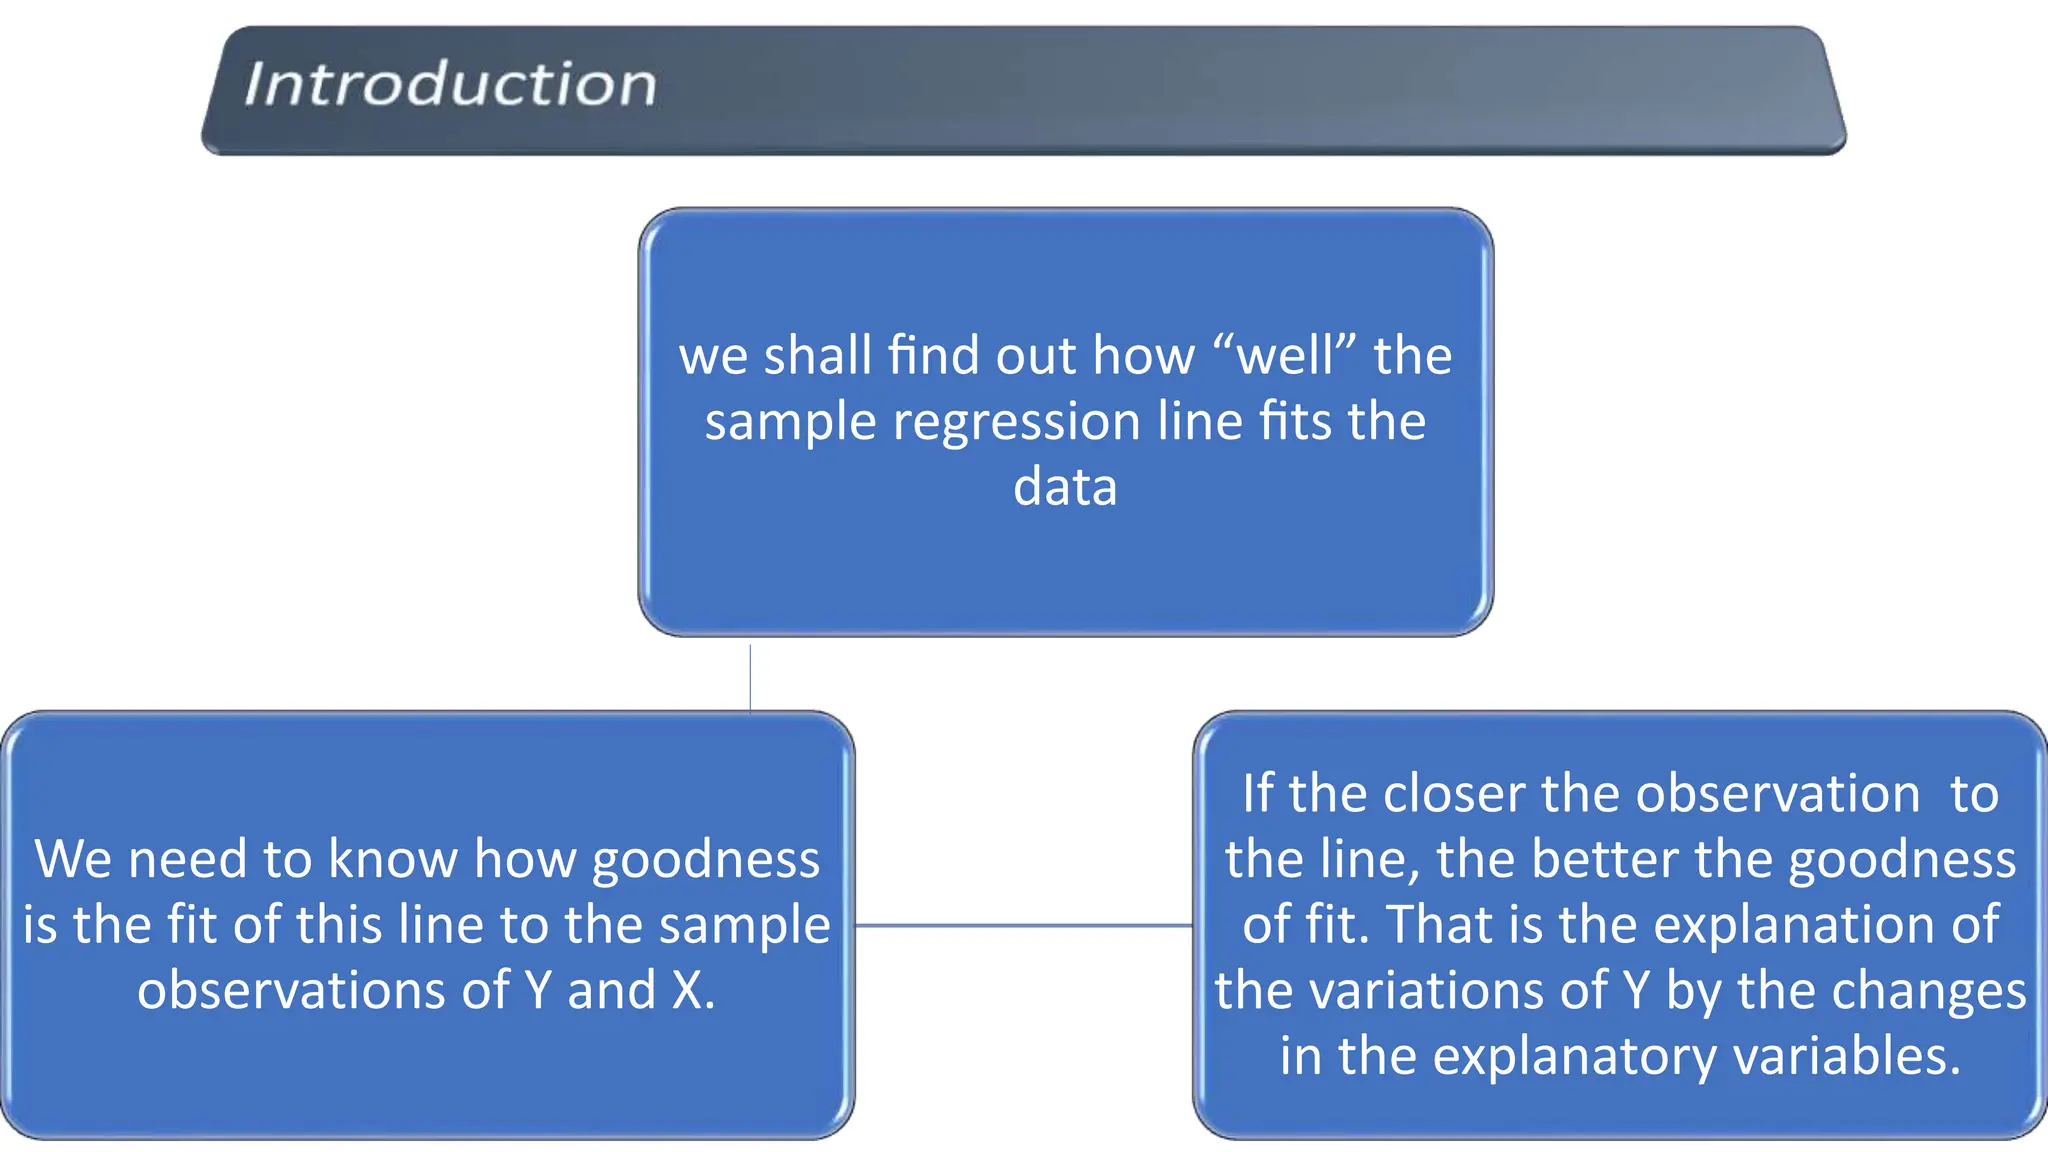
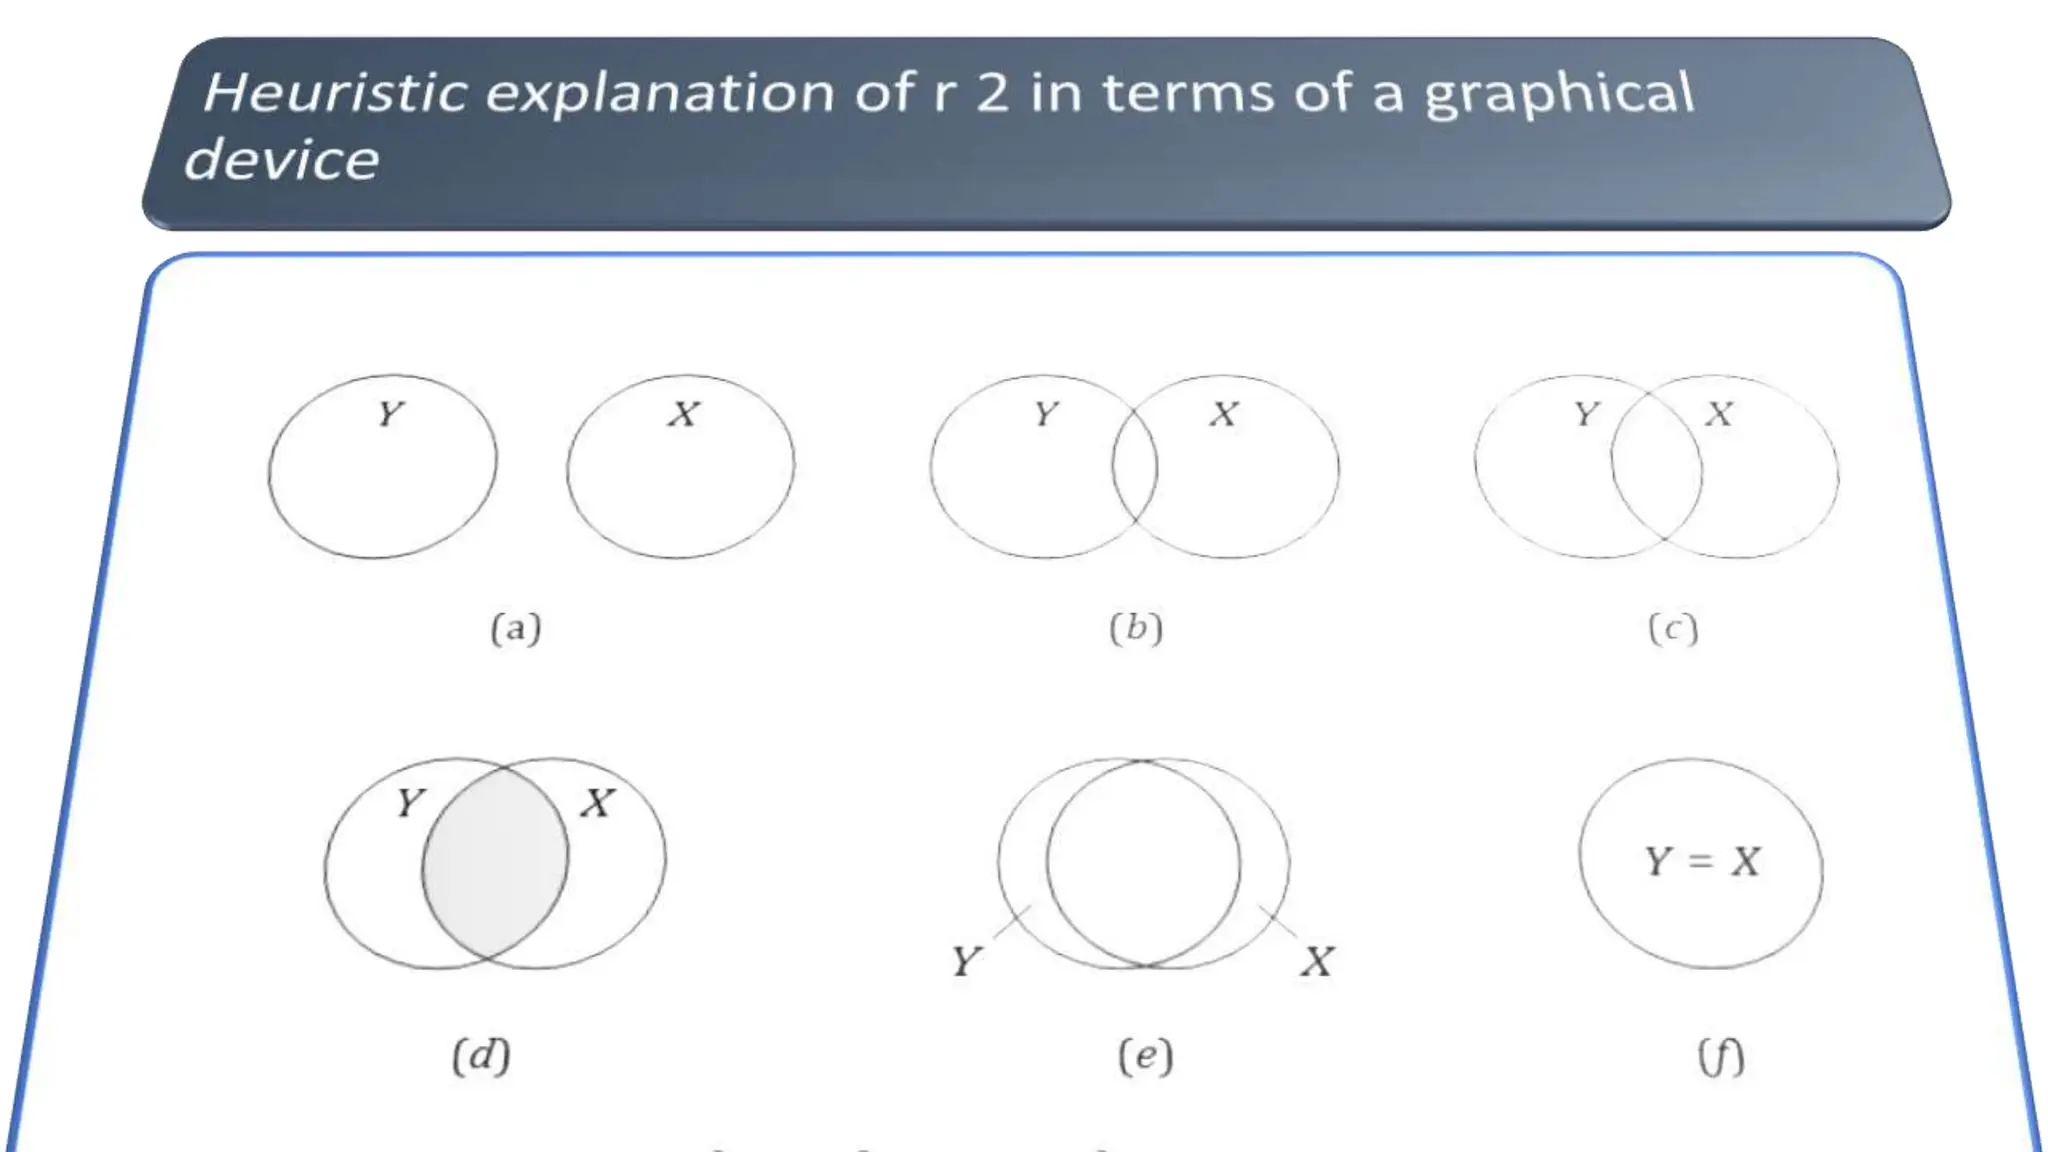
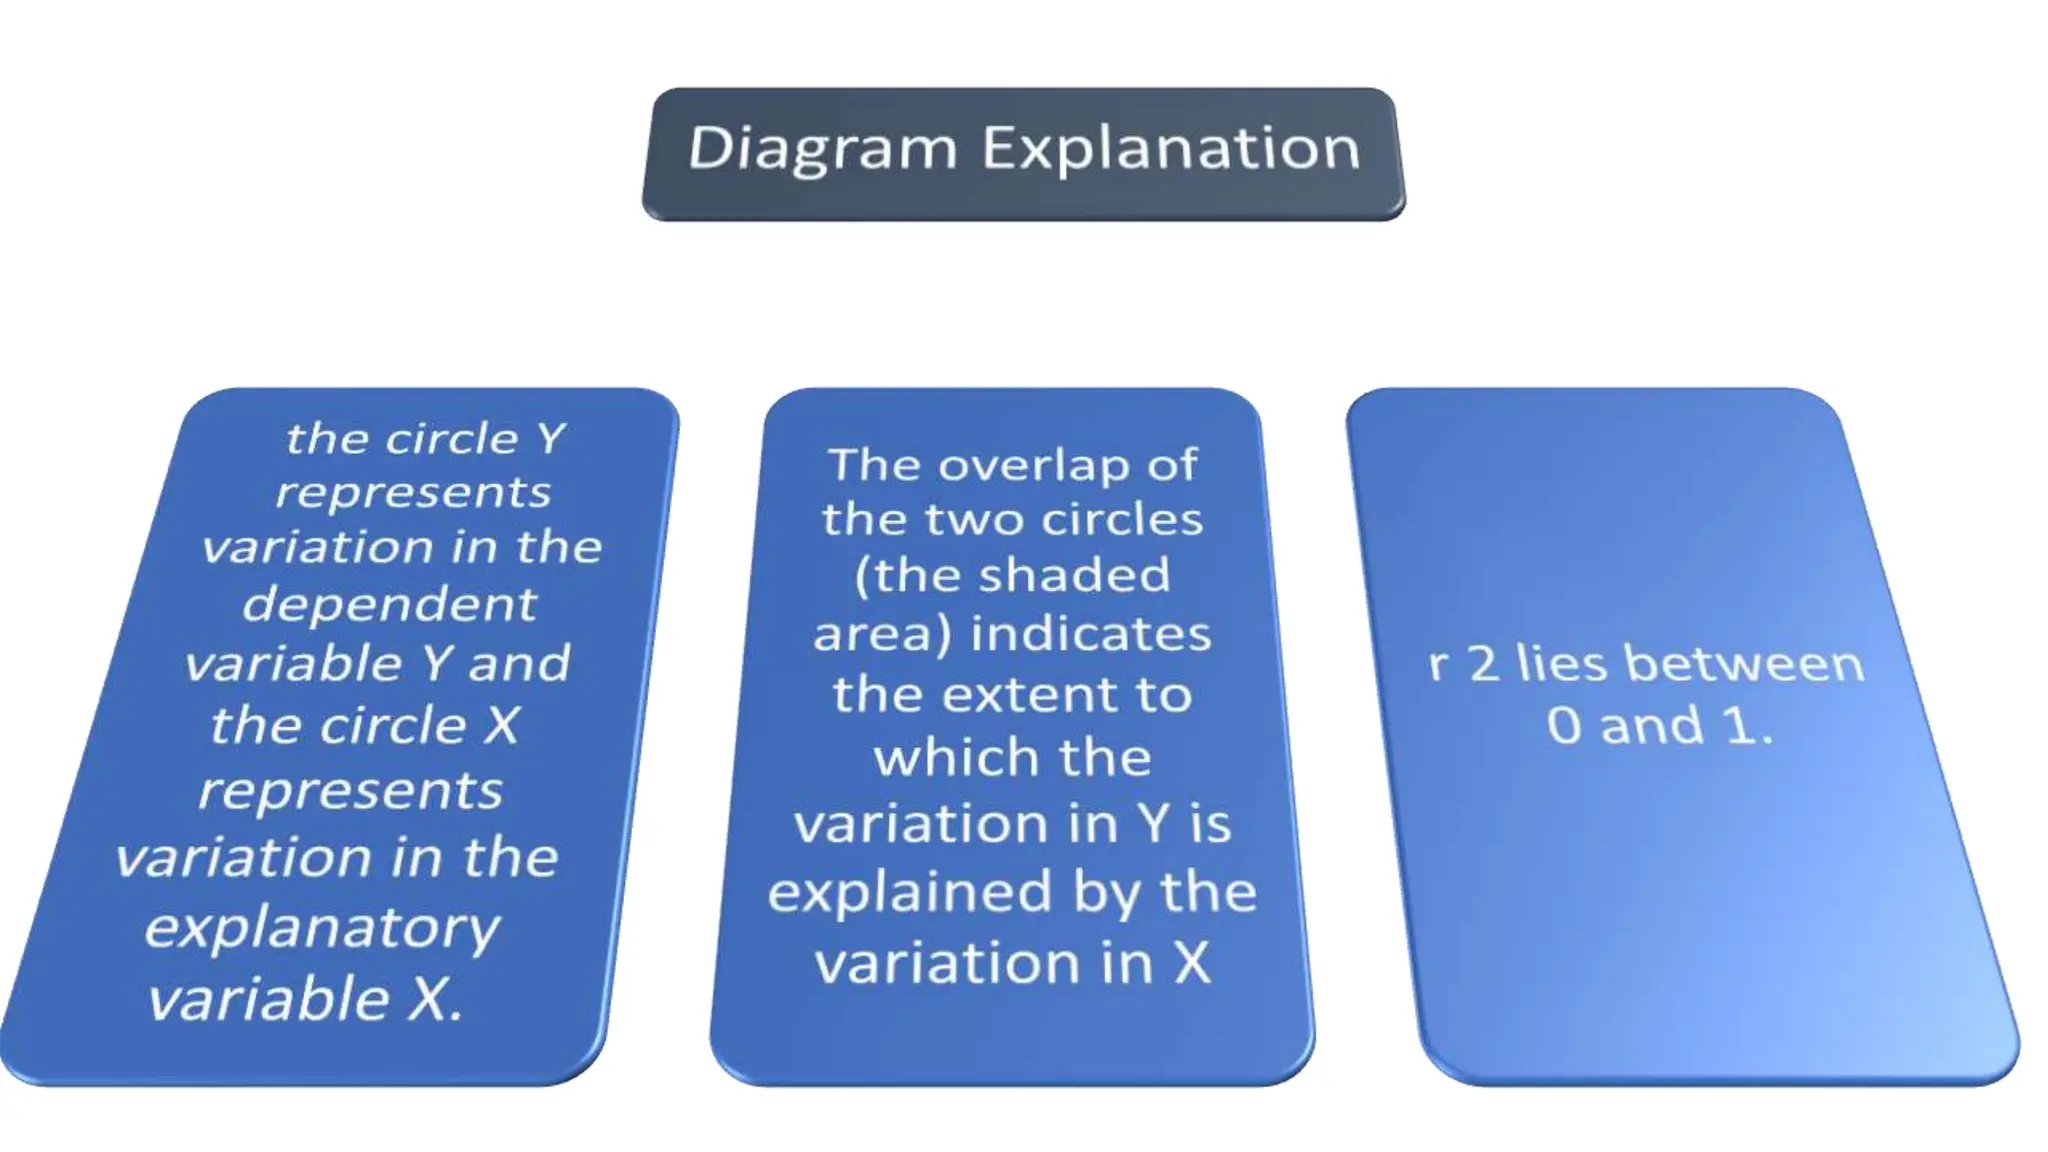
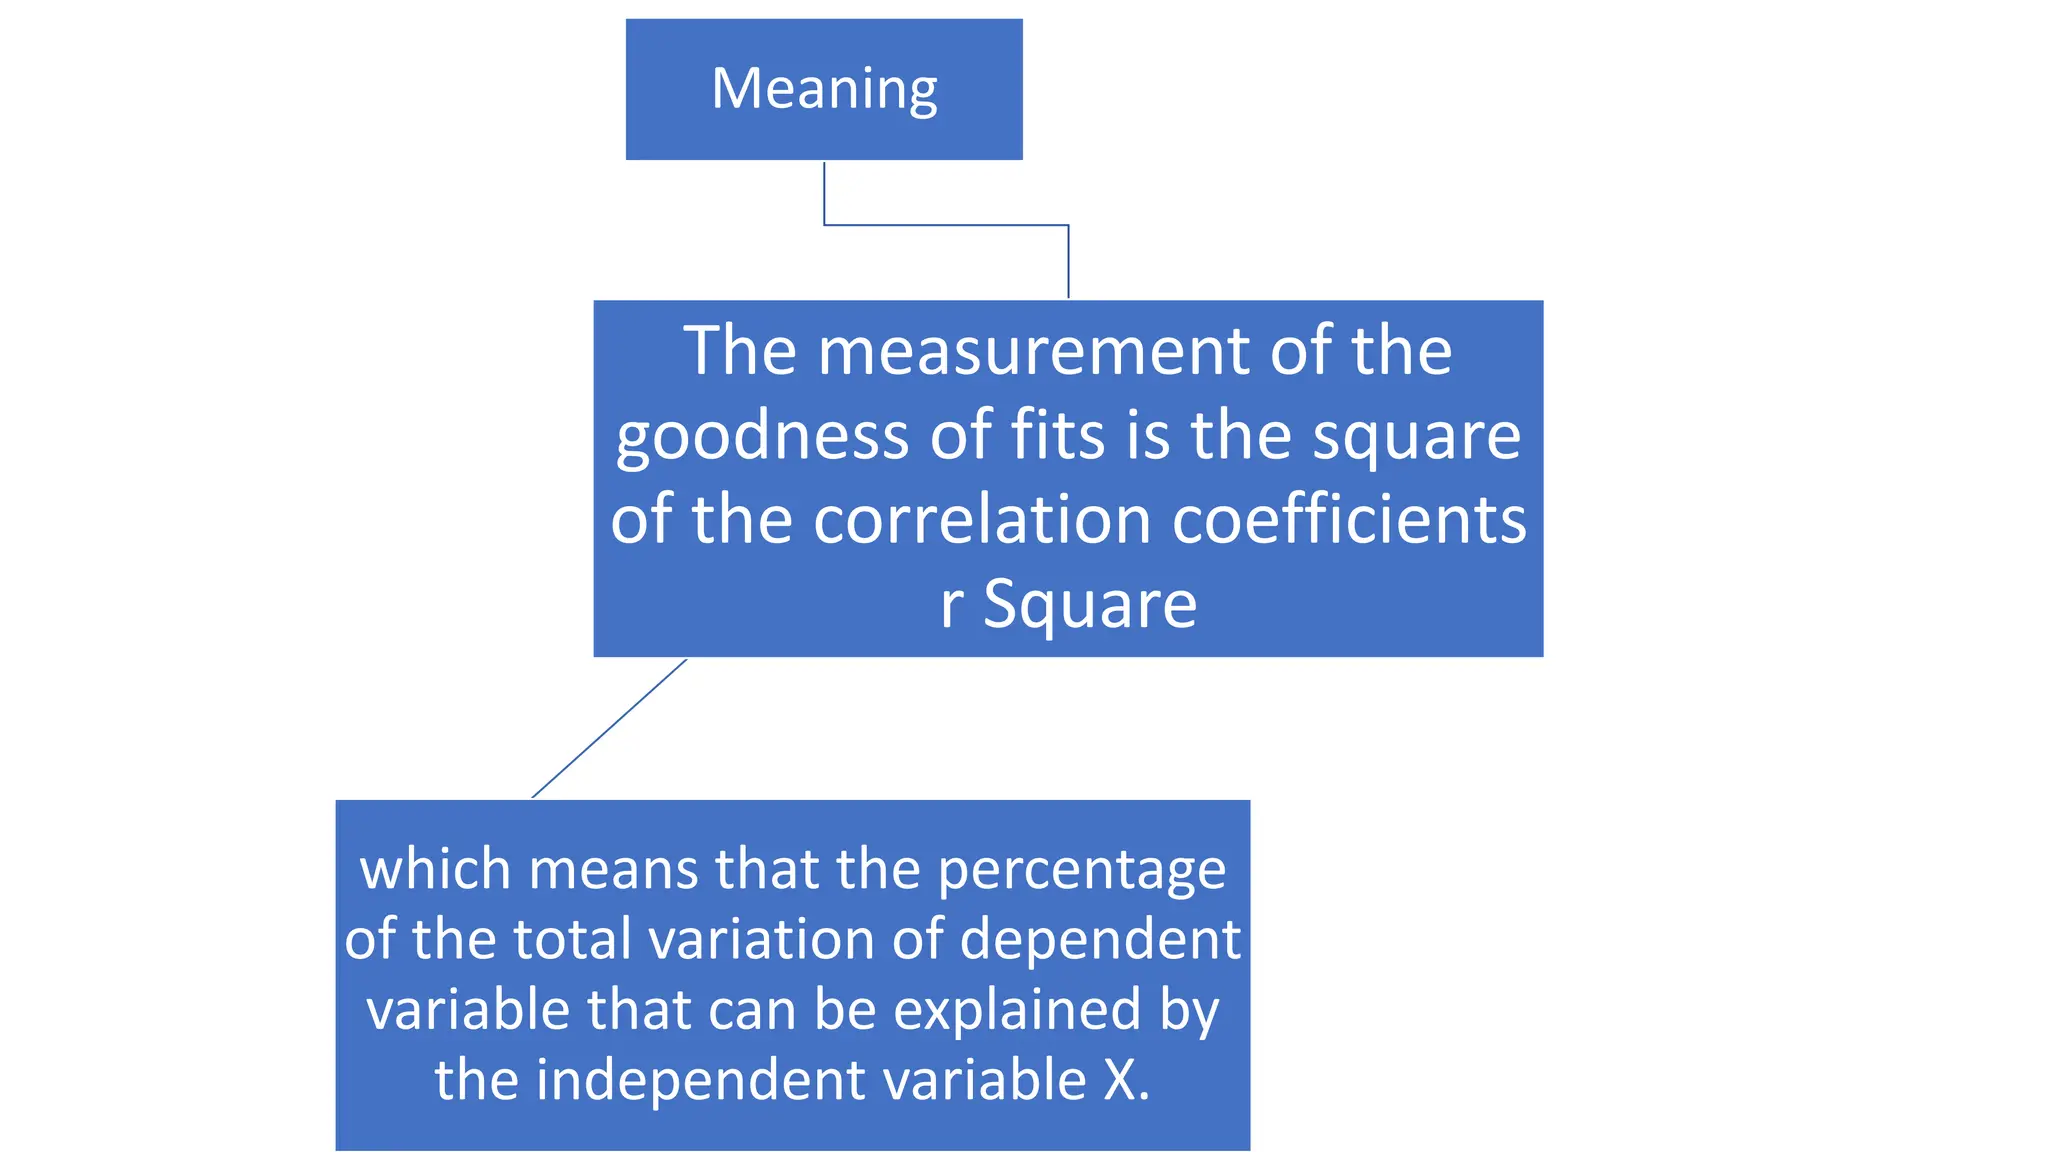
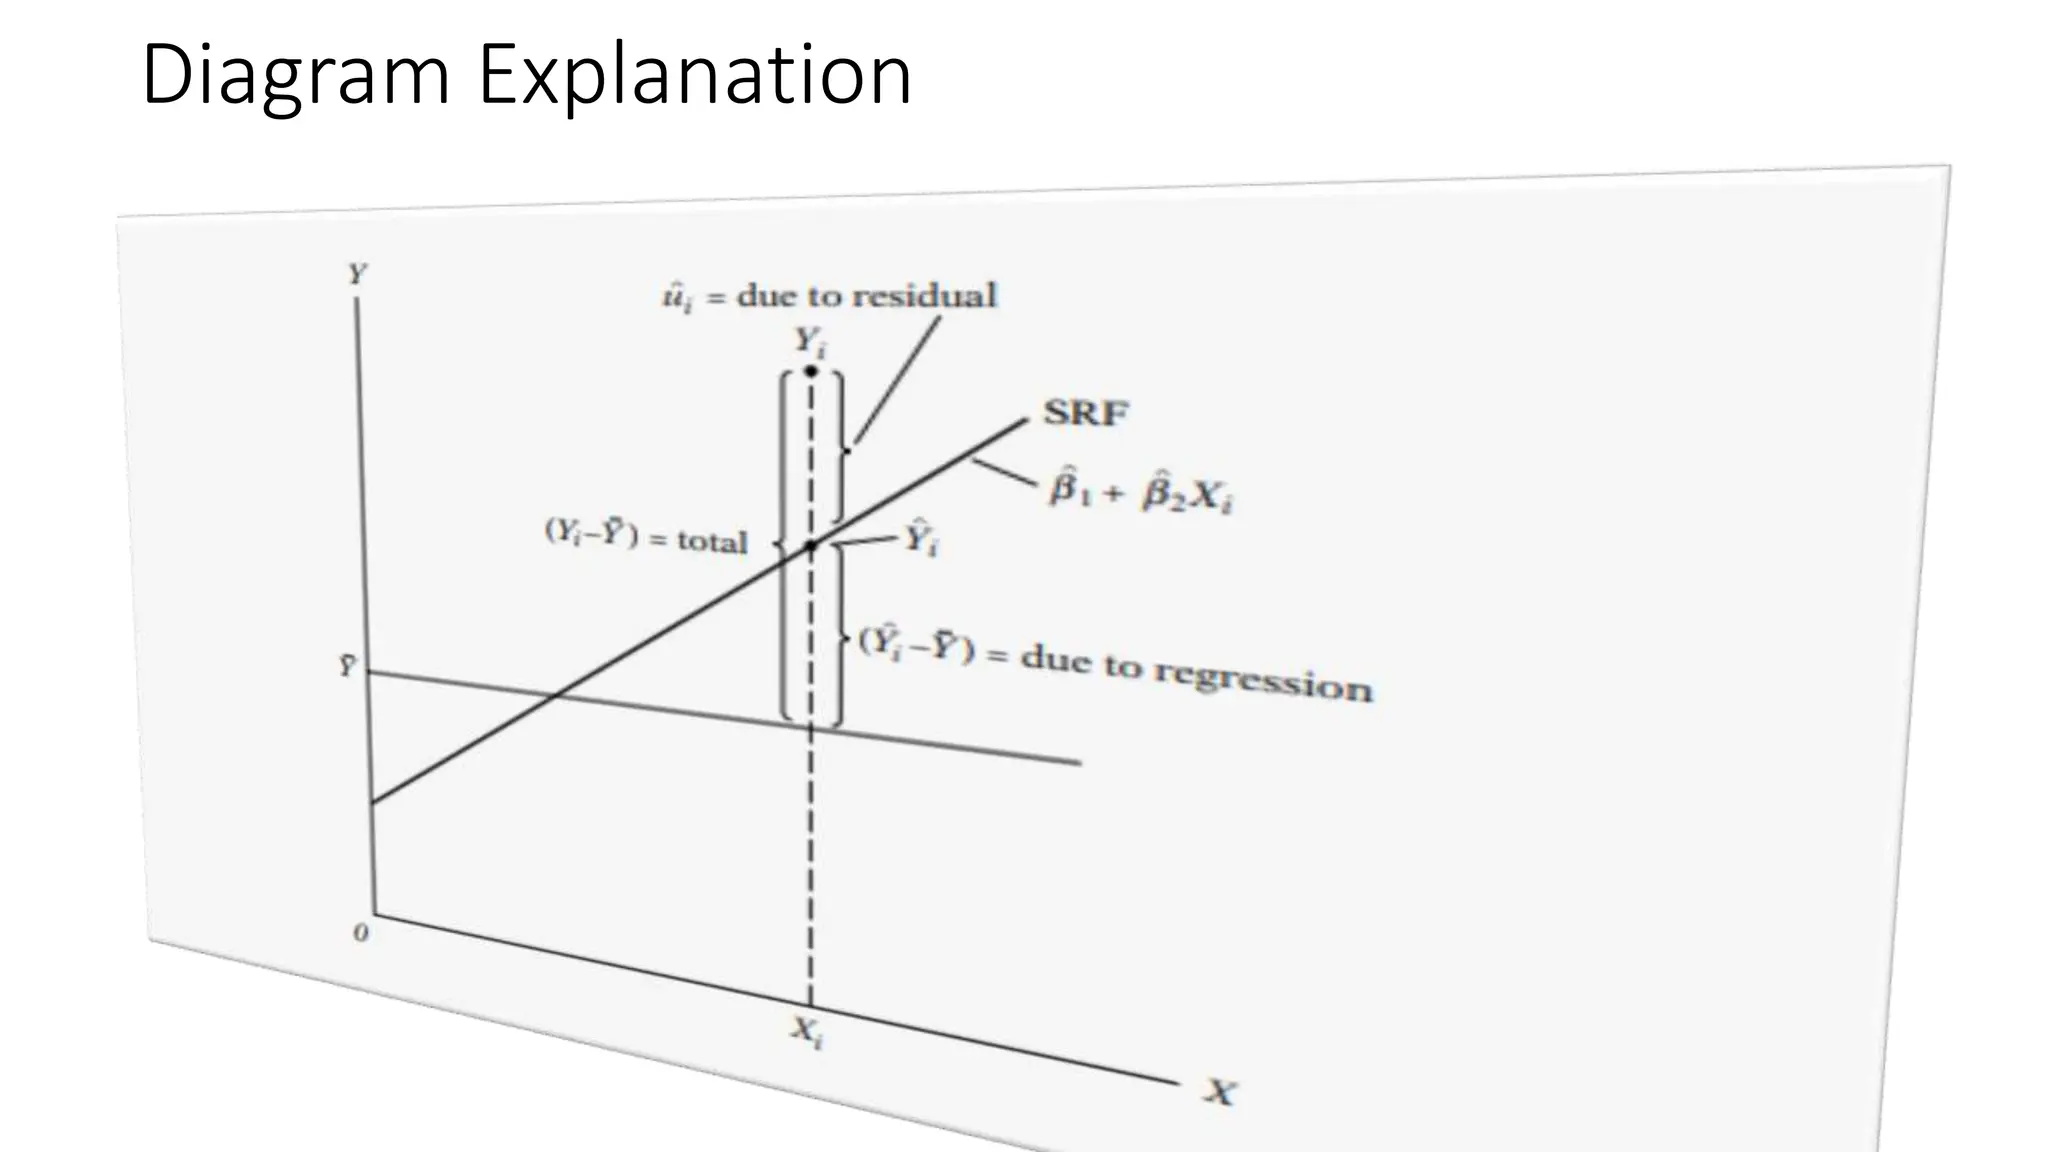
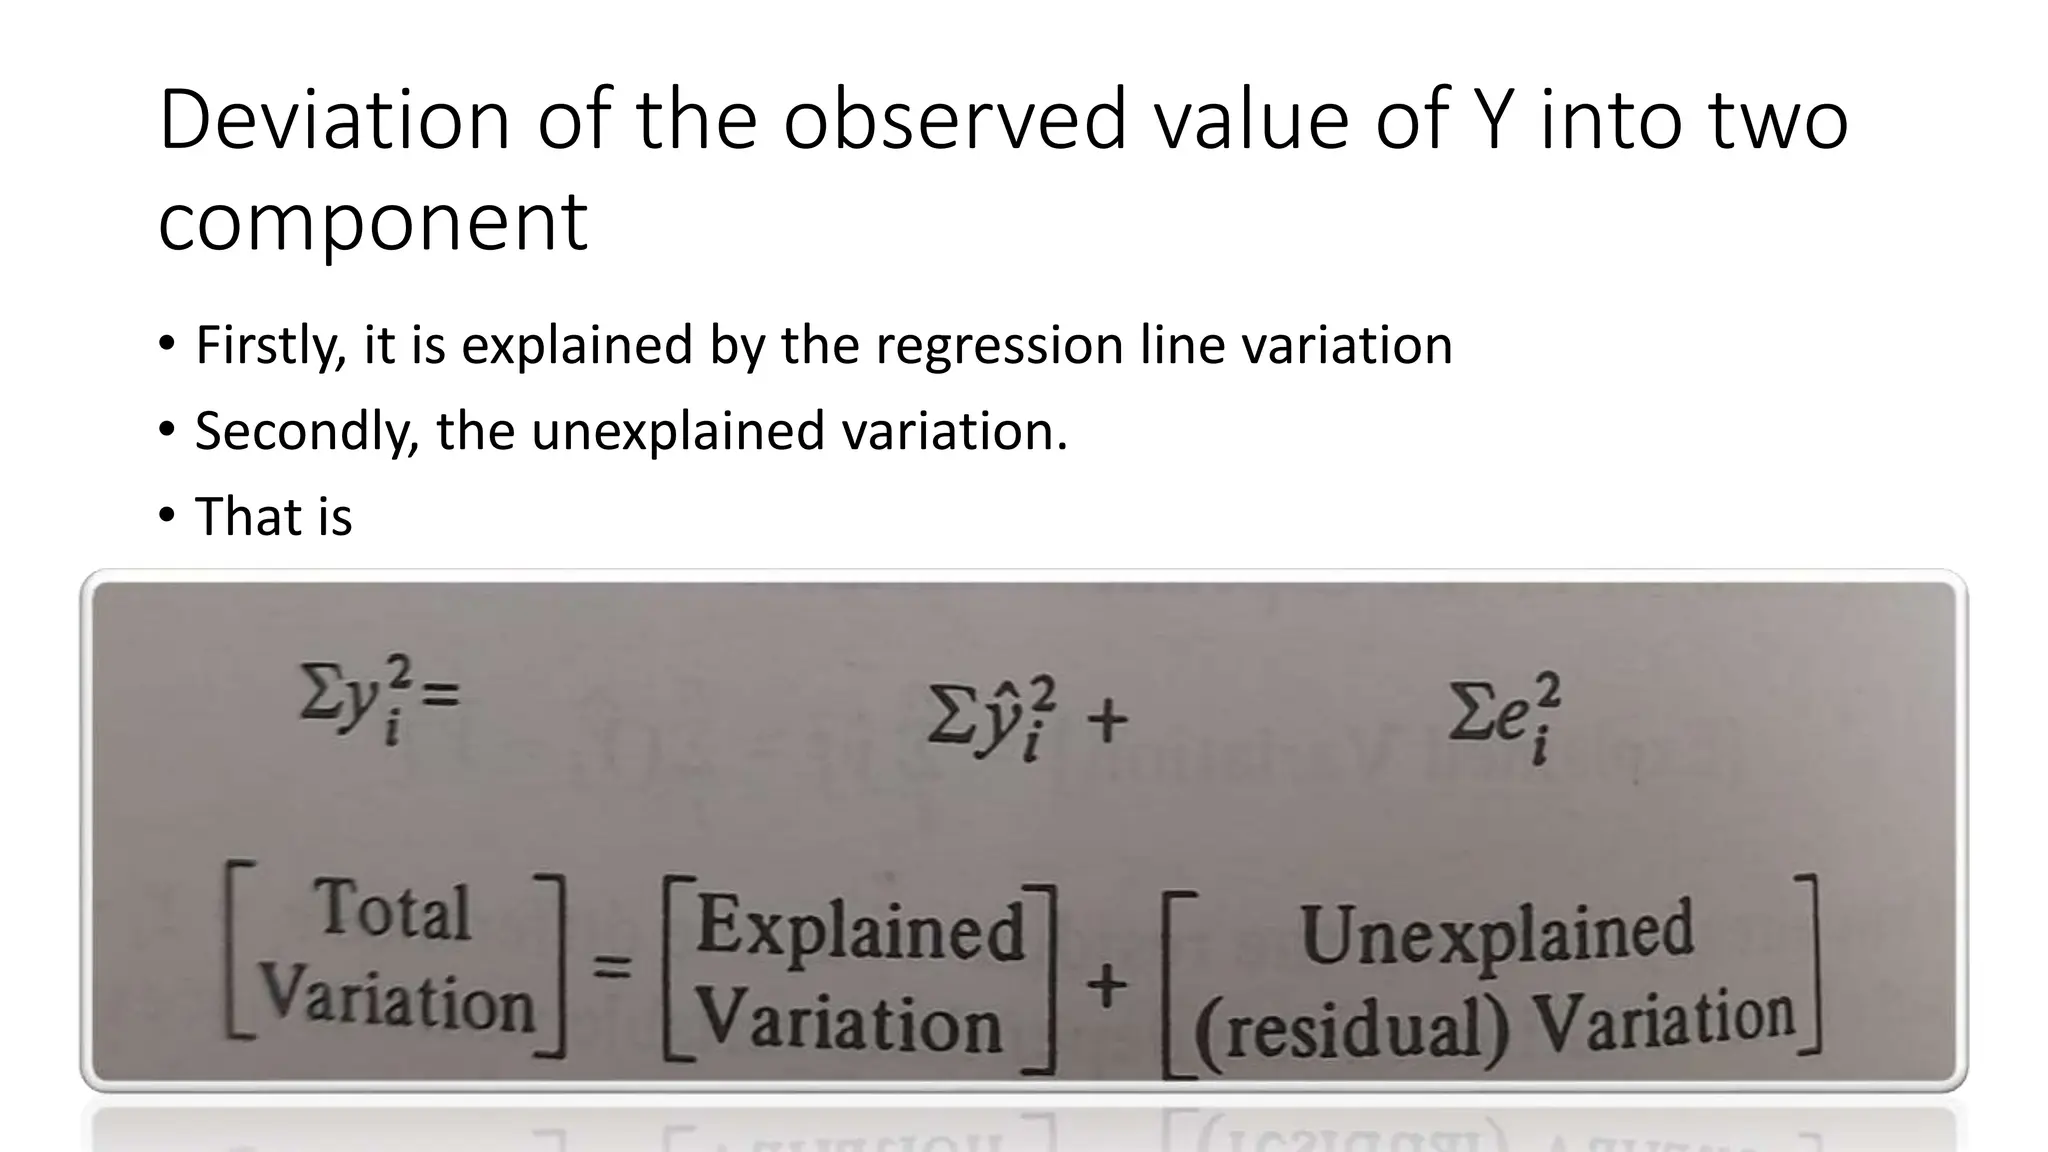
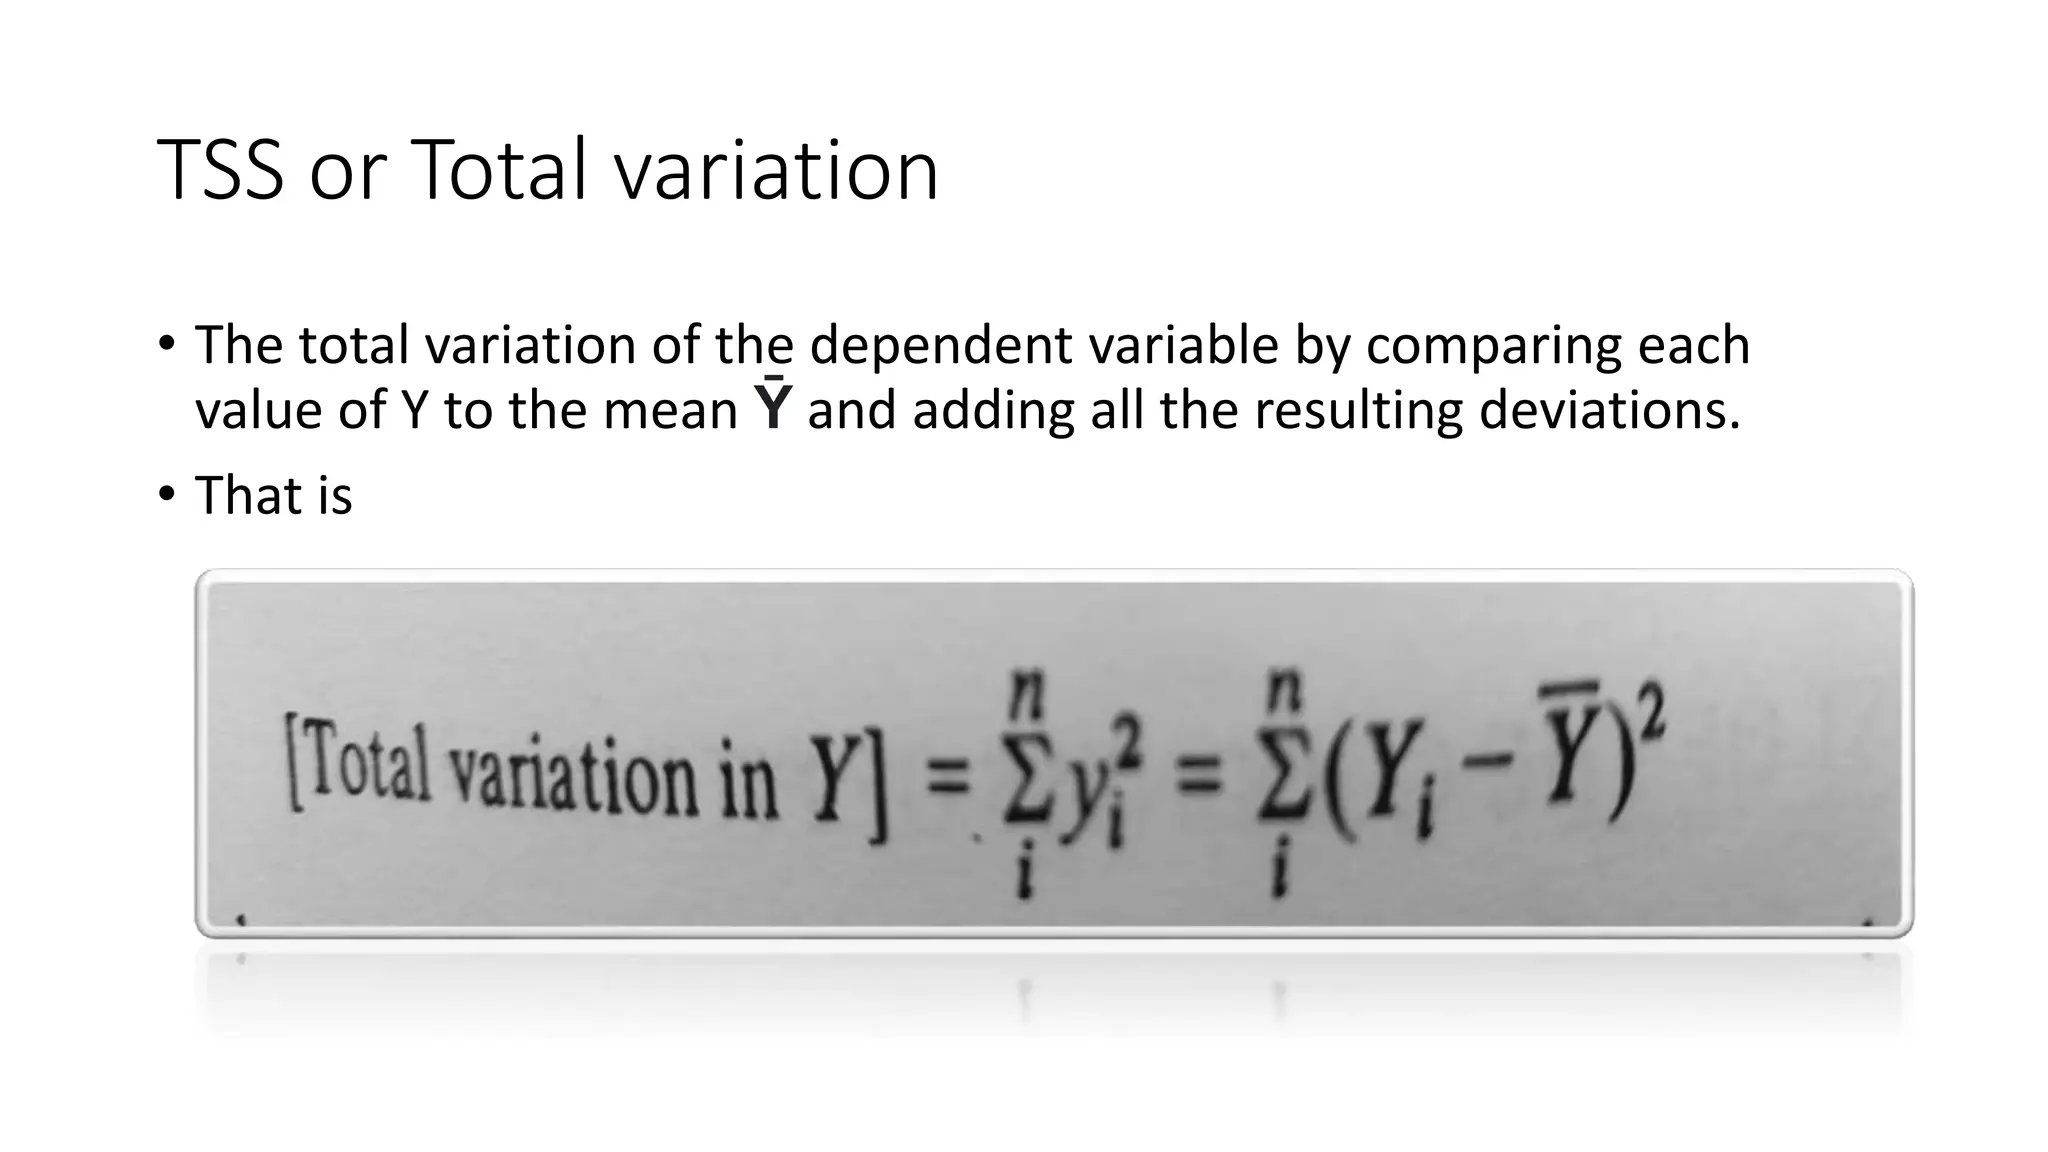
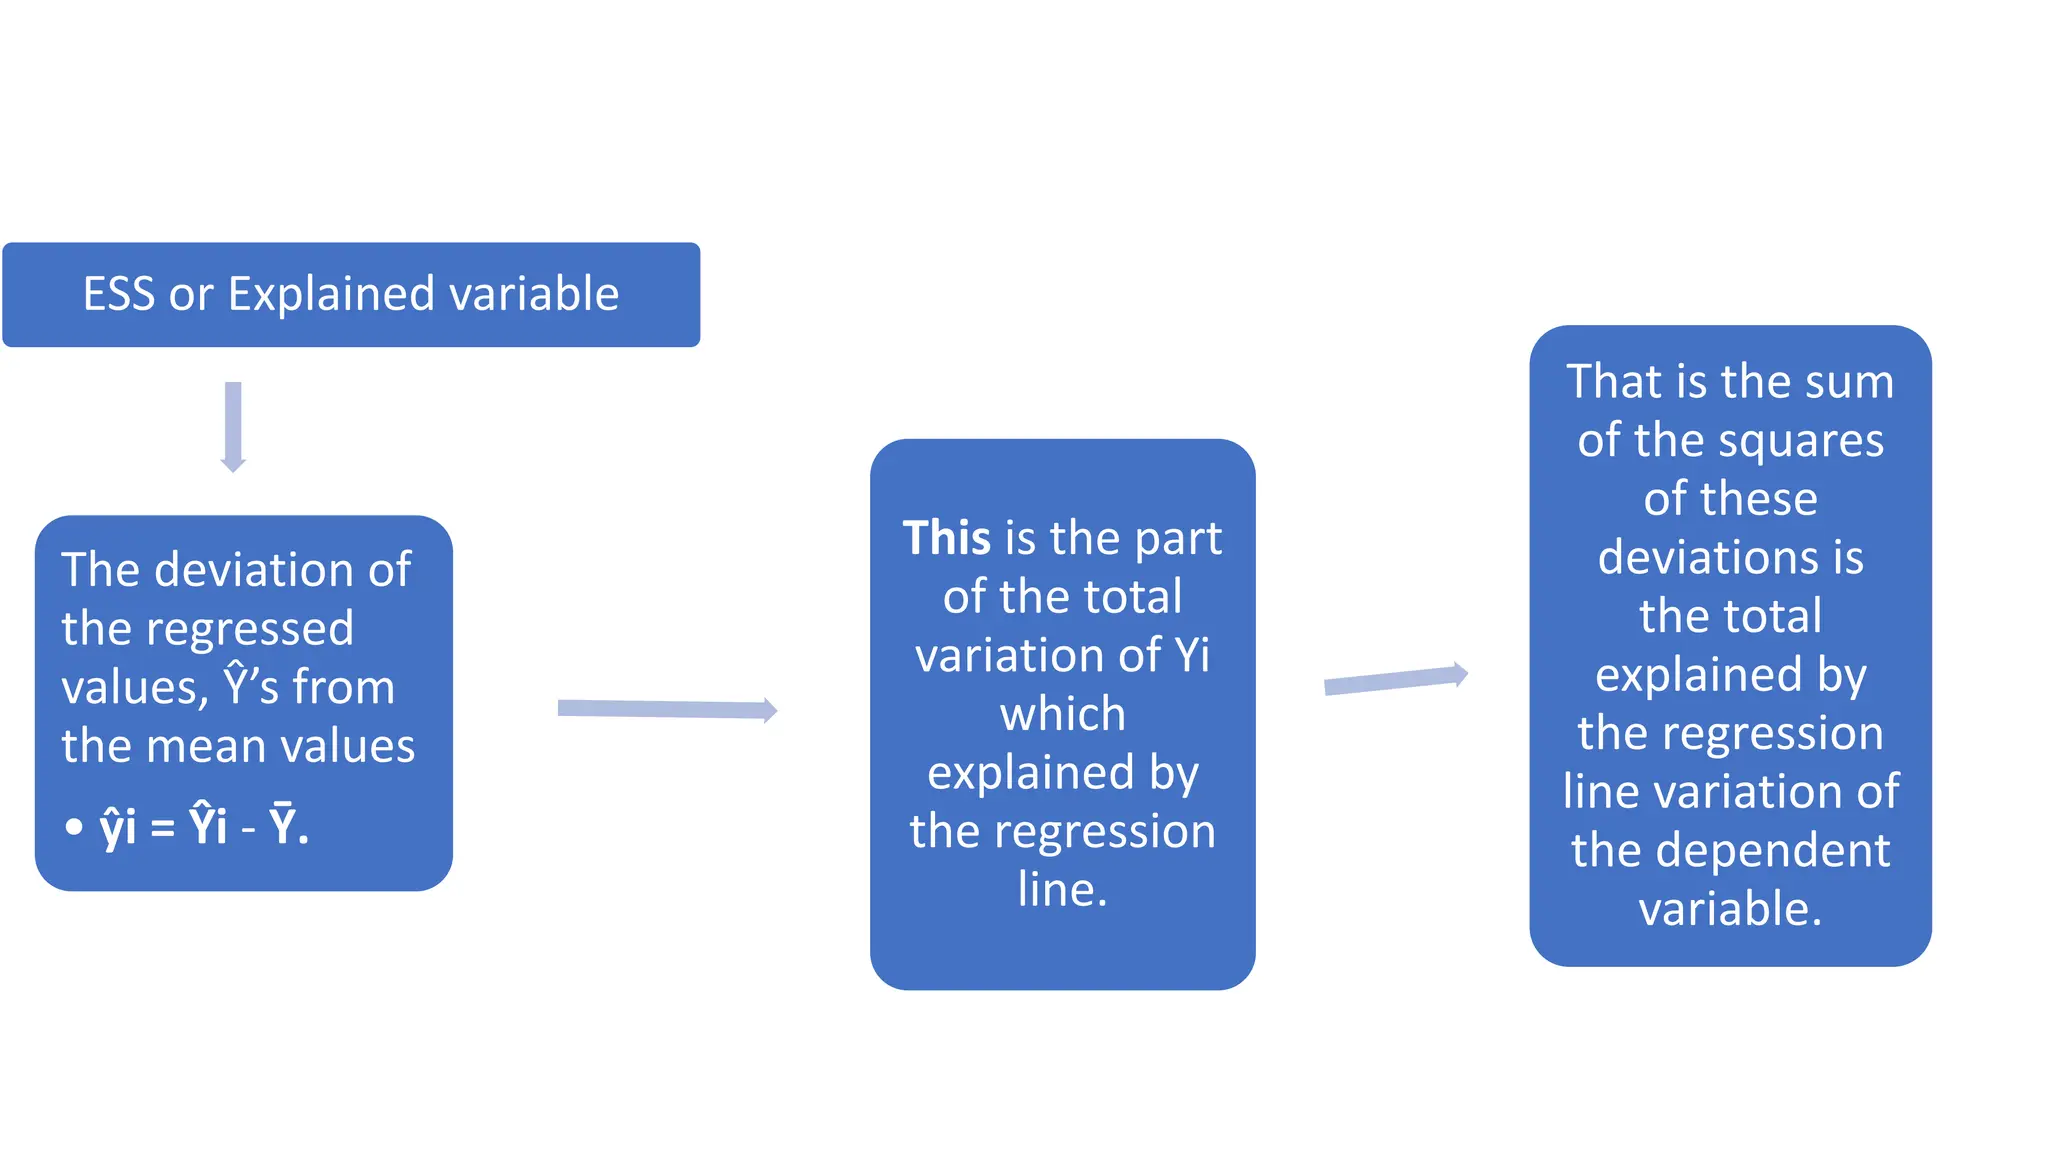
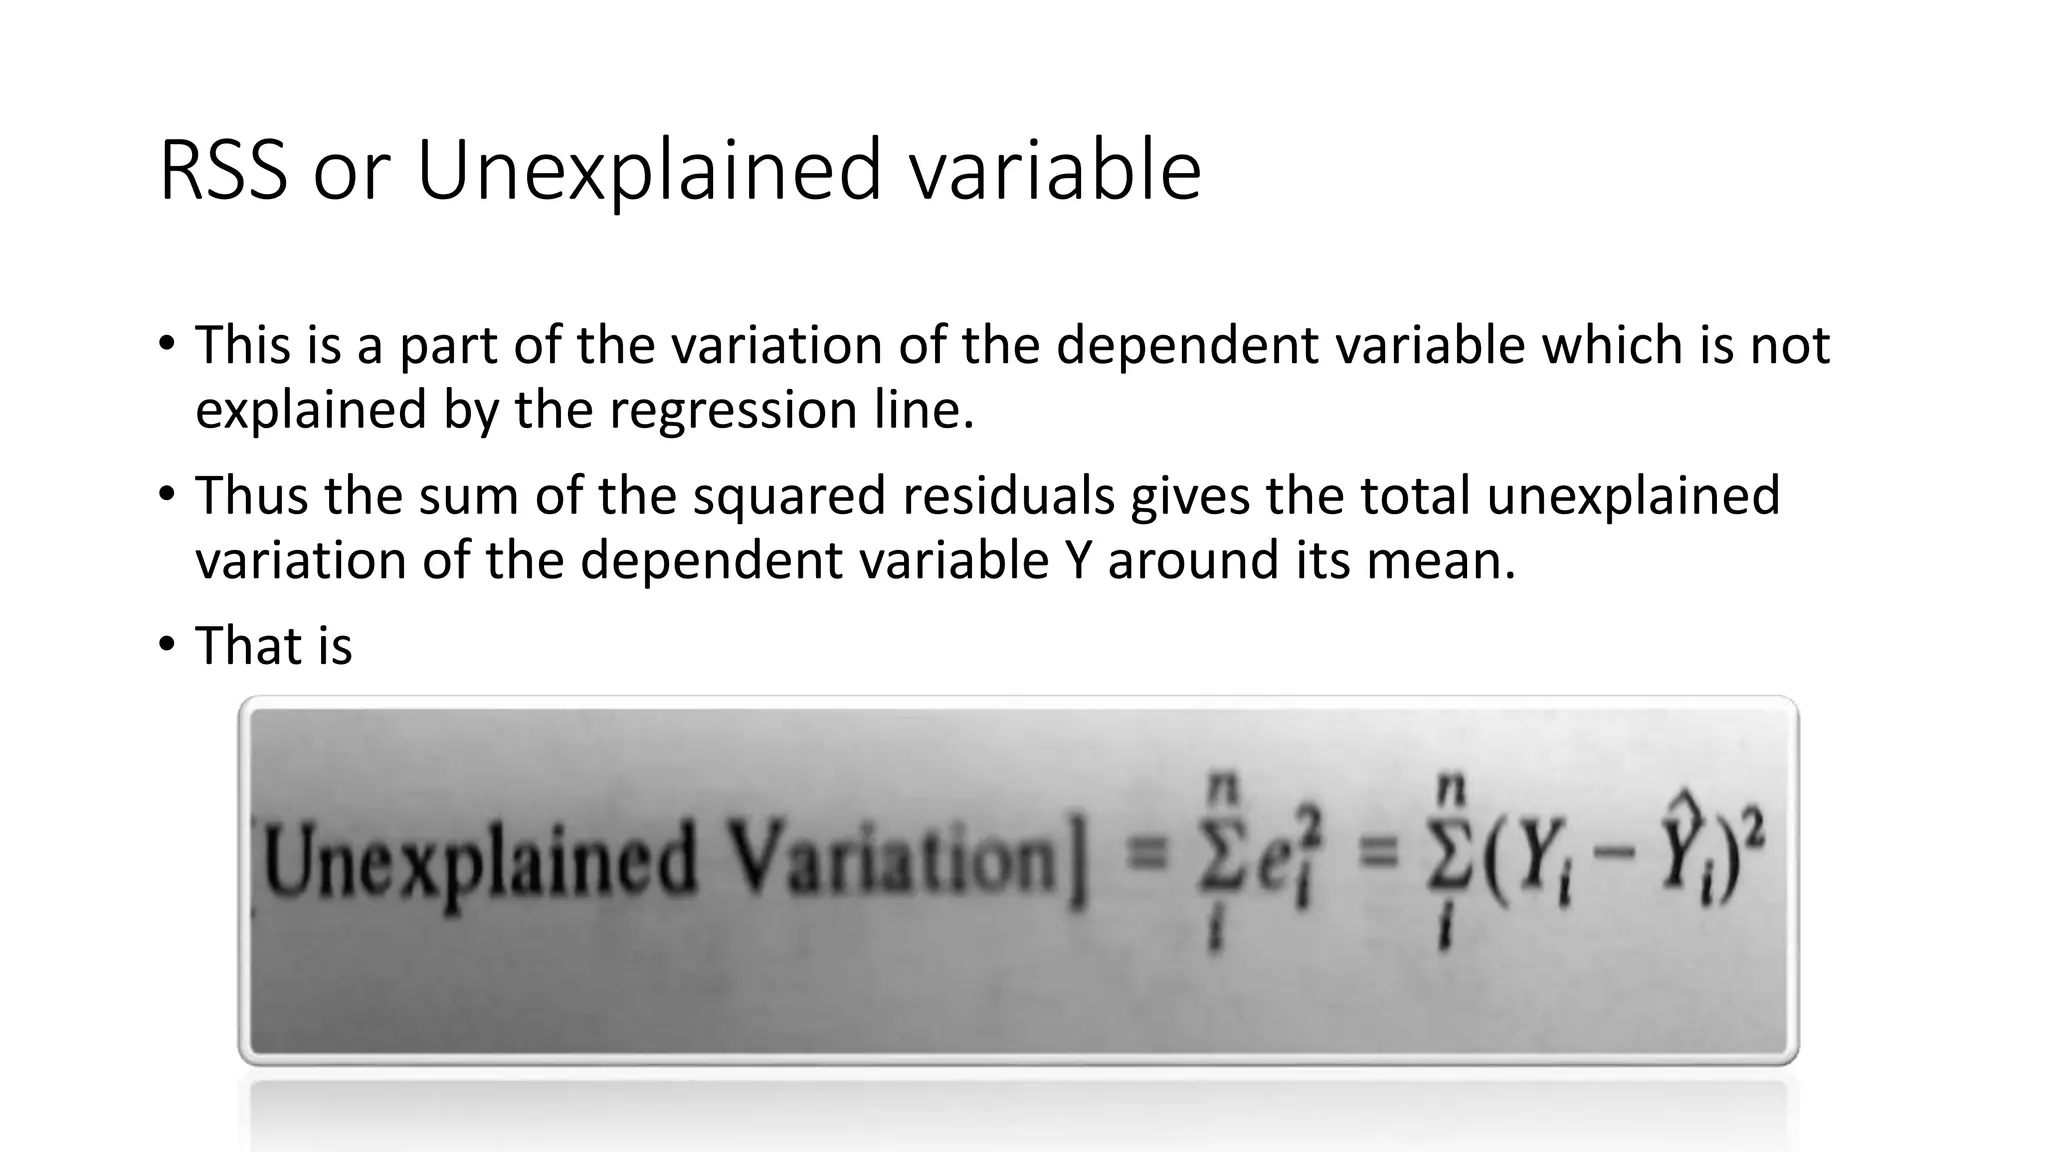
Goodness of Fit
we shall find out how “well” the
sample regression line fits the
data
We need to know how goodness
is the fit of this line to the sample
observations of Y and X.
If the closer the observation to
the line, the better the goodness
of fit. That is the explanation of
the variations of Y by the changes
in the explanatory variables.
Meaning
The measurement of the
goodness of fits is the square
of the correlation coefficients
r Square
which means that the percentage
of the total variation of dependent
variable that can be explained by
the independent variable X.
Diagram Explanation
Deviation of the observed value of Y into two
component
• Firstly, it is explained by the regression line variation
• Secondly, the unexplained variation.
• That is
TSS or Total variation
• The total variation of the dependent variable by comparing each
value of Y to the mean Ȳ and adding all the resulting deviations.
• That is
ESS or Explained variable
The deviation of
the regressed
values, Ŷ’s from
the mean values
• ŷi = Ŷi - Ȳ.
This is the part
of the total
variation of Yi
which
explained by
the regression
line.
That is the sum
of the squares
of these
deviations is
the total
explained by
the regression
line variation of
the dependent
variable.
RSS or Unexplained variable
• This is a part of the variation of the dependent variable which is not
explained by the regression line.
• Thus the sum of the squared residuals gives the total unexplained
variation of the dependent variable Y around its mean.
• That is

Coefficient of Determination or Goodness of Fit

  • 1.
  • 2.
    we shall findout how “well” the sample regression line fits the data We need to know how goodness is the fit of this line to the sample observations of Y and X. If the closer the observation to the line, the better the goodness of fit. That is the explanation of the variations of Y by the changes in the explanatory variables.
  • 5.
    Meaning The measurement ofthe goodness of fits is the square of the correlation coefficients r Square which means that the percentage of the total variation of dependent variable that can be explained by the independent variable X.
  • 6.
  • 7.
    Deviation of theobserved value of Y into two component • Firstly, it is explained by the regression line variation • Secondly, the unexplained variation. • That is
  • 8.
    TSS or Totalvariation • The total variation of the dependent variable by comparing each value of Y to the mean Ȳ and adding all the resulting deviations. • That is
  • 9.
    ESS or Explainedvariable The deviation of the regressed values, Ŷ’s from the mean values • ŷi = Ŷi - Ȳ. This is the part of the total variation of Yi which explained by the regression line. That is the sum of the squares of these deviations is the total explained by the regression line variation of the dependent variable.
  • 10.
    RSS or Unexplainedvariable • This is a part of the variation of the dependent variable which is not explained by the regression line. • Thus the sum of the squared residuals gives the total unexplained variation of the dependent variable Y around its mean. • That is