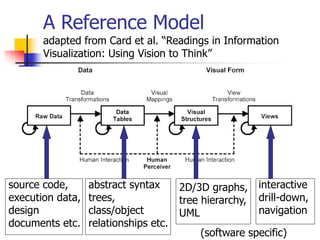
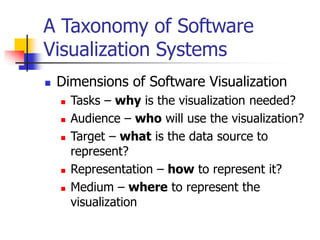
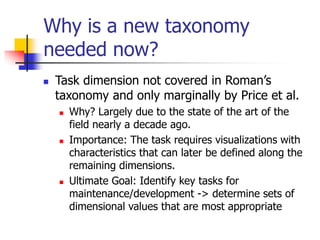
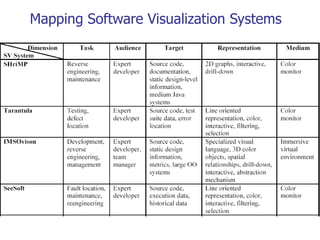
This document discusses software visualization tools and frameworks. It summarizes three papers on the topic. The first paper proposes matching visualization methods to specific tasks. The second presents a tool called PV that visualizes dynamics across multiple layers of a program's behavior. The third explores using 3D representations for software visualization to aid comprehension and analysis tasks.
![How does this relate to
previous work?
Dimension Roman
[Roman ’93]
Price et all.
[Price ’93,’98]
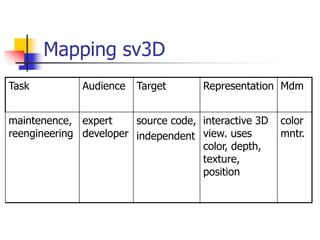
Task *** Purpose
Audience *** Purpose
Target Scope,
Abstraction
Scope,
Content
Representation Specification
method,
Interface,
Presentation
Form, Method,
Interaction,
Effectiveness
Medium *** Form](https://image.slidesharecdn.com/0329-230426154720-4ca264f2/85/0329-emccormi-ppt-7-320.jpg)


![Mapping Data to a Visual
Metaphor
A Criteria [MacKinlay 1986]
Expressiveness
capability of the metaphor to represent all the
information we desire to visualize
Effectiveness
efficiency of the metaphor as a means of
representing the information](https://image.slidesharecdn.com/0329-230426154720-4ca264f2/85/0329-emccormi-ppt-18-320.jpg)
![Related Works
SeeSoft [Ball and Eick 1996]
Expressiveness: 2D pixel bars limits the number
of attributes that can be visualized as well as the
types of relationships.
Effectiveness: natural and direct mapping from
the visual metaphor to the source code and back.
Tarantula [Jones et al 2001]
Expressiveness: built on SeeSoft – uses
brightness to represent an extra attribute.
Effectiveness: As noted by authors – brightness
is confusing and poorly perceived by users.](https://image.slidesharecdn.com/0329-230426154720-4ca264f2/85/0329-emccormi-ppt-19-320.jpg)
![Related Works
Bee/Hive [Reiss 2001]
Expressiveness
introduces file maps, which make use of
texture and third dimension.
supports multiple views of the data and
multiple data sources.
Effectiveness
supported user interactions are somewhat
limited for 3D renderings.. thus problems such
as occlusion may occur.](https://image.slidesharecdn.com/0329-230426154720-4ca264f2/85/0329-emccormi-ppt-20-320.jpg)
![The sv3D Framework
Effectiveness:
displaying data in 3 dimensions instead of 2 can
make it easier for the user to understand
[Ware, Frank 1994]
user understanding of 3D structure improves when
they can manipulate structure
[Hubona et al. 1997]
3D representations have been shown to better
support spcial memory tasks than 2D
[Tavanti, Lind 2001]](https://image.slidesharecdn.com/0329-230426154720-4ca264f2/85/0329-emccormi-ppt-22-320.jpg)
![The User Interface
[Shneiderman ’96]
Filtering:
transparency, elevation
Details on demand:
interaction: track ball, handle box; information
panel for data values
Relate:
height, depth, color, position - arrange in 3D
space
History:
snapshots (sequences of snapshots for a path)
Extract: future (currently focused on visual)](https://image.slidesharecdn.com/0329-230426154720-4ca264f2/85/0329-emccormi-ppt-23-320.jpg)