Download as PDF, PPTX
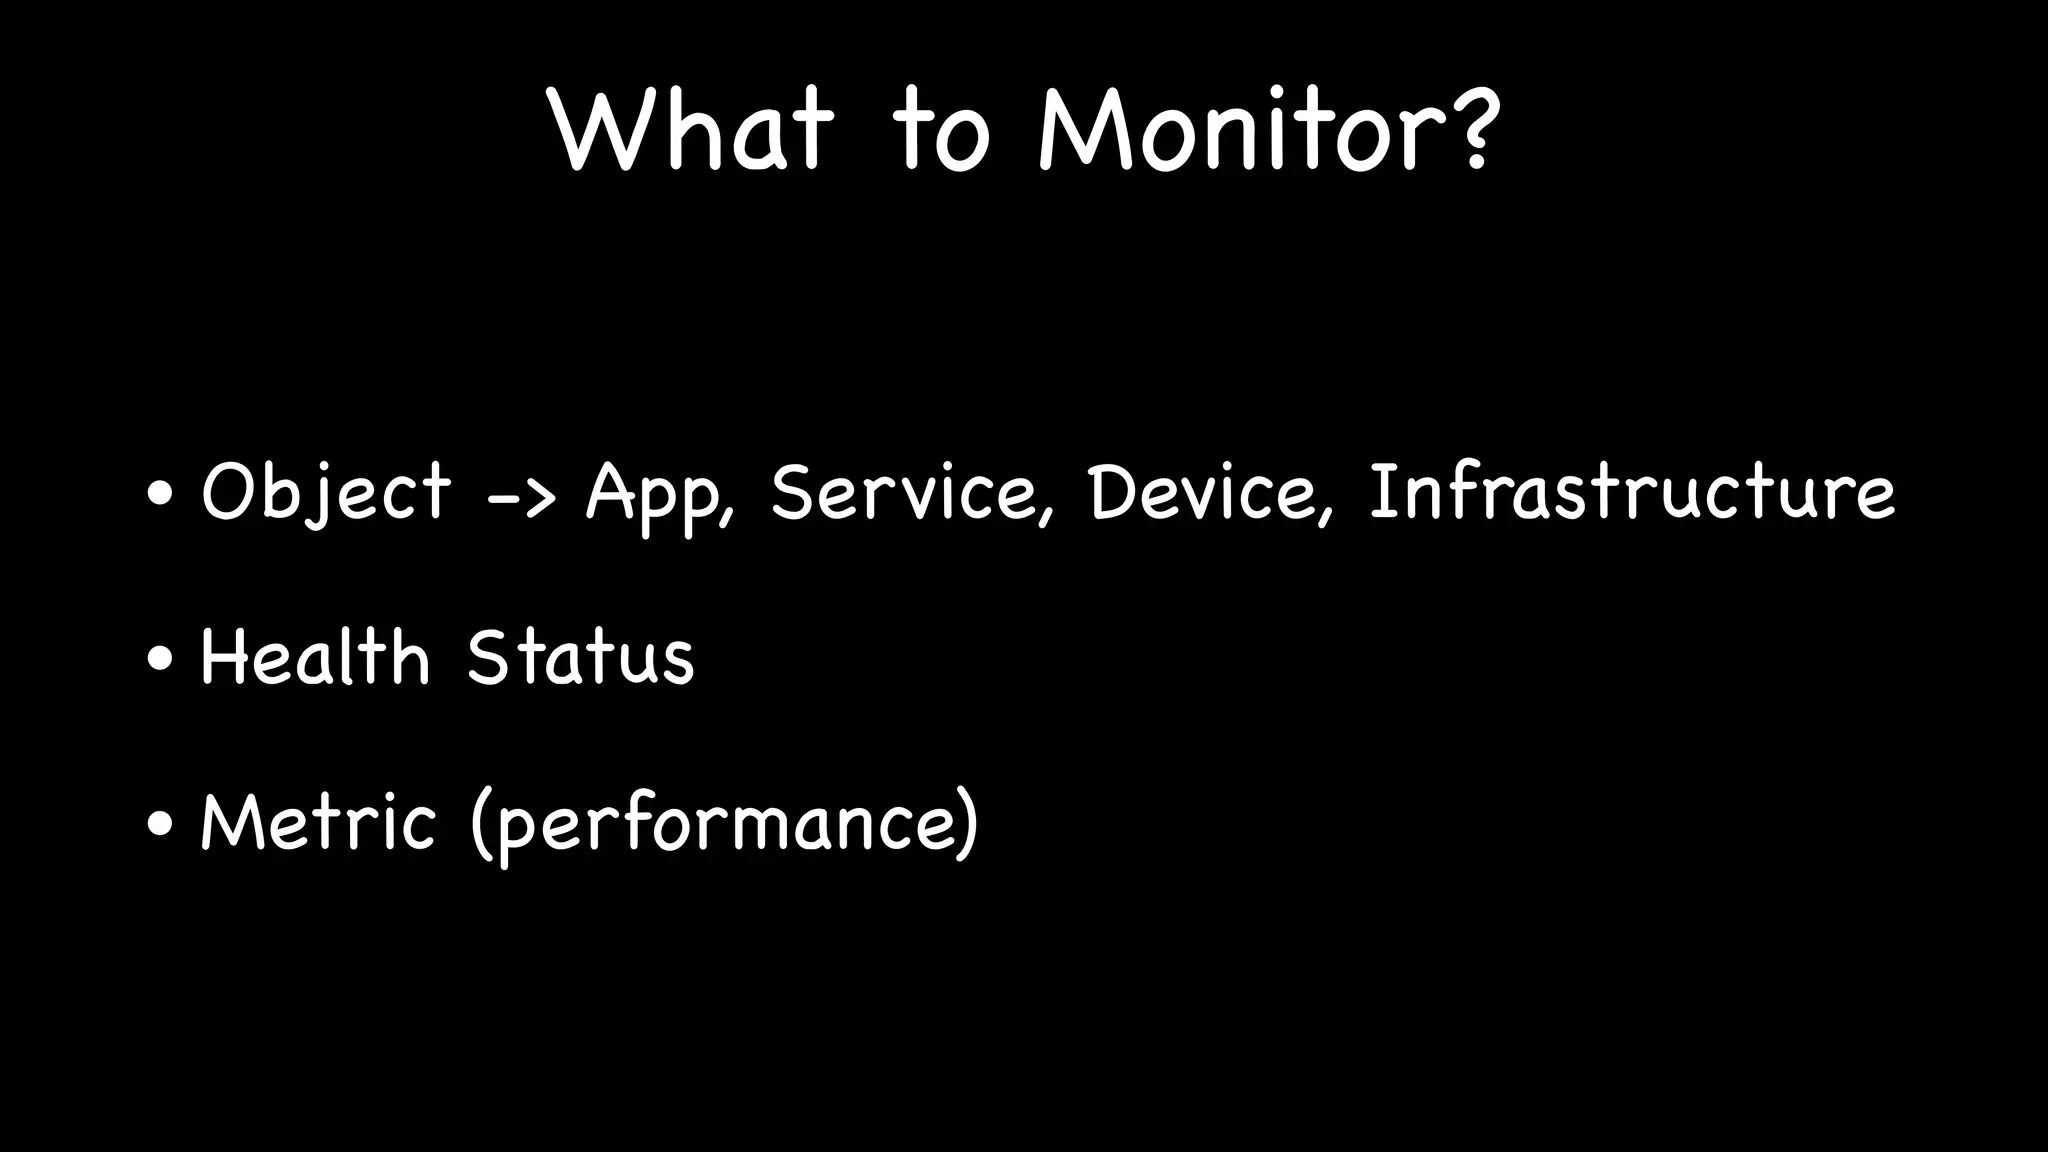
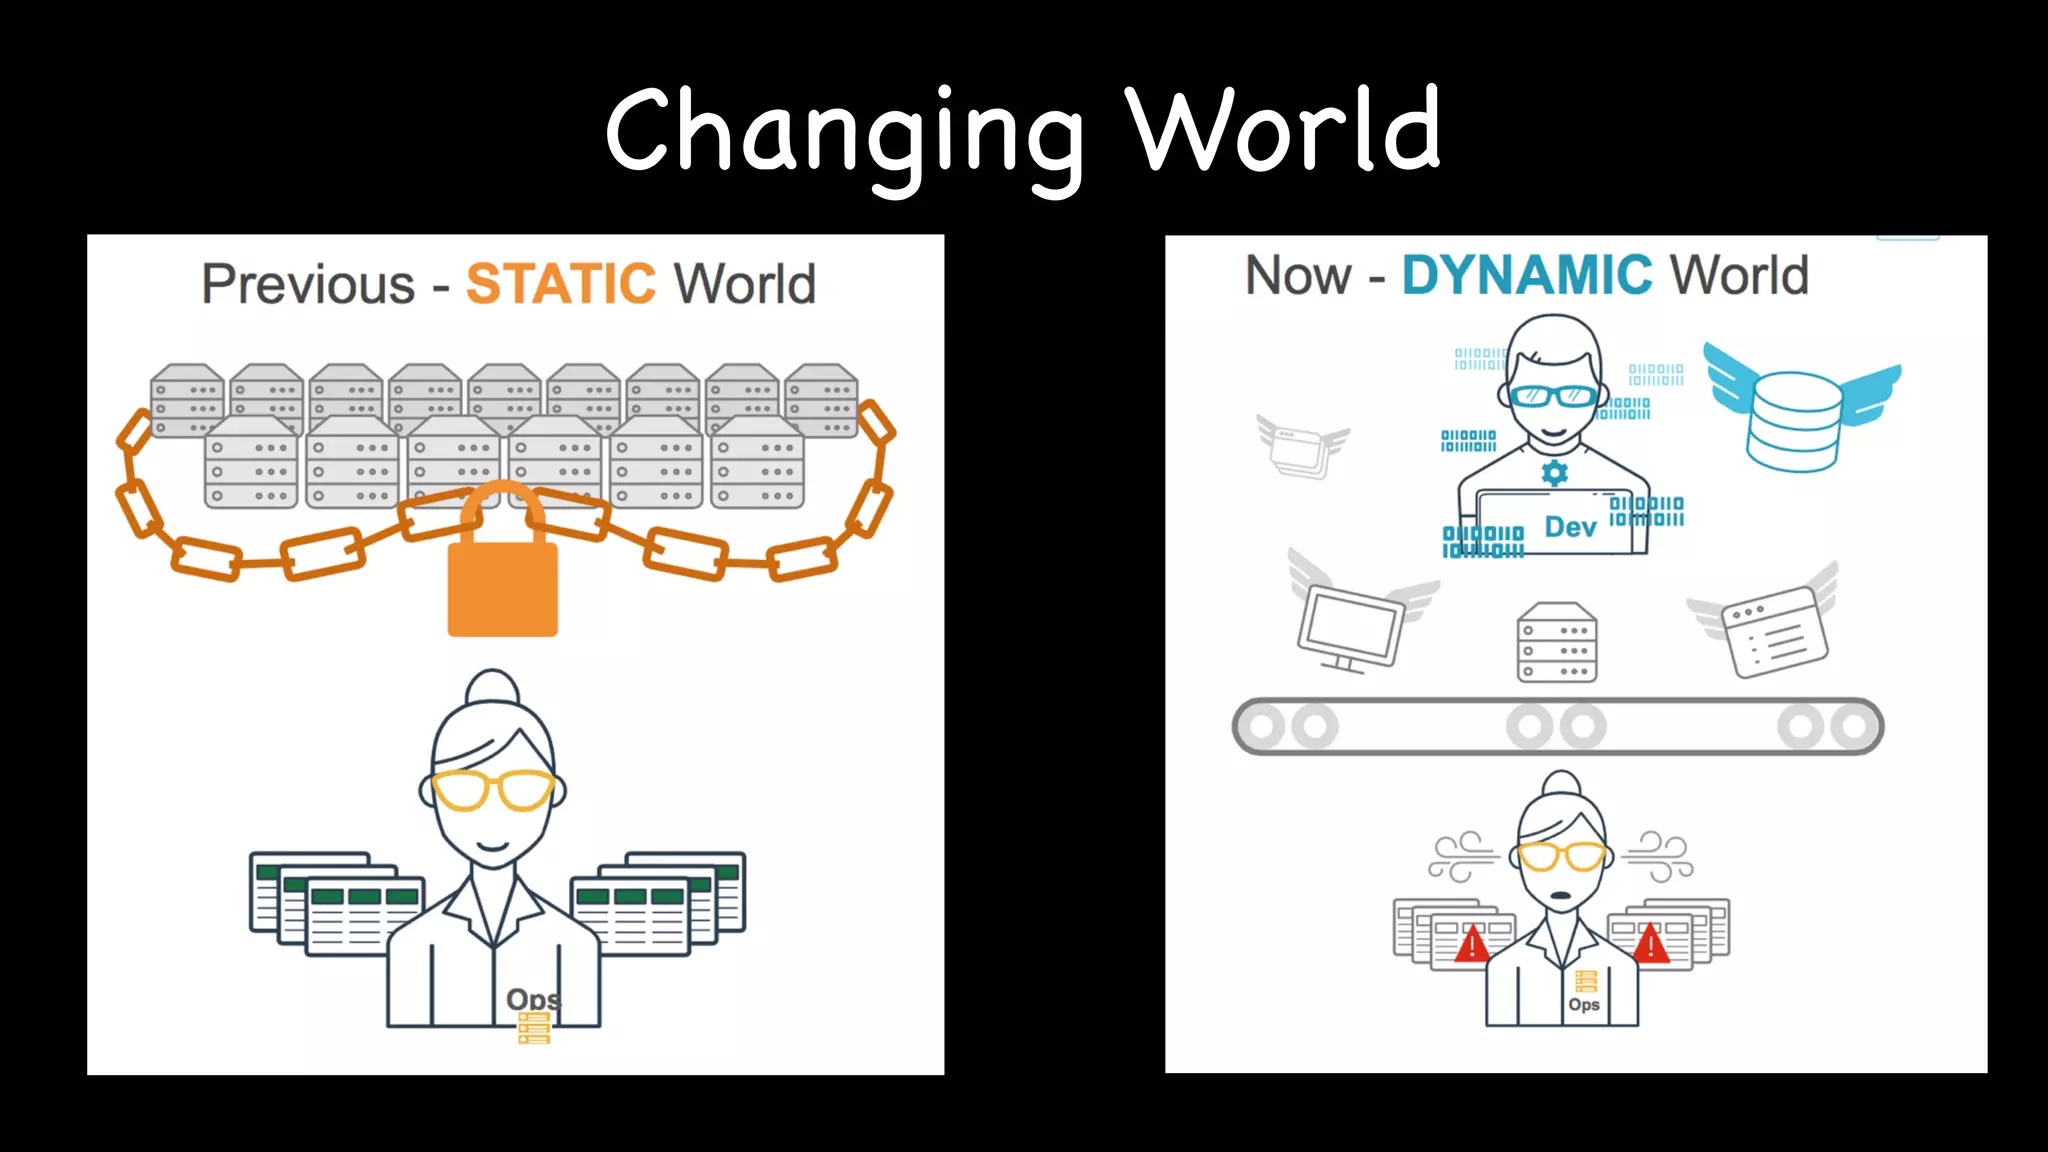
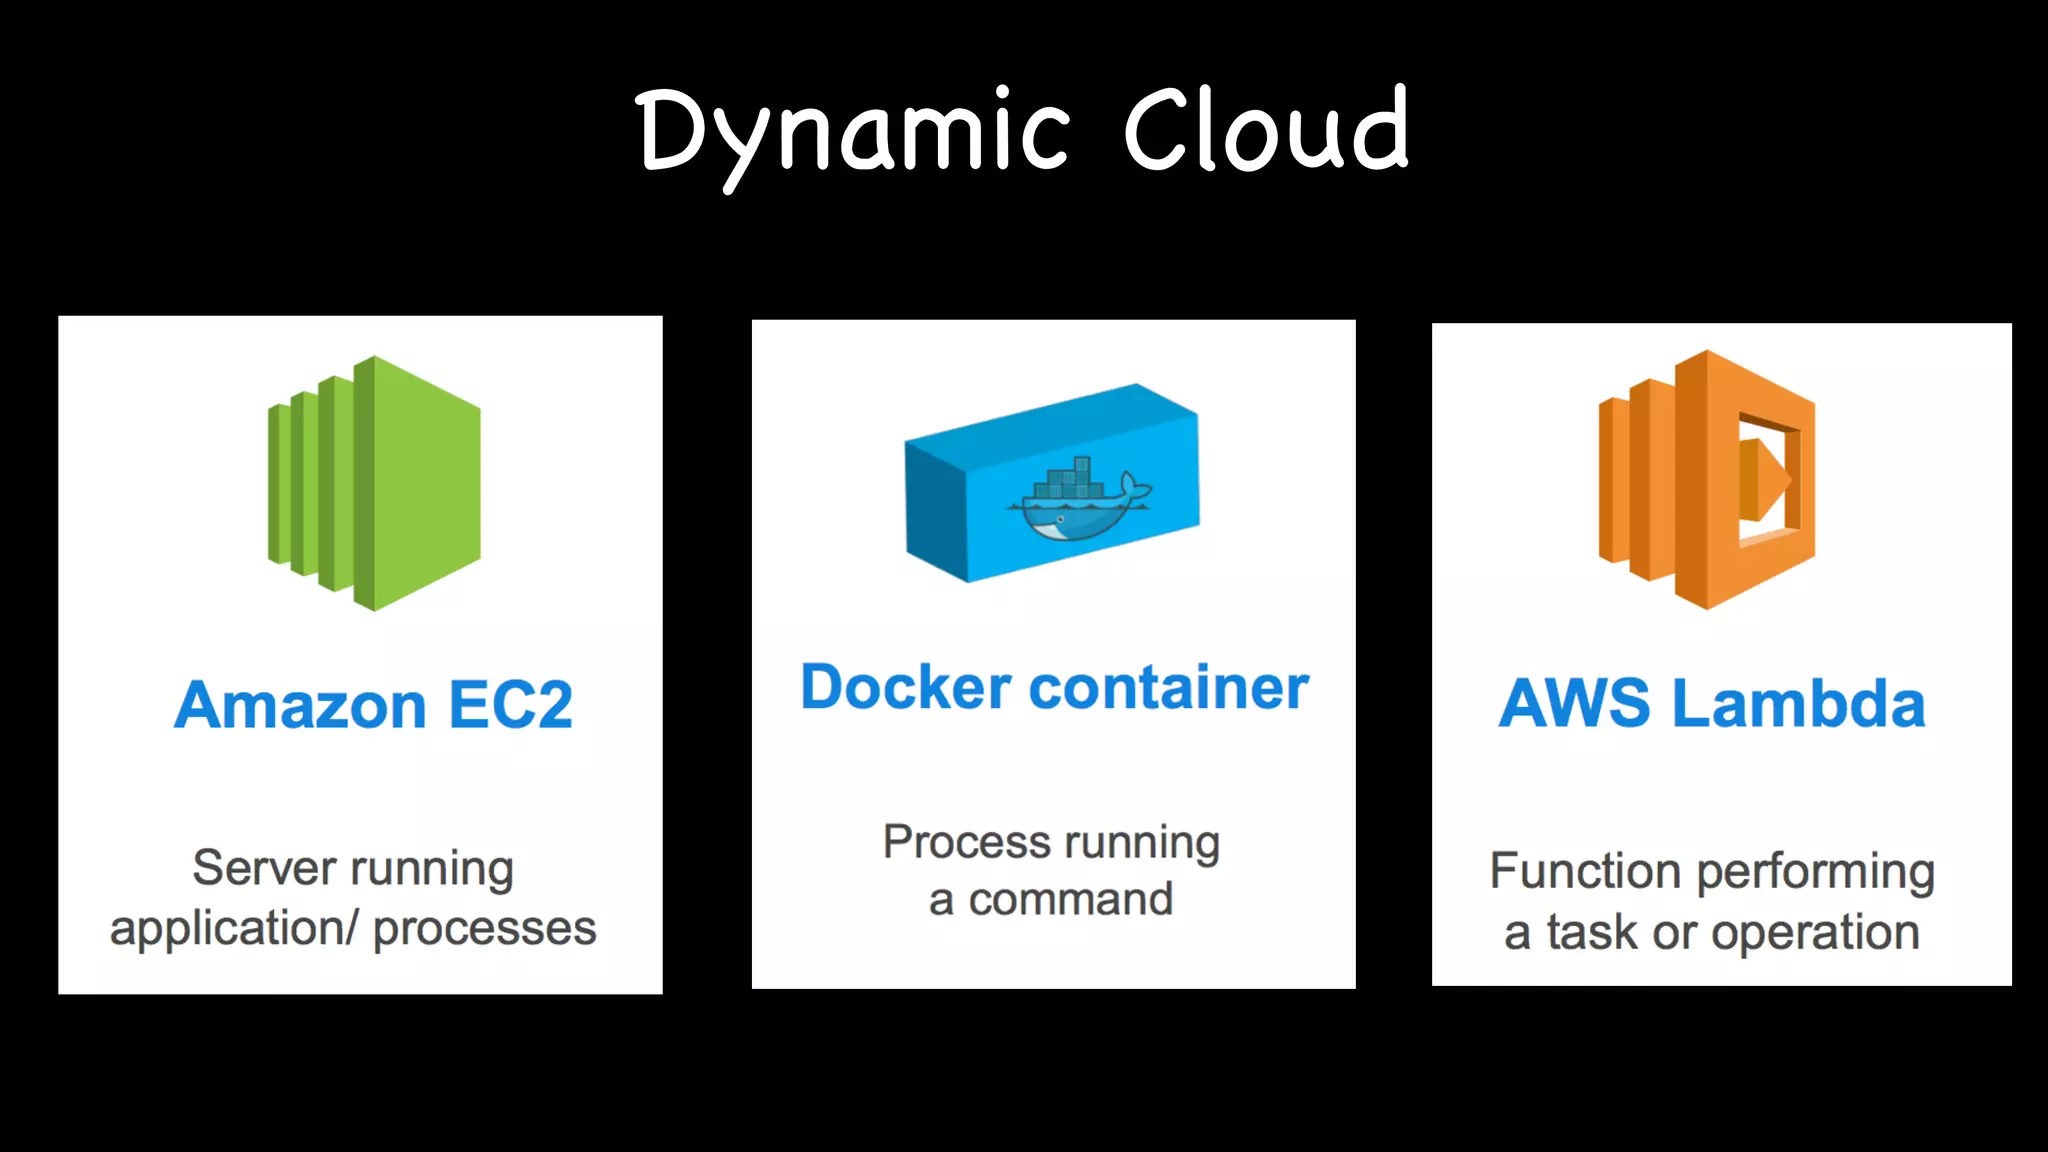
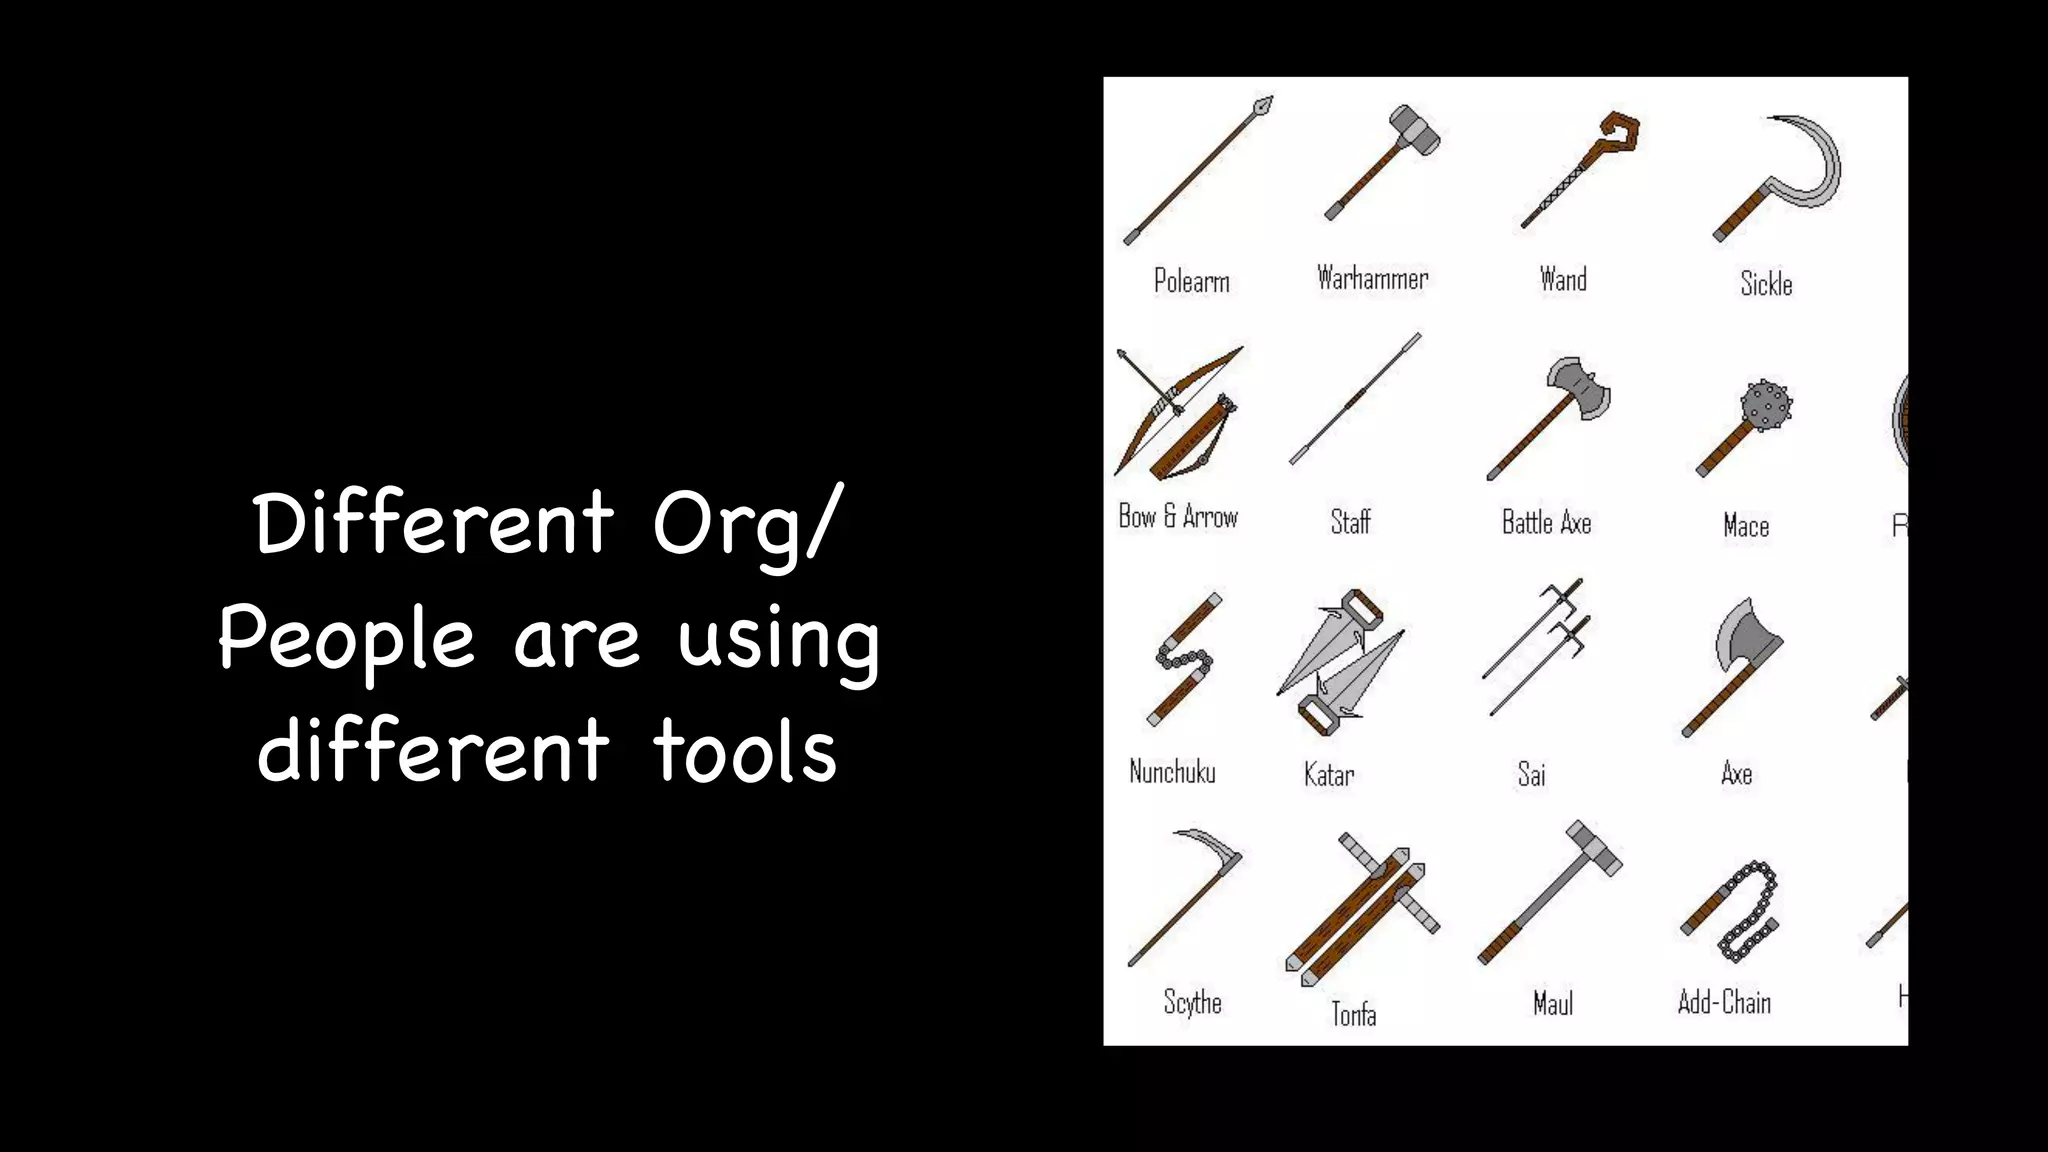
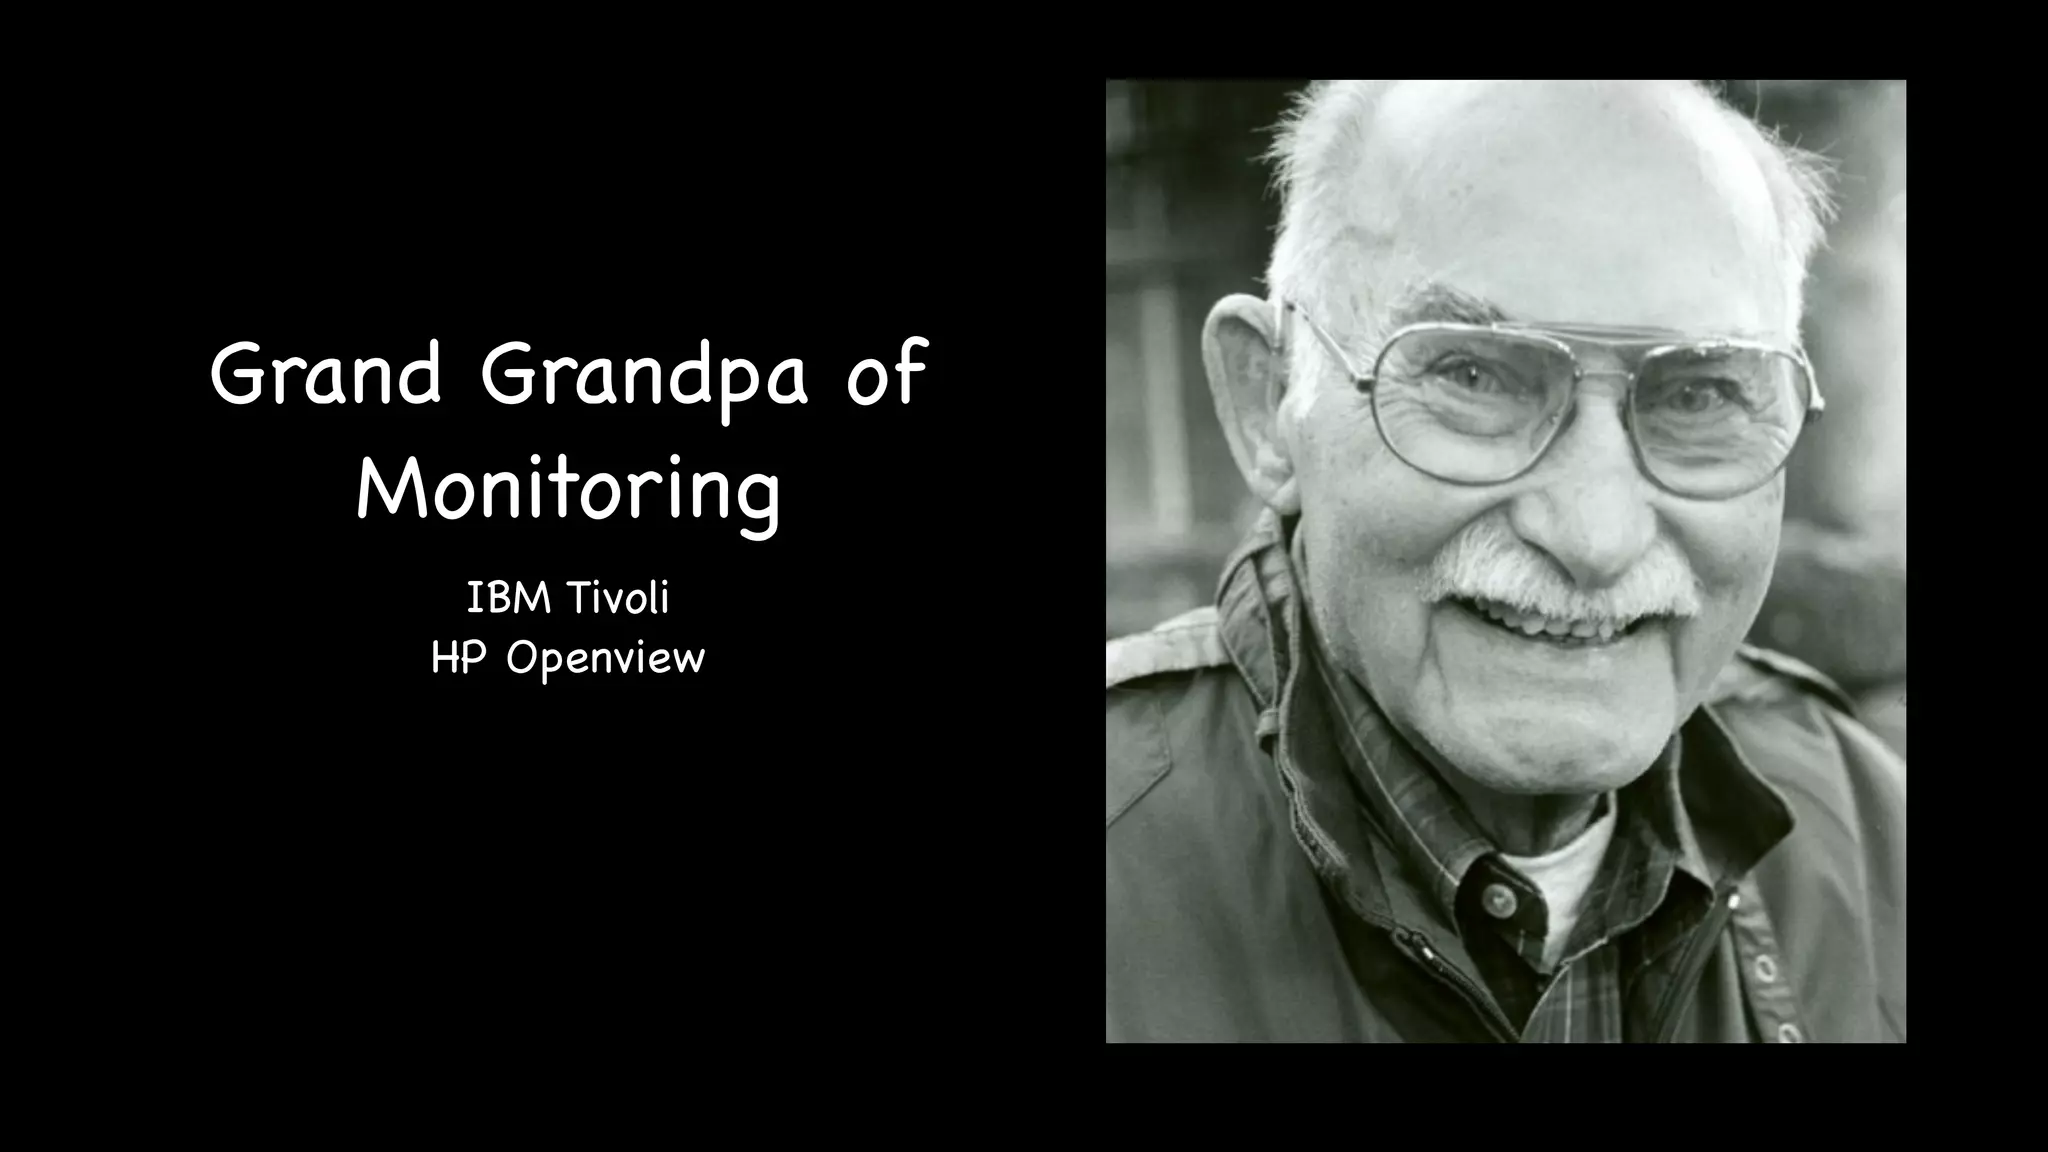
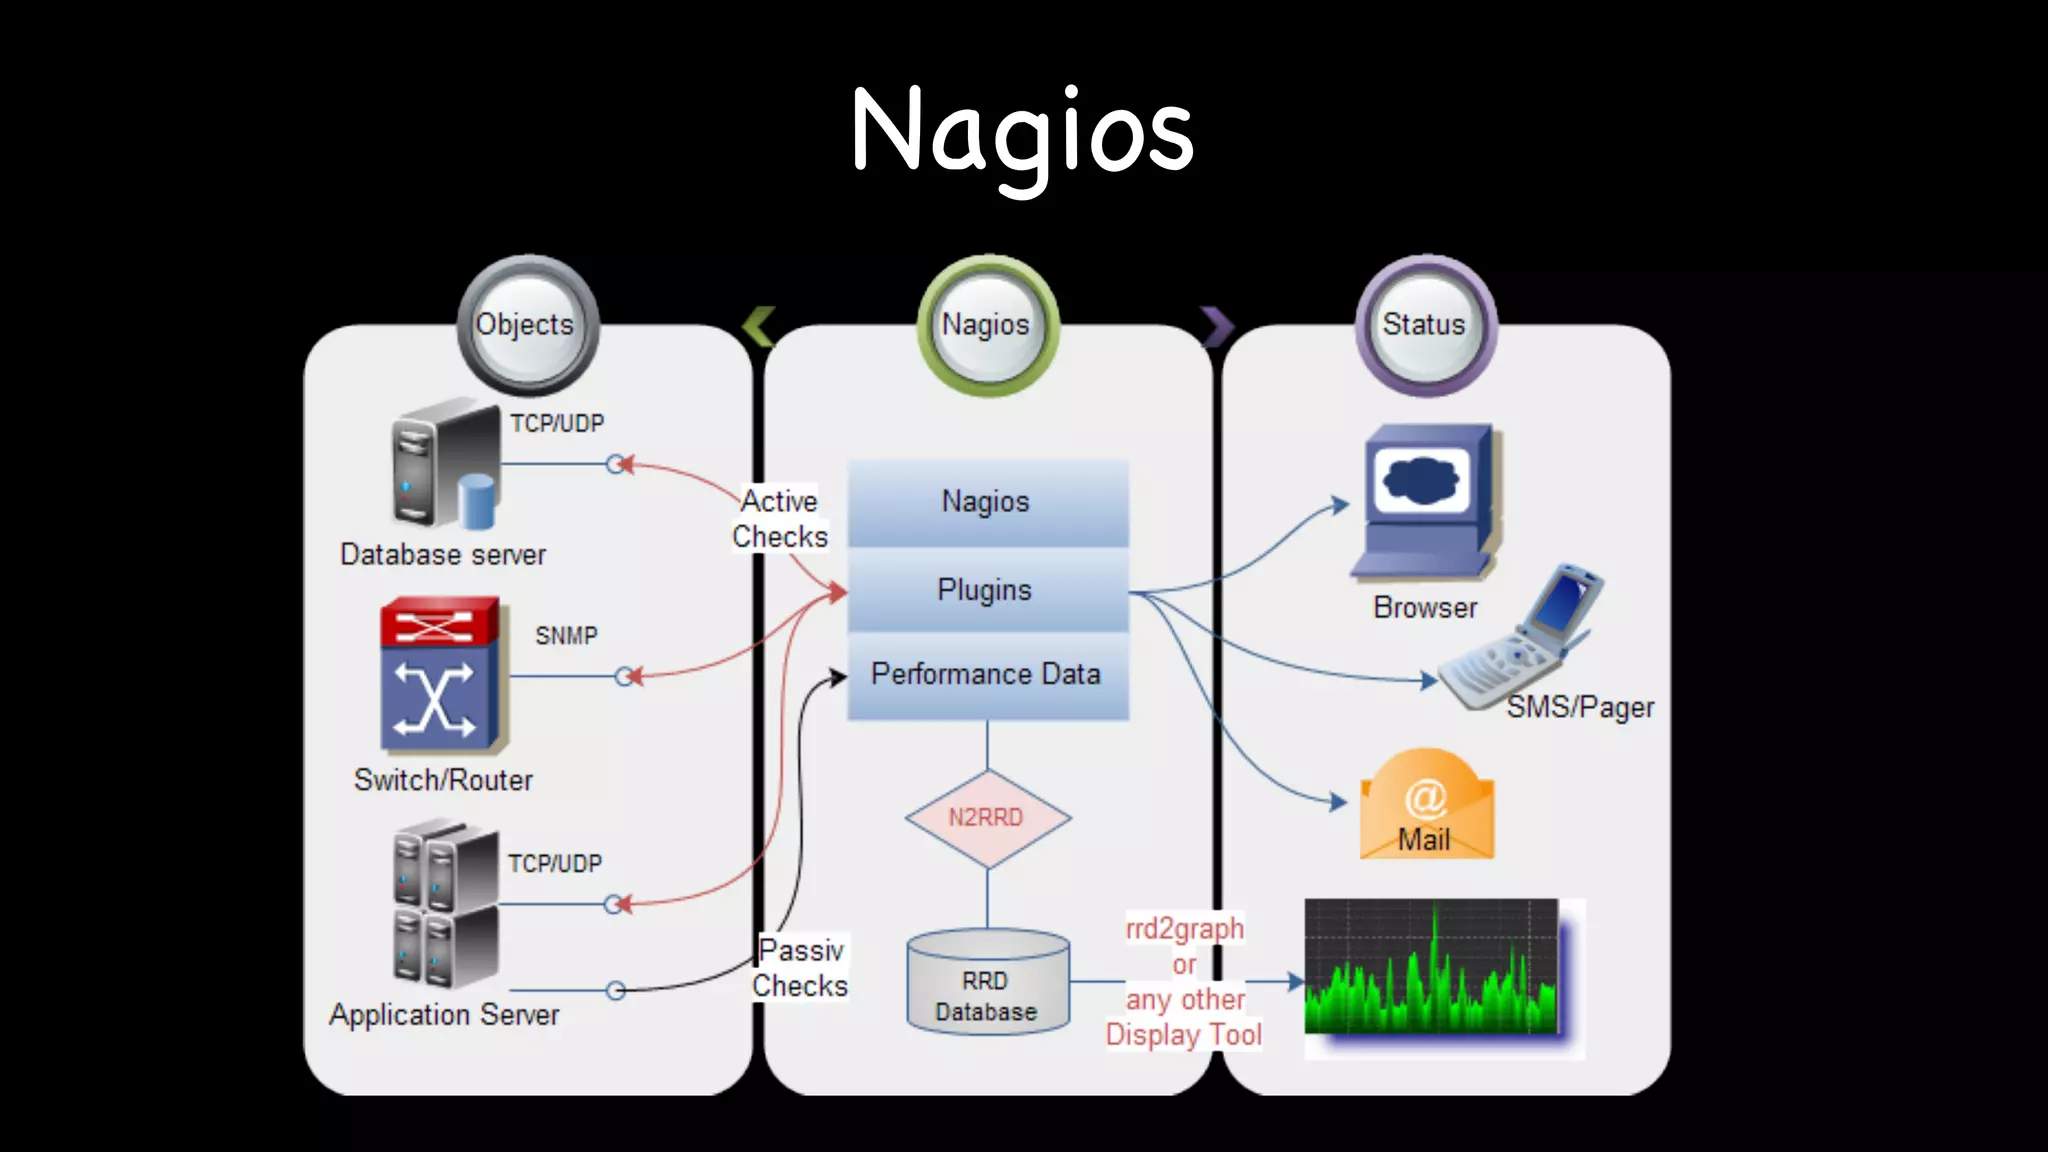
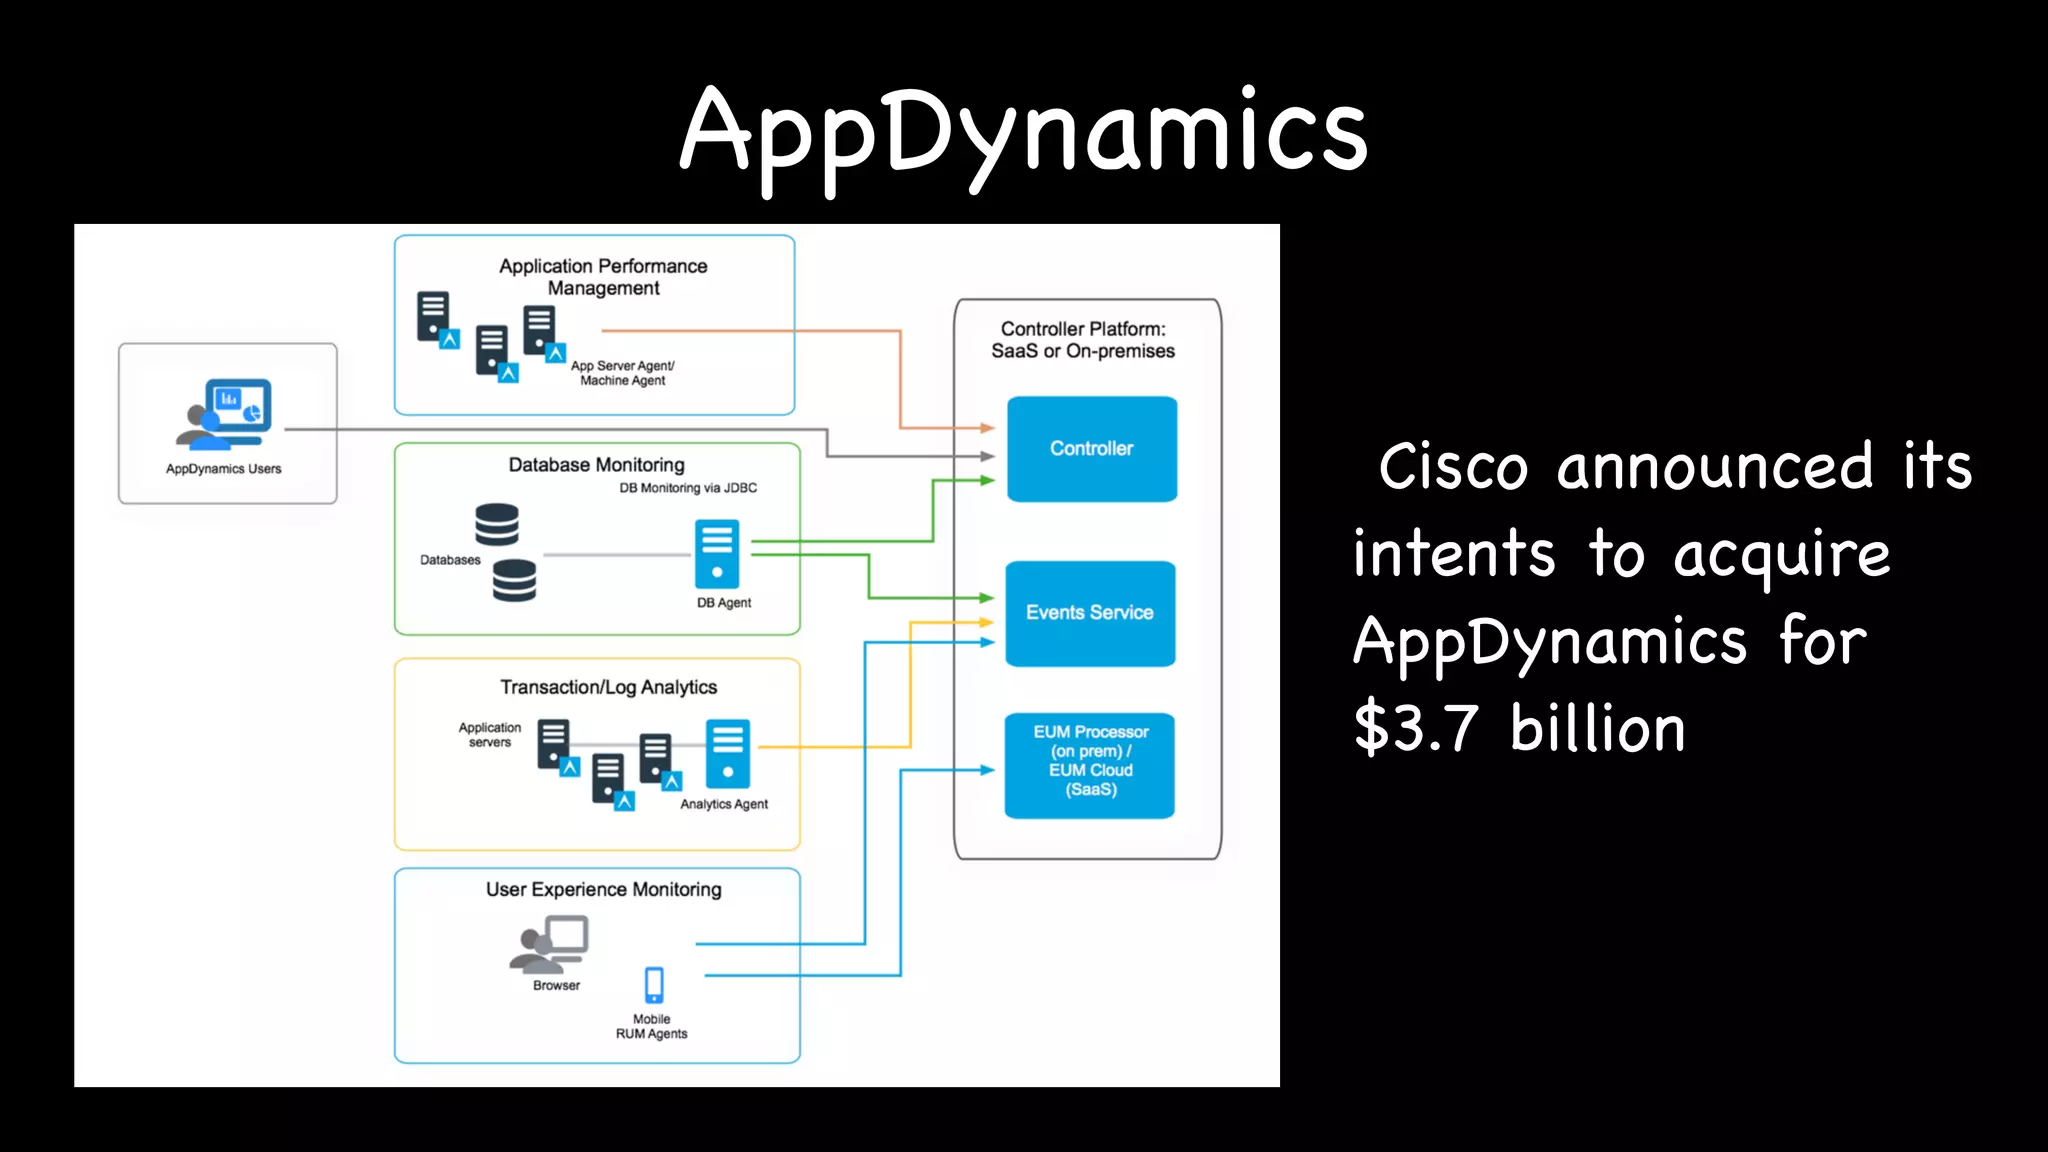
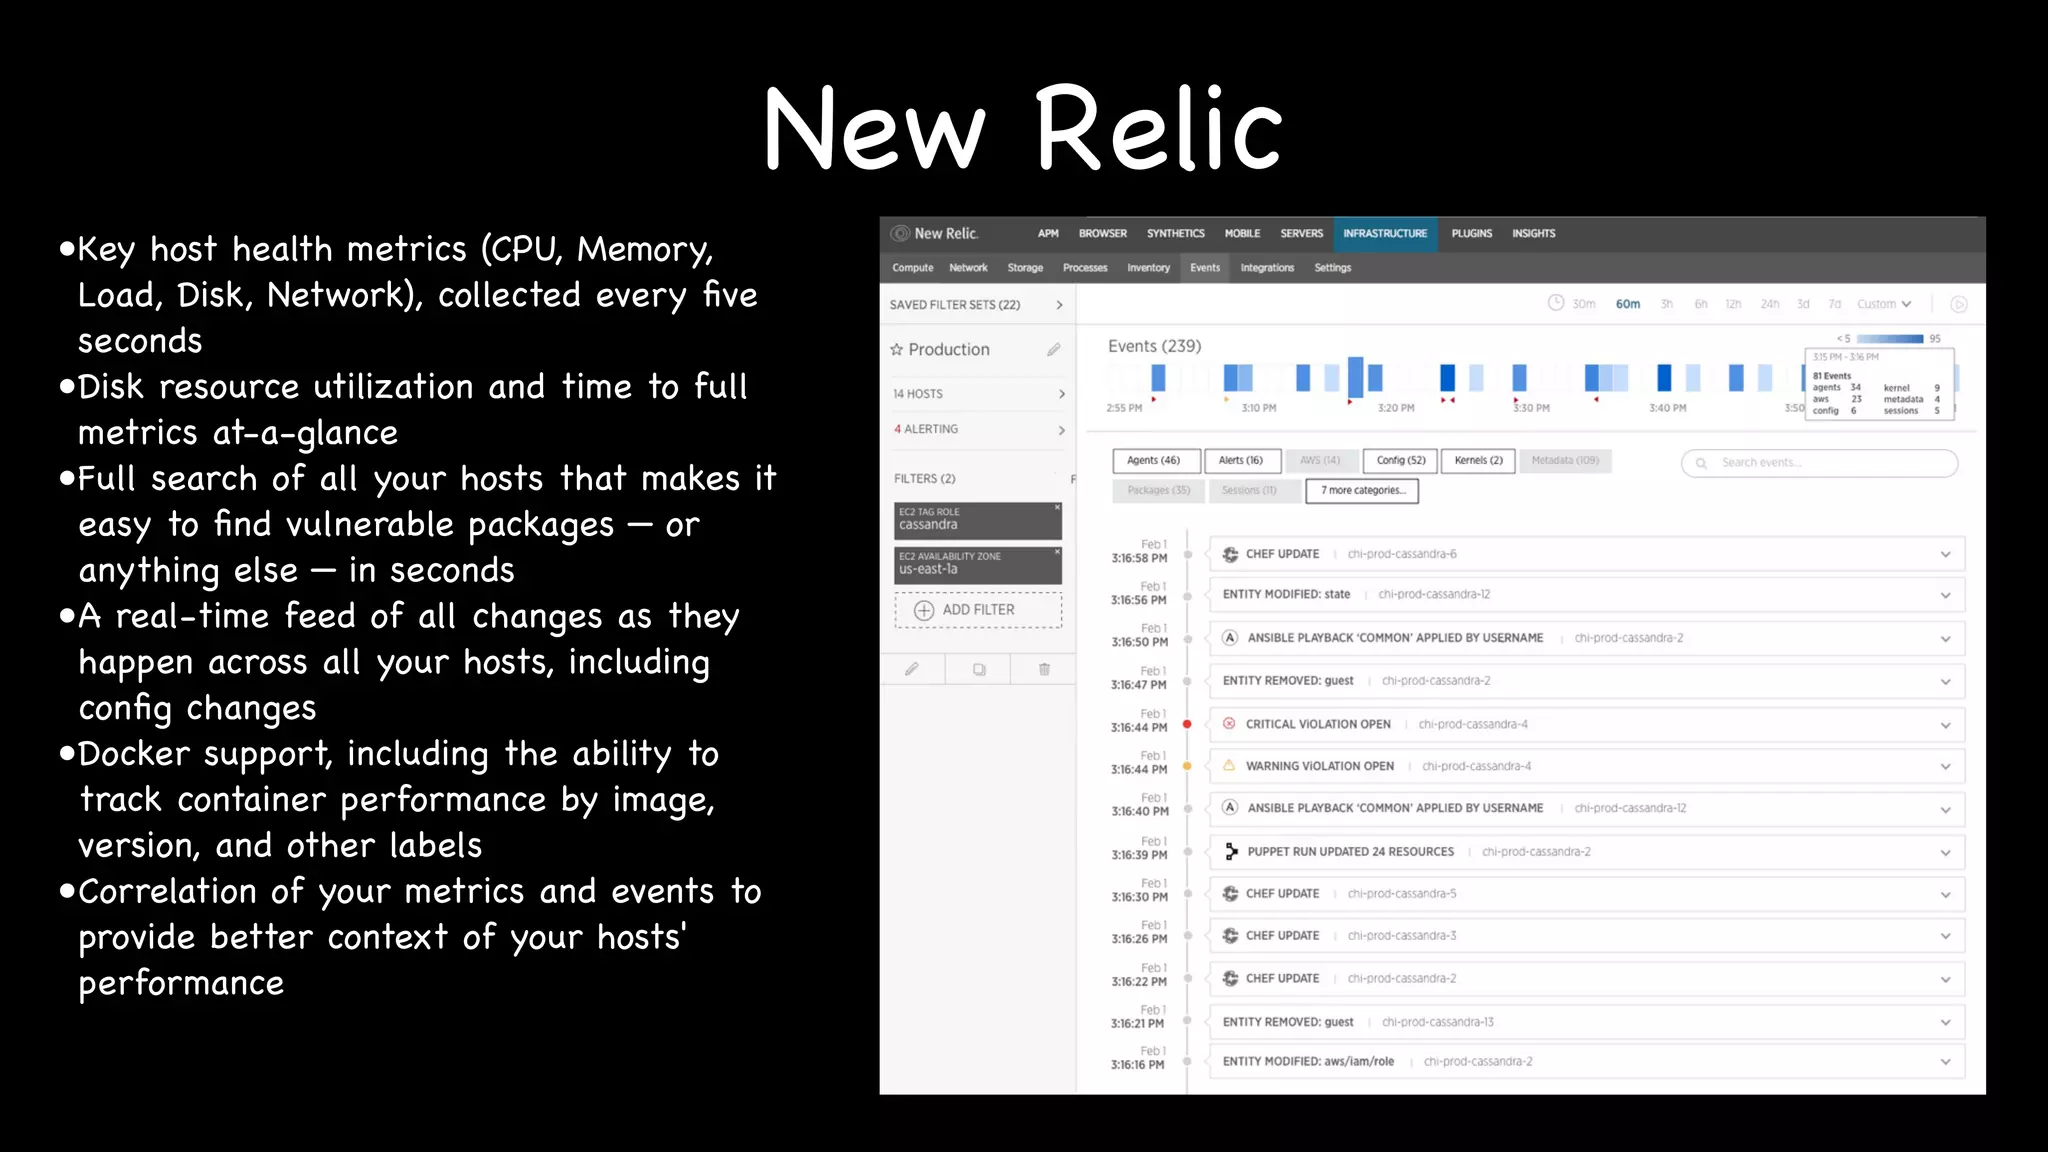
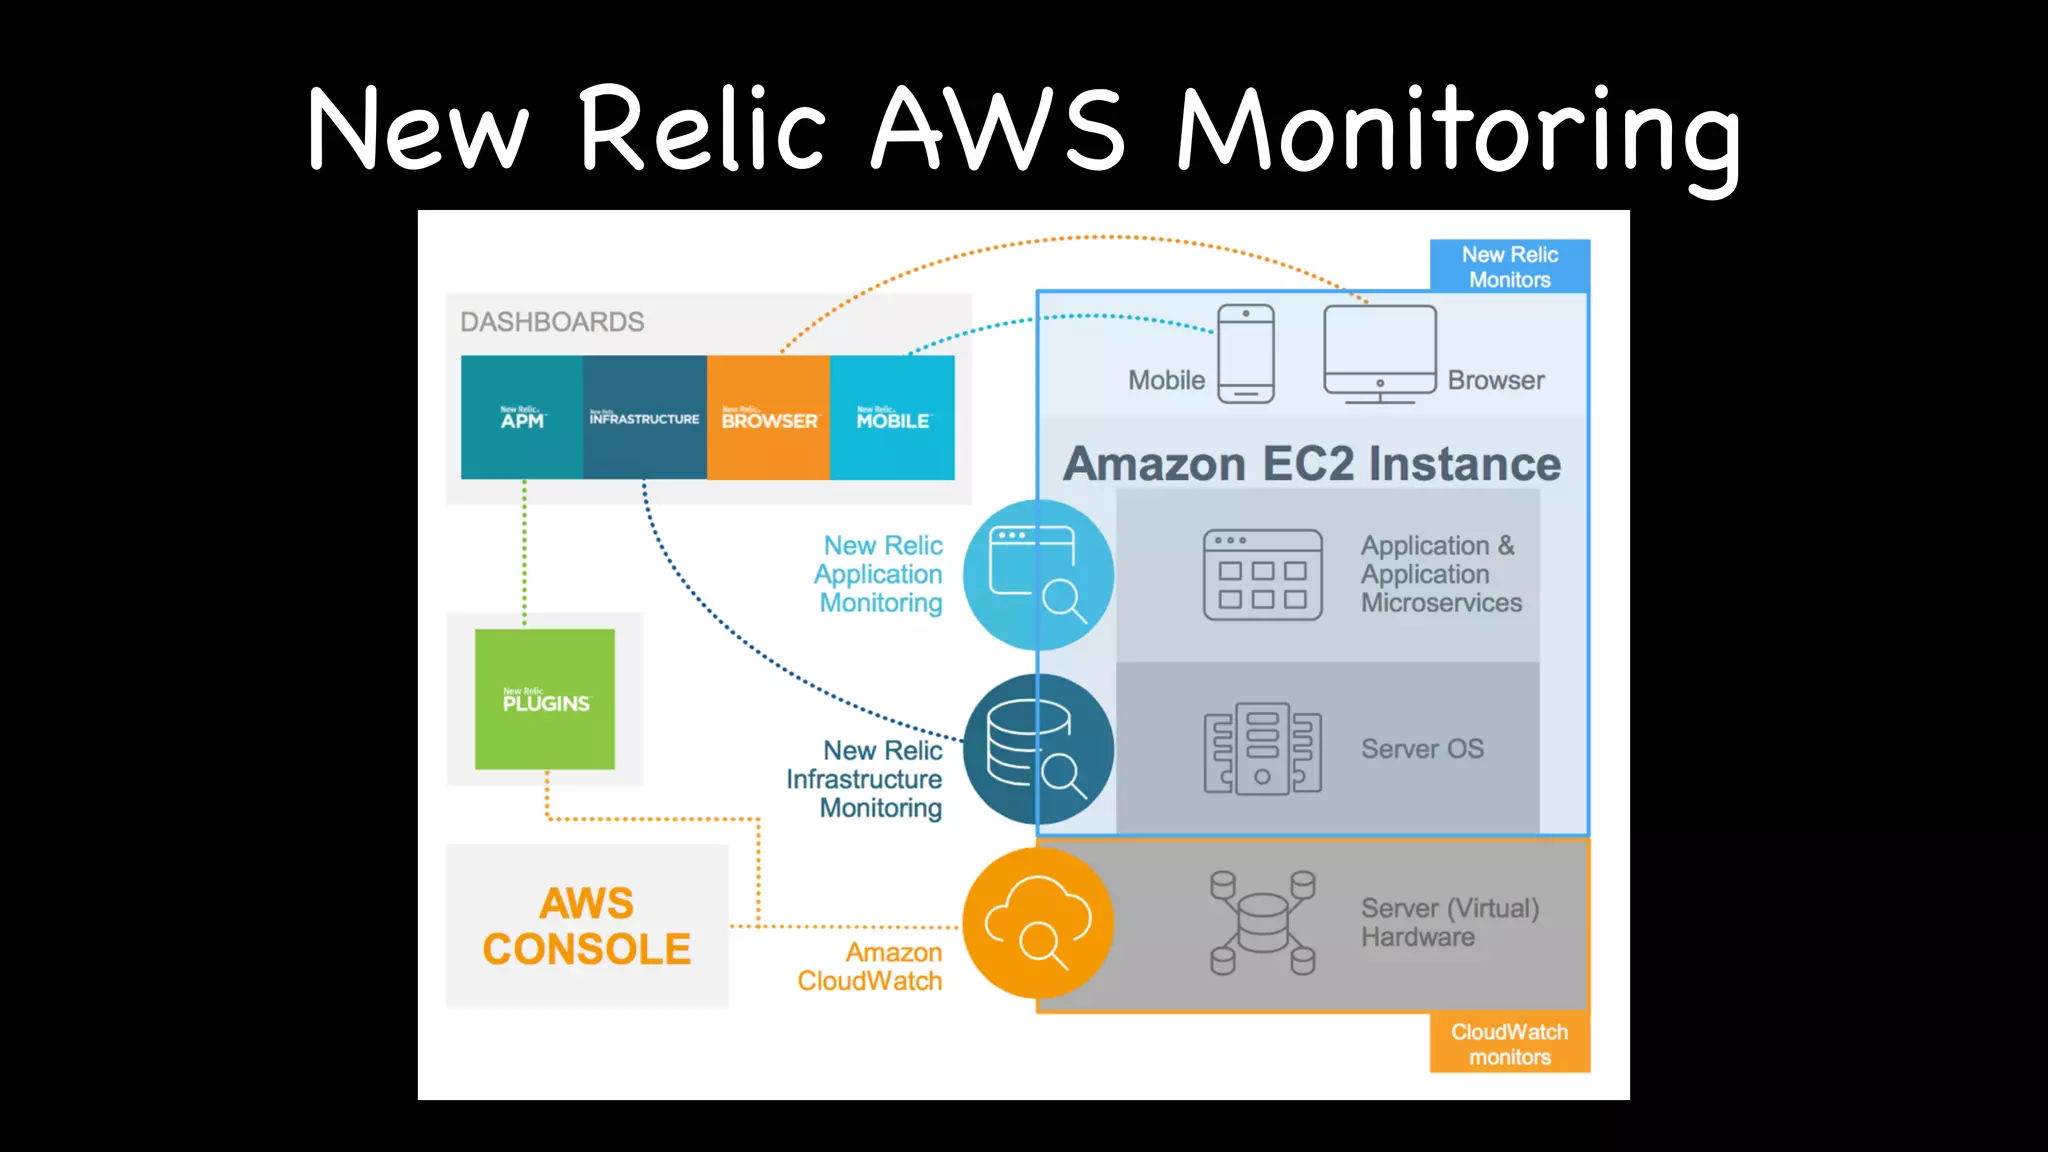
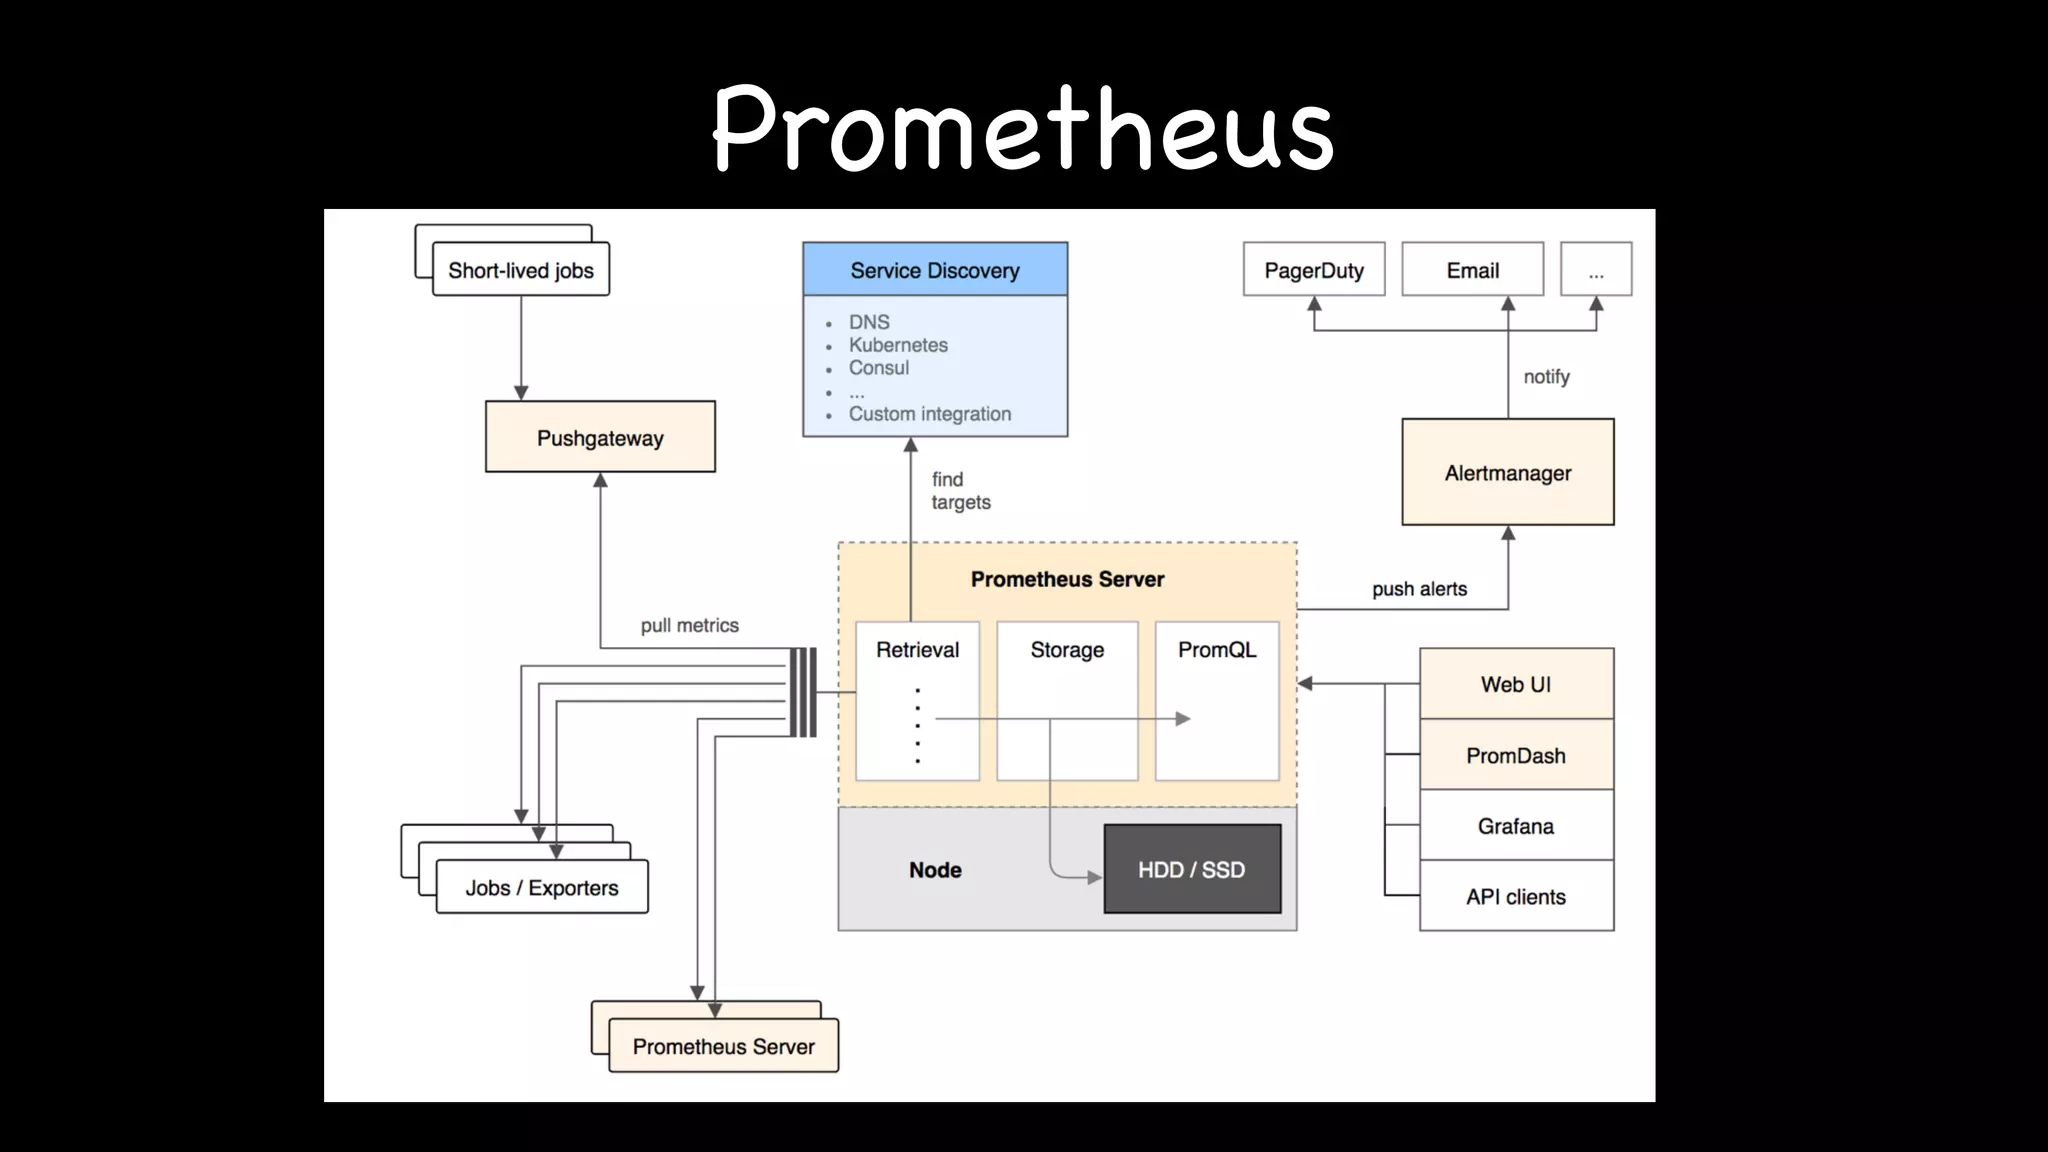

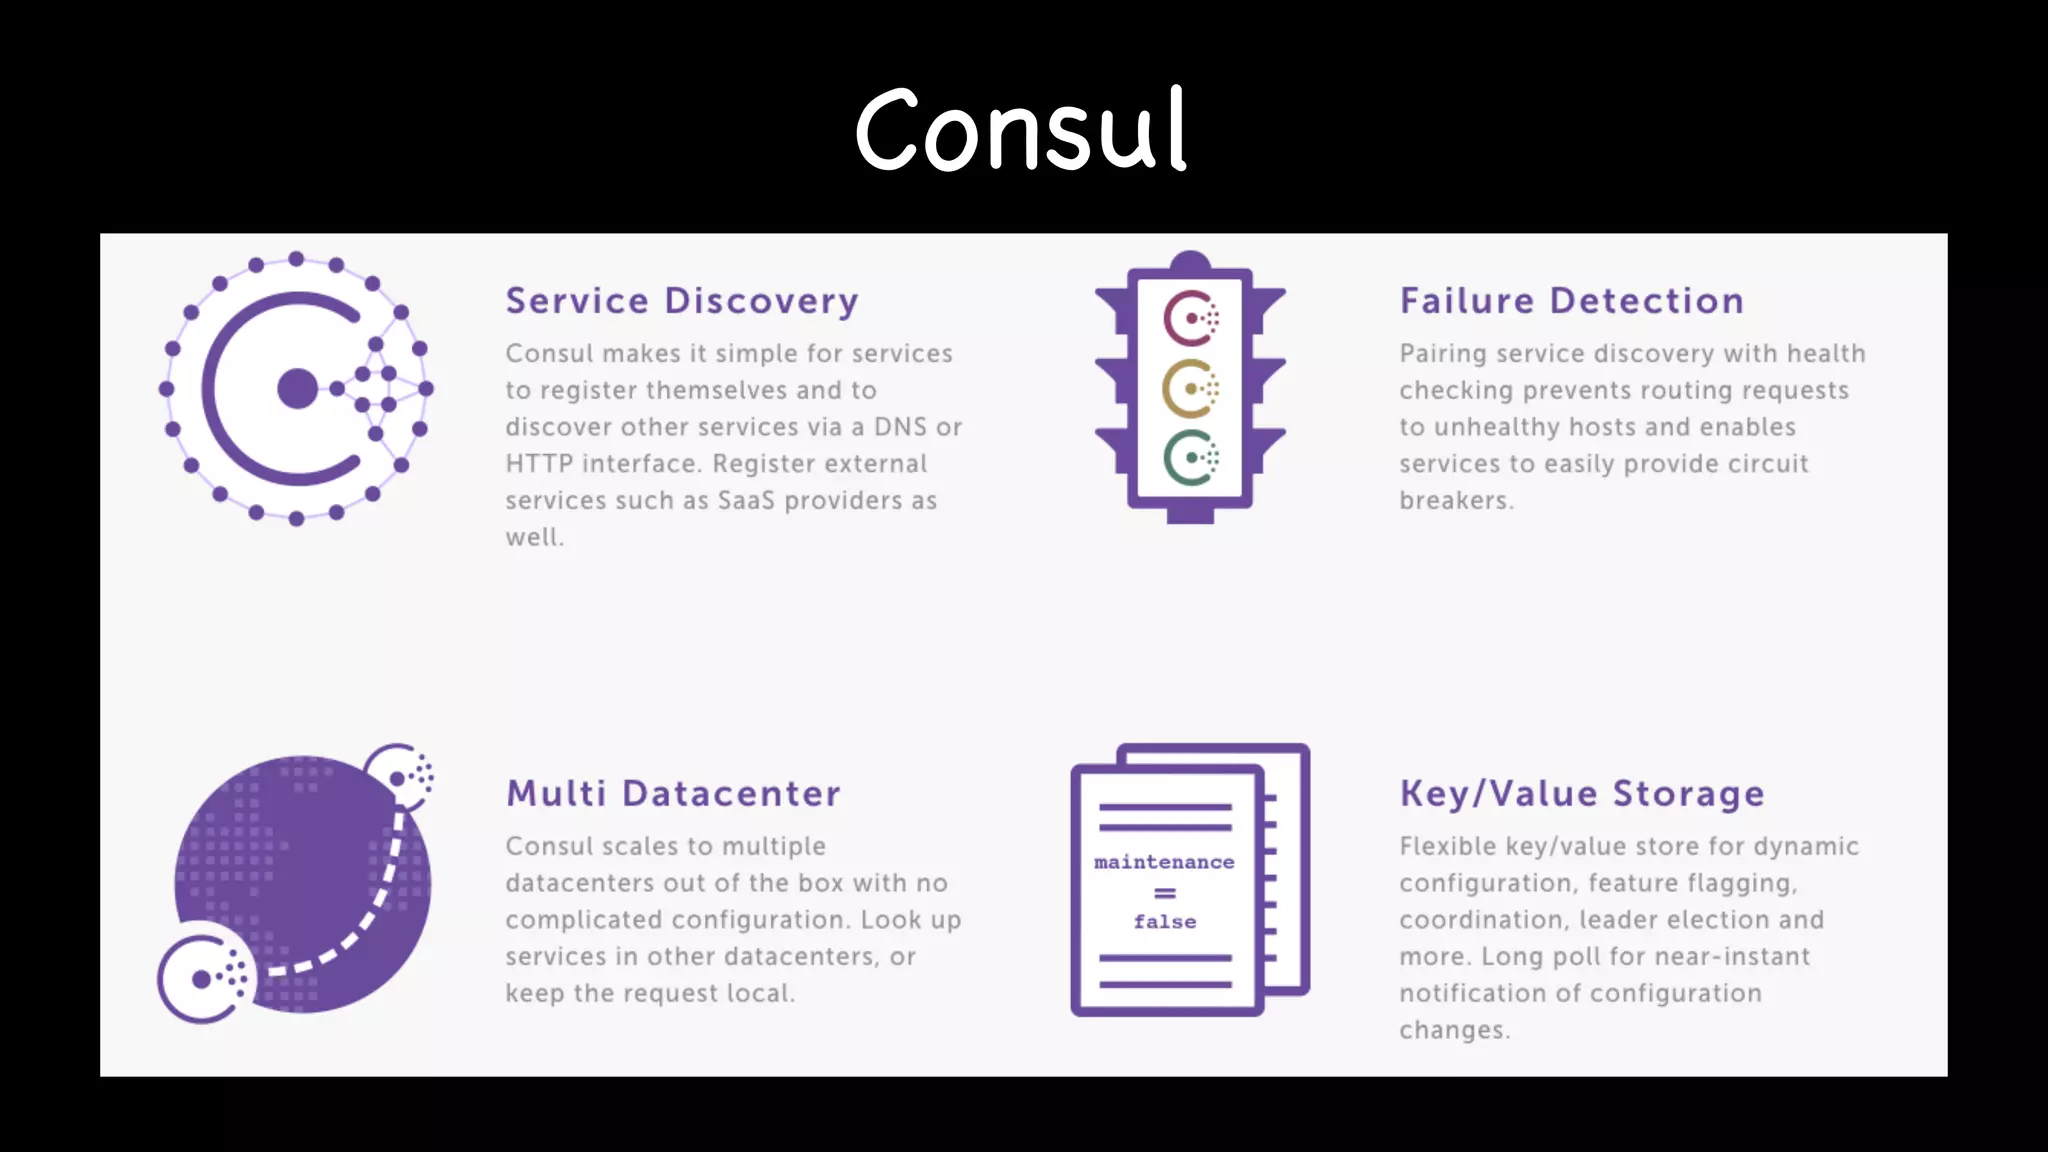
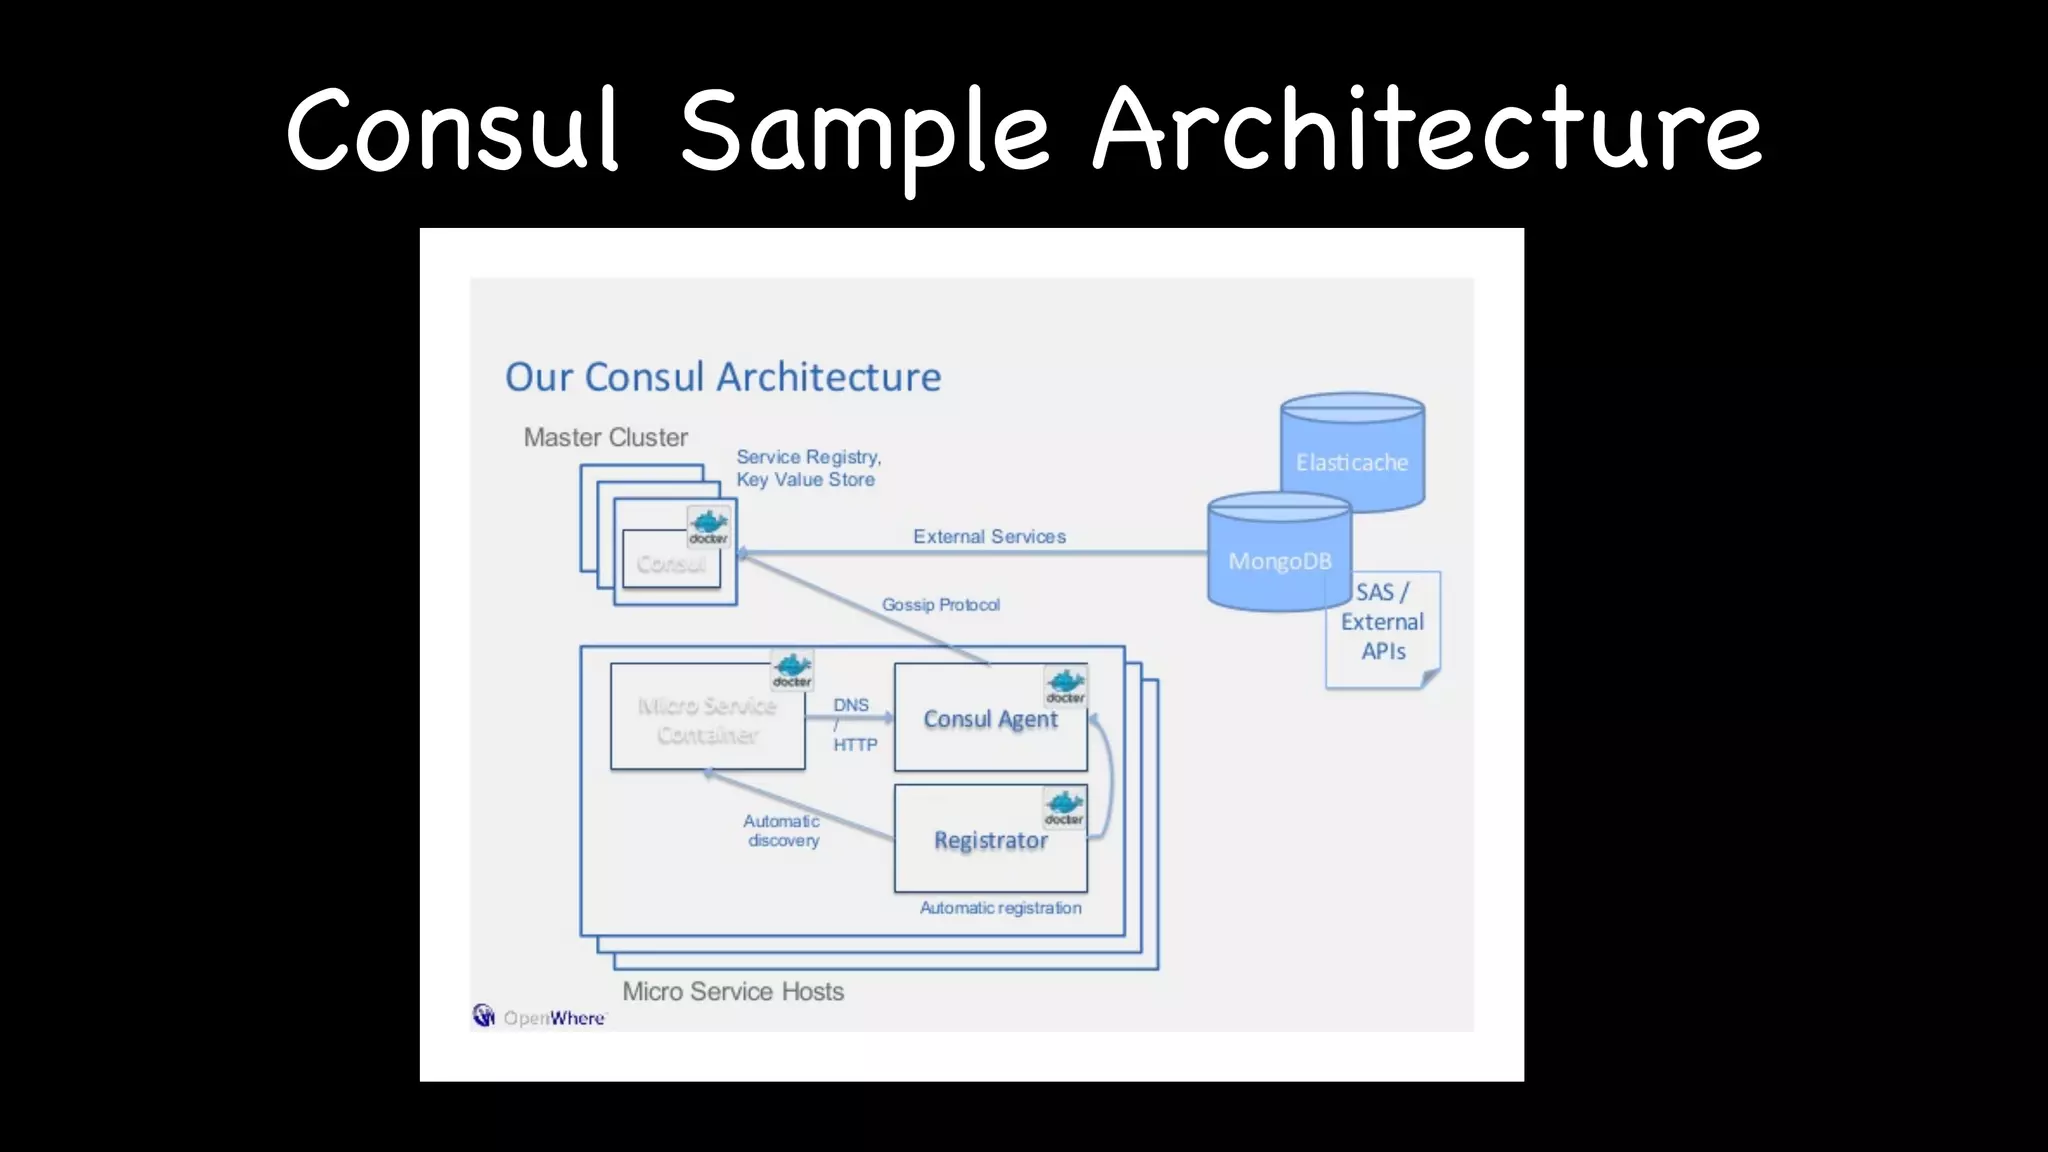

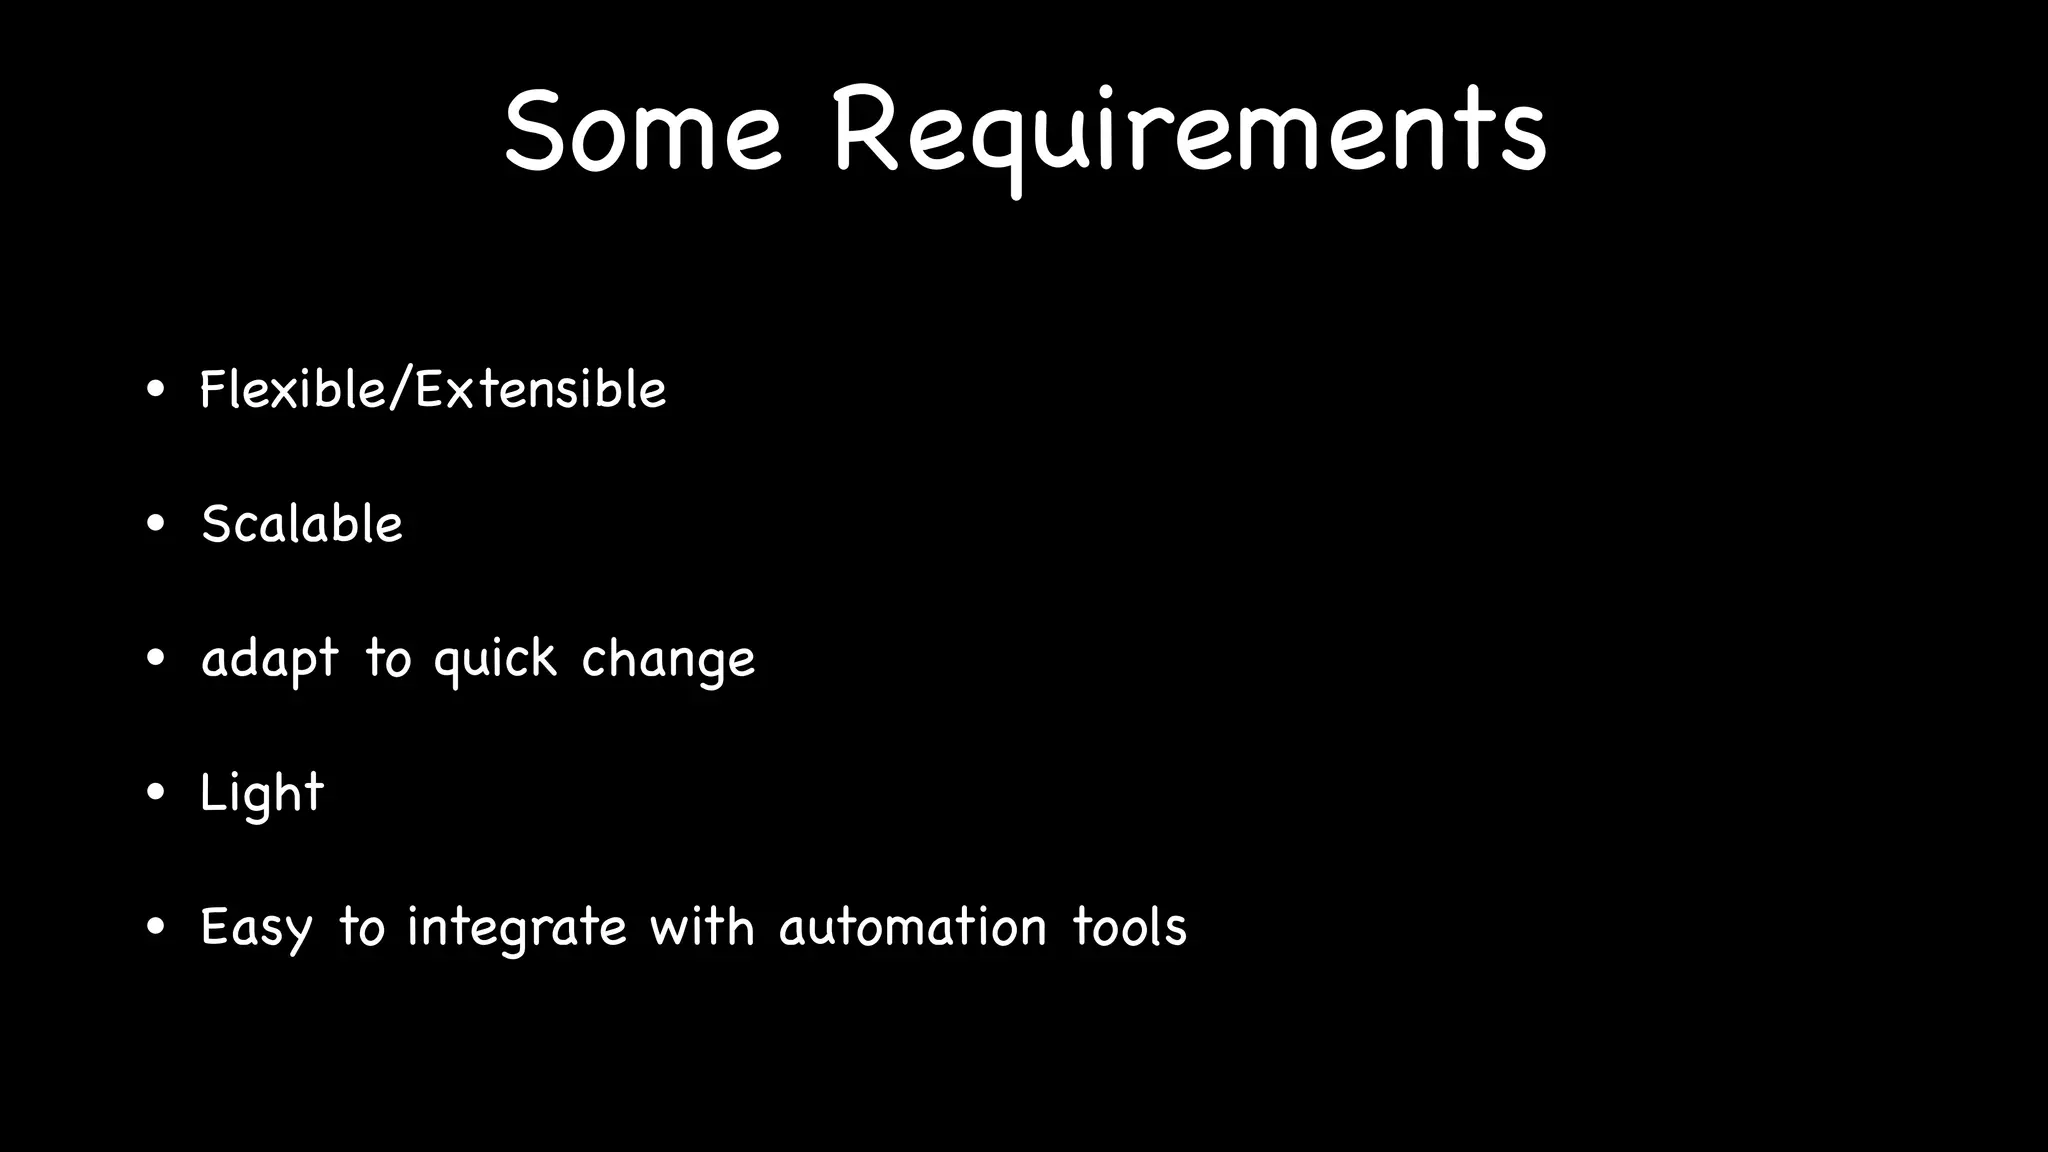

This document discusses cloud monitoring and different monitoring tools. It notes that cloud monitoring is different due to changing and dynamic cloud environments. It then lists several traditional monitoring tools like IBM Tivoli, HP Openview, and Nagios. It also discusses newer application performance monitoring tools like AppDynamics and New Relic, and infrastructure monitoring tools like Prometheus, Consul, and New Relic AWS Monitoring. The document suggests cloud monitoring tools need to be flexible, scalable, adaptable to change, lightweight, and integrate easily with automation.


![Monitoring the Dynamic Nature of the Cloud [FutureStack16 NYC]](https://cdn.slidesharecdn.com/ss_thumbnails/futurestack-nymonitoringdynamicnatureofcloudatchison-160816180342-thumbnail.jpg?width=640&height=640&fit=bounds)


