Download as PDF, PPTX
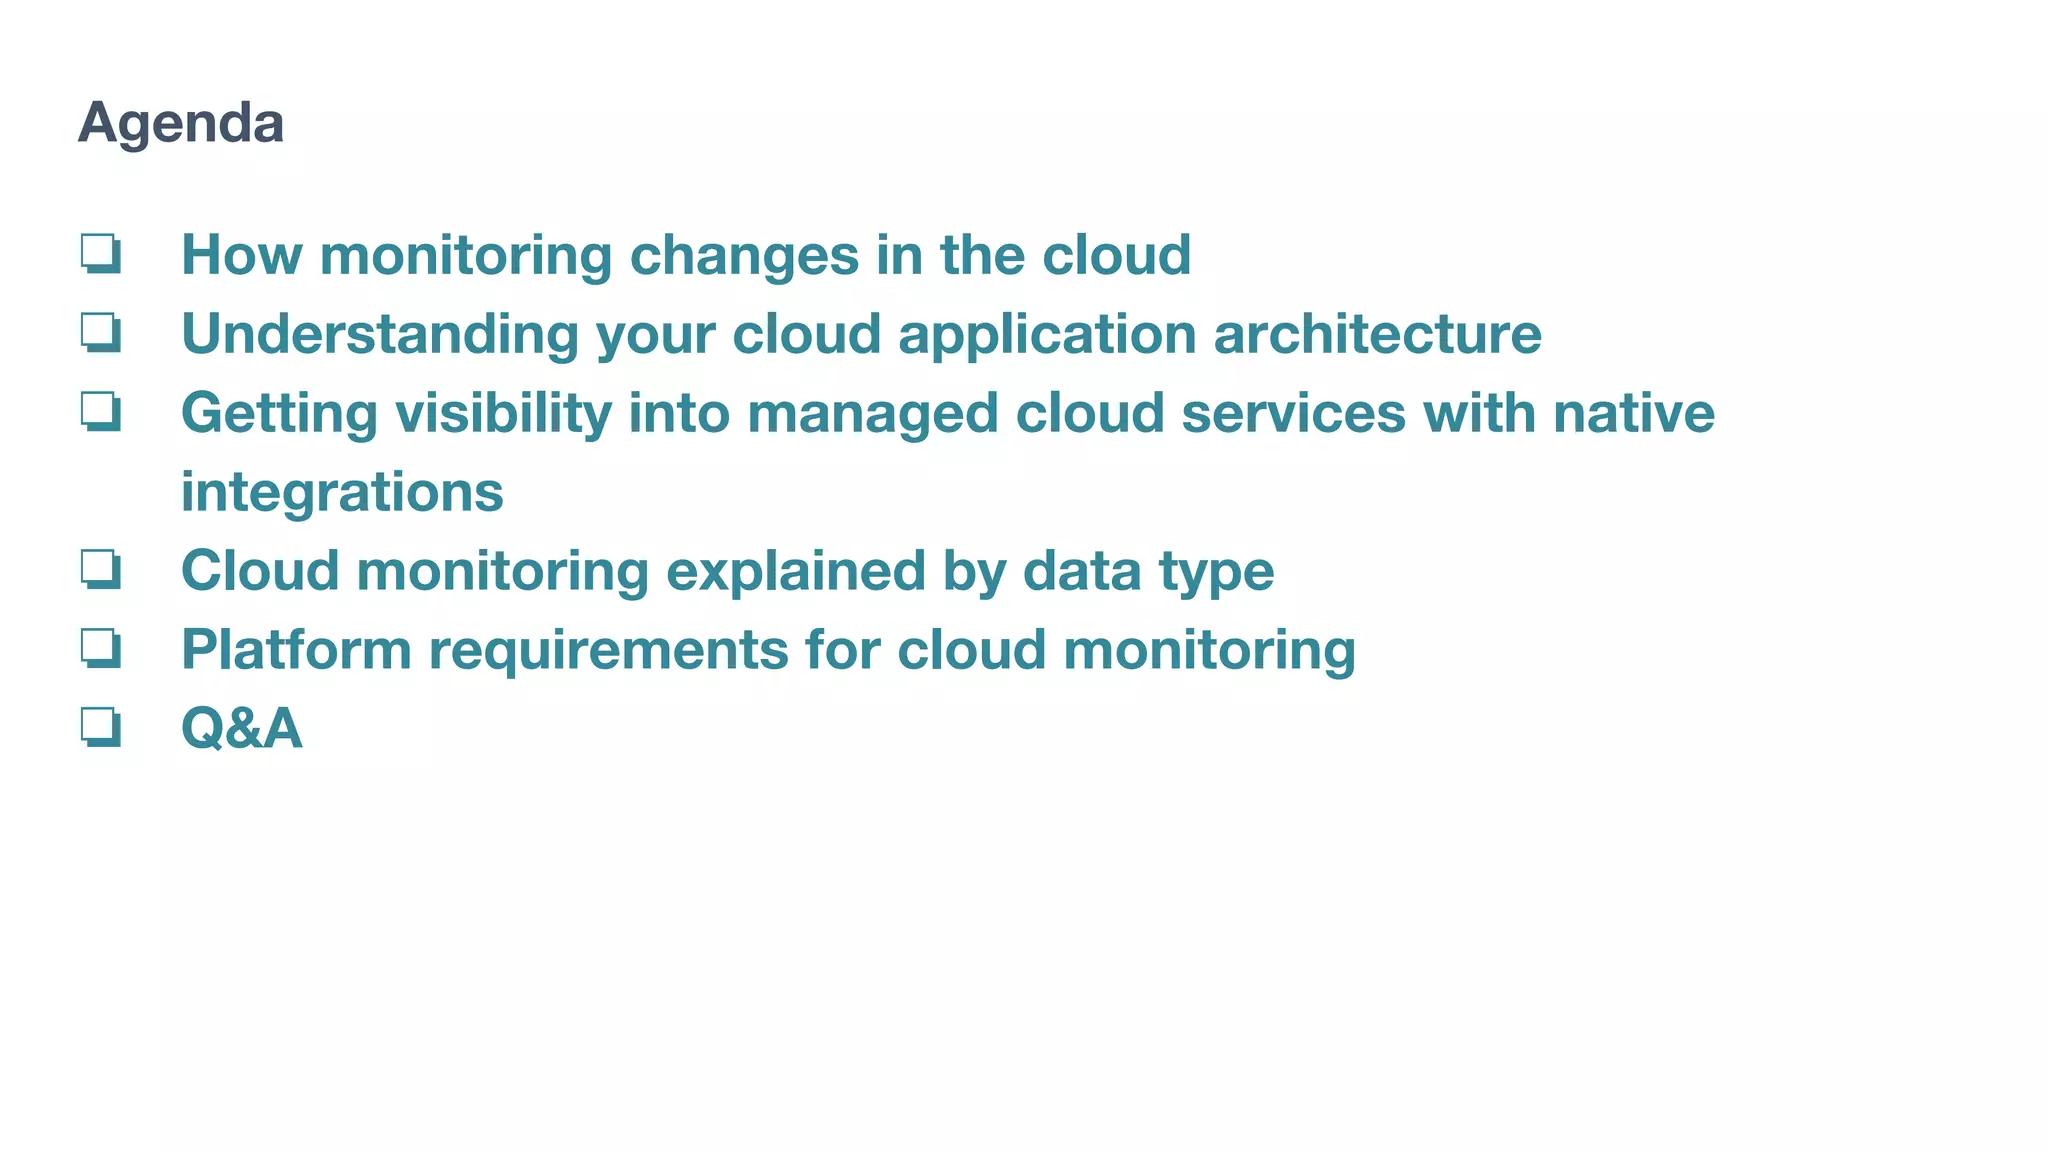
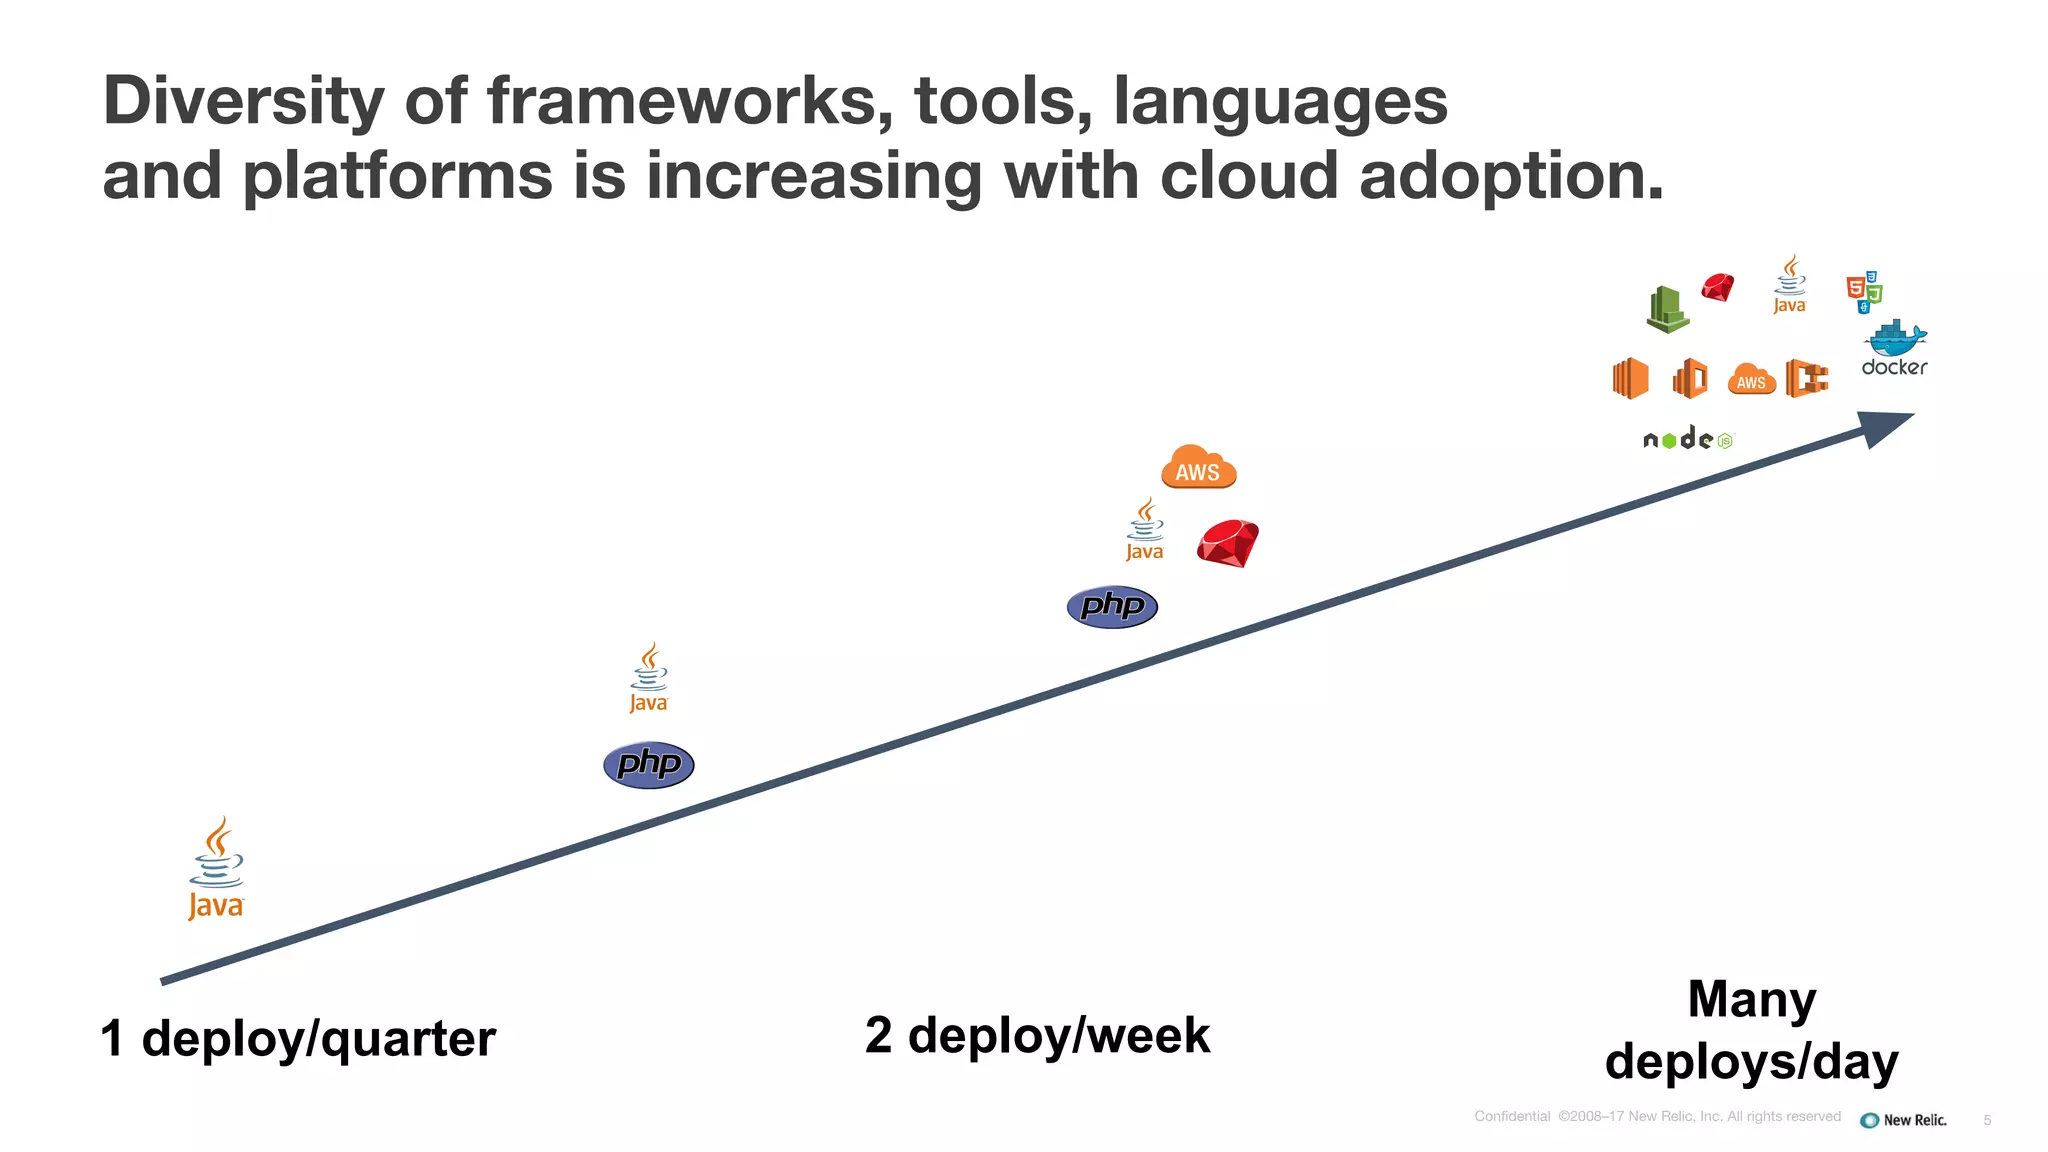
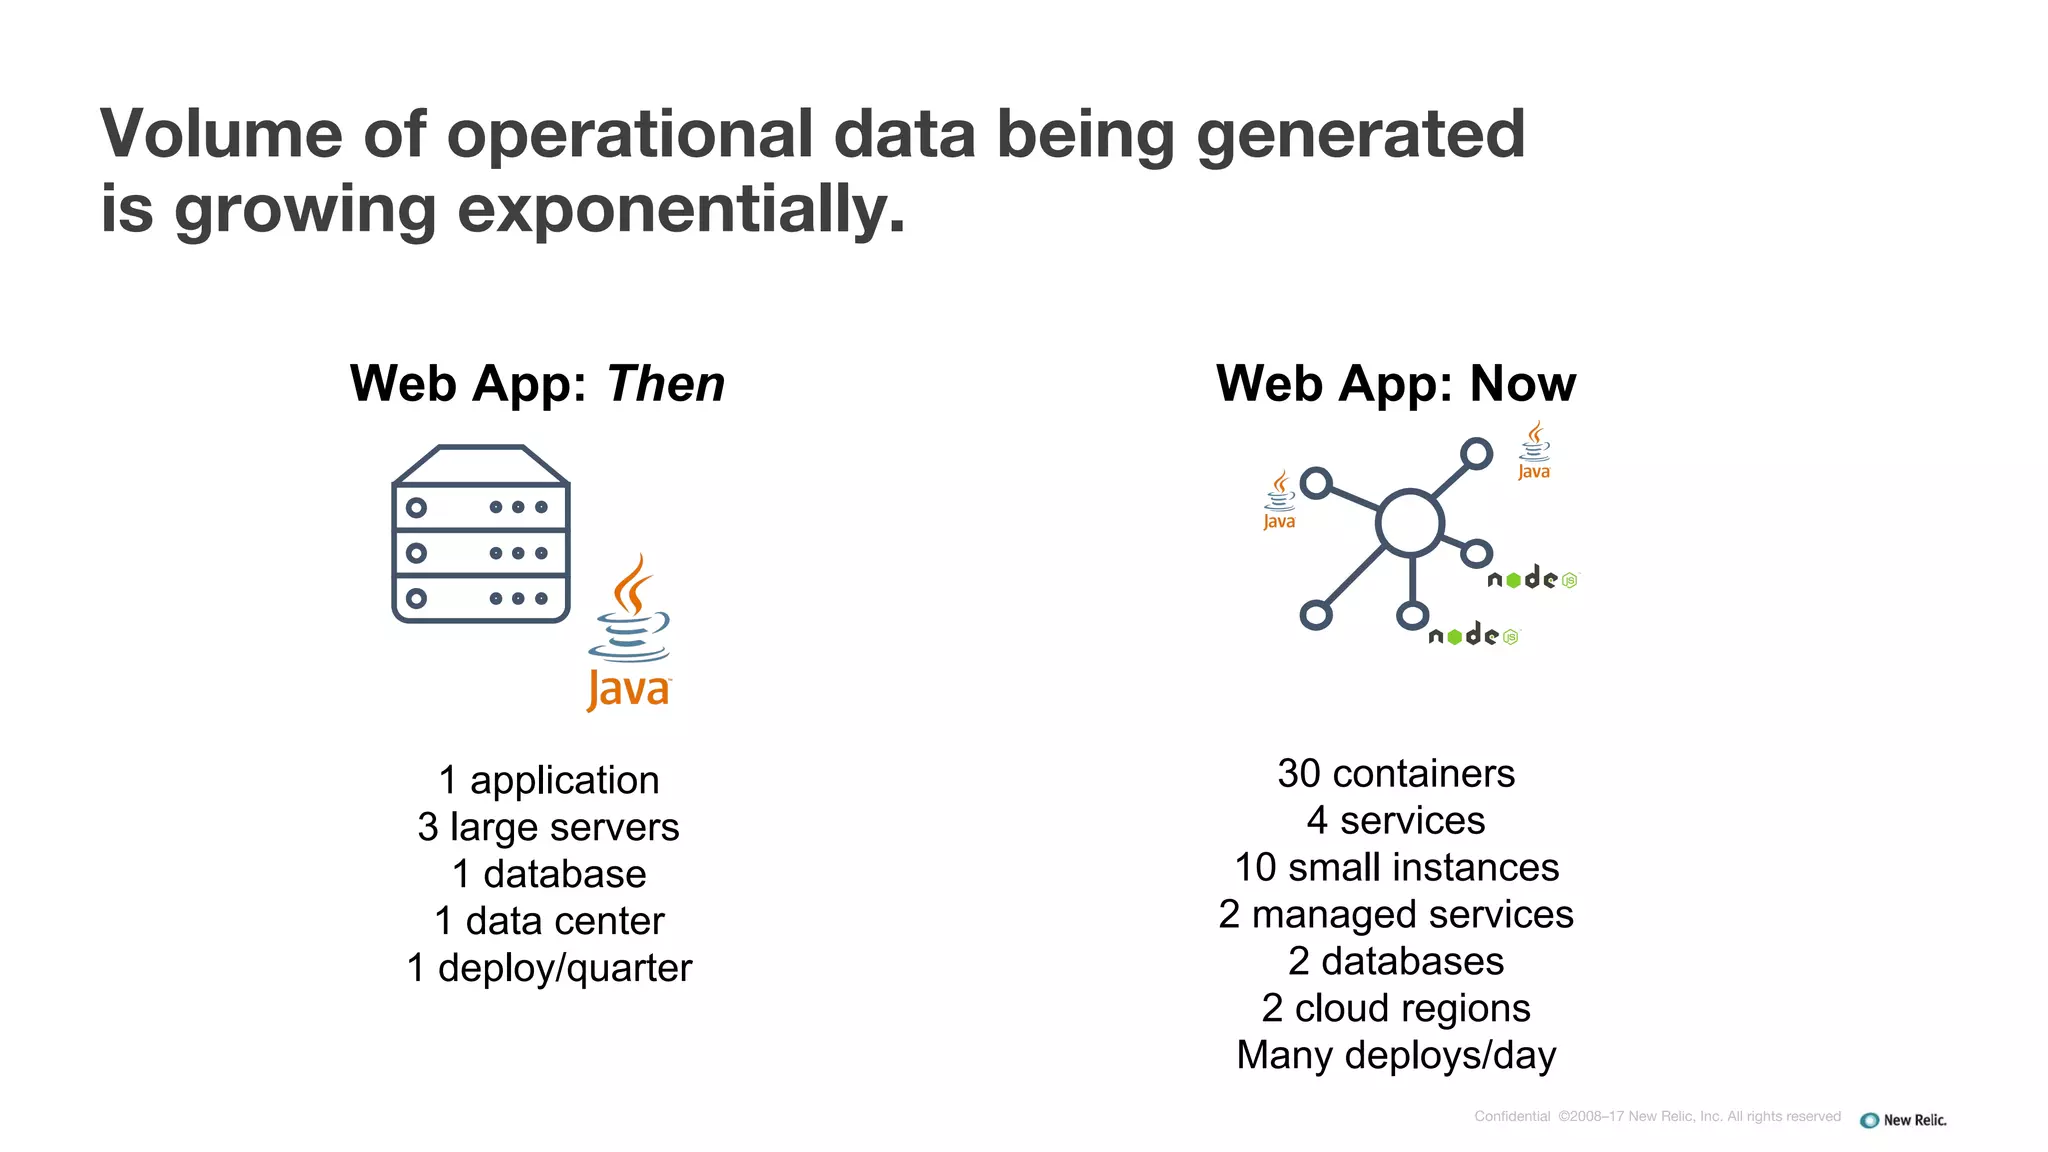
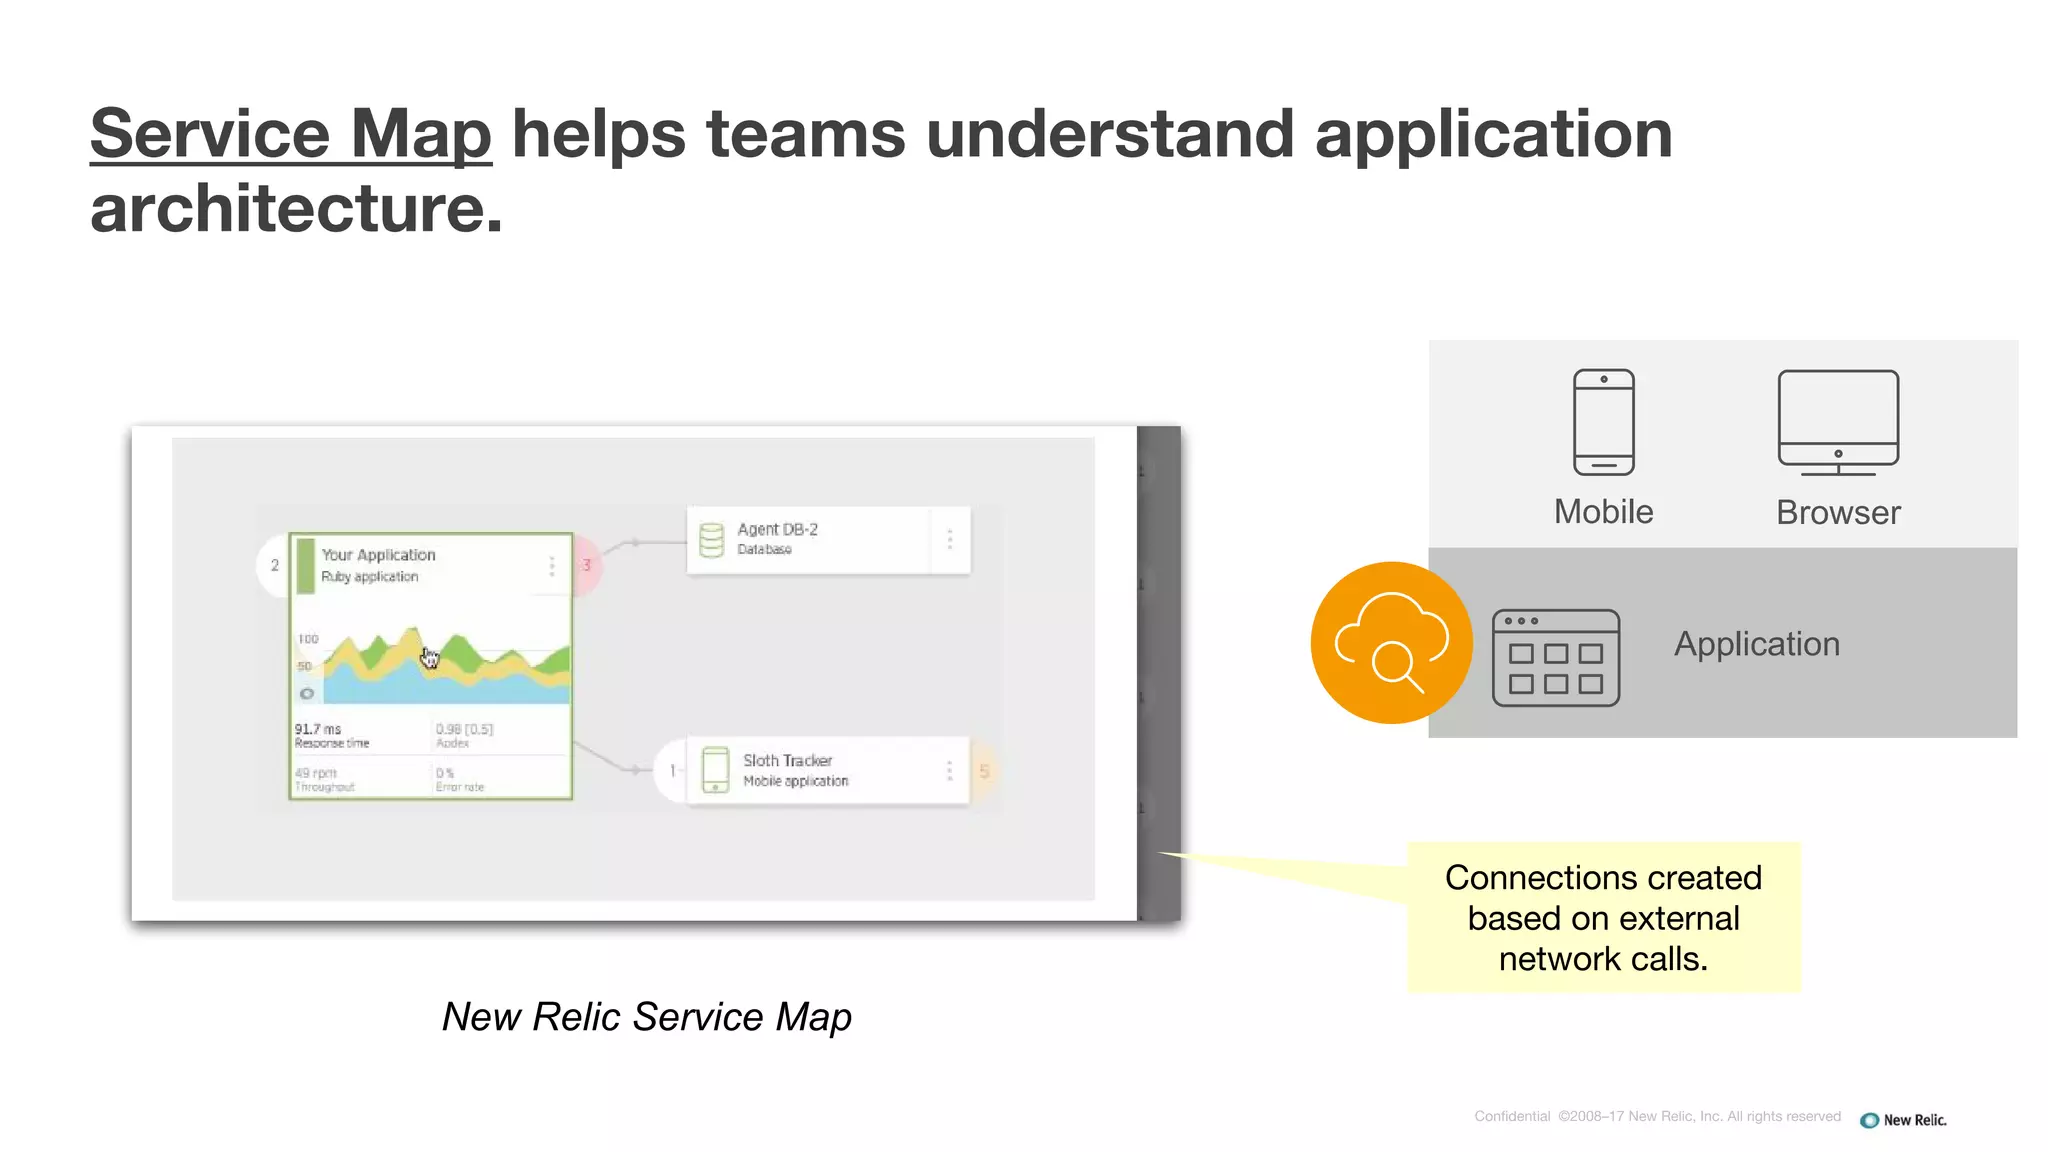
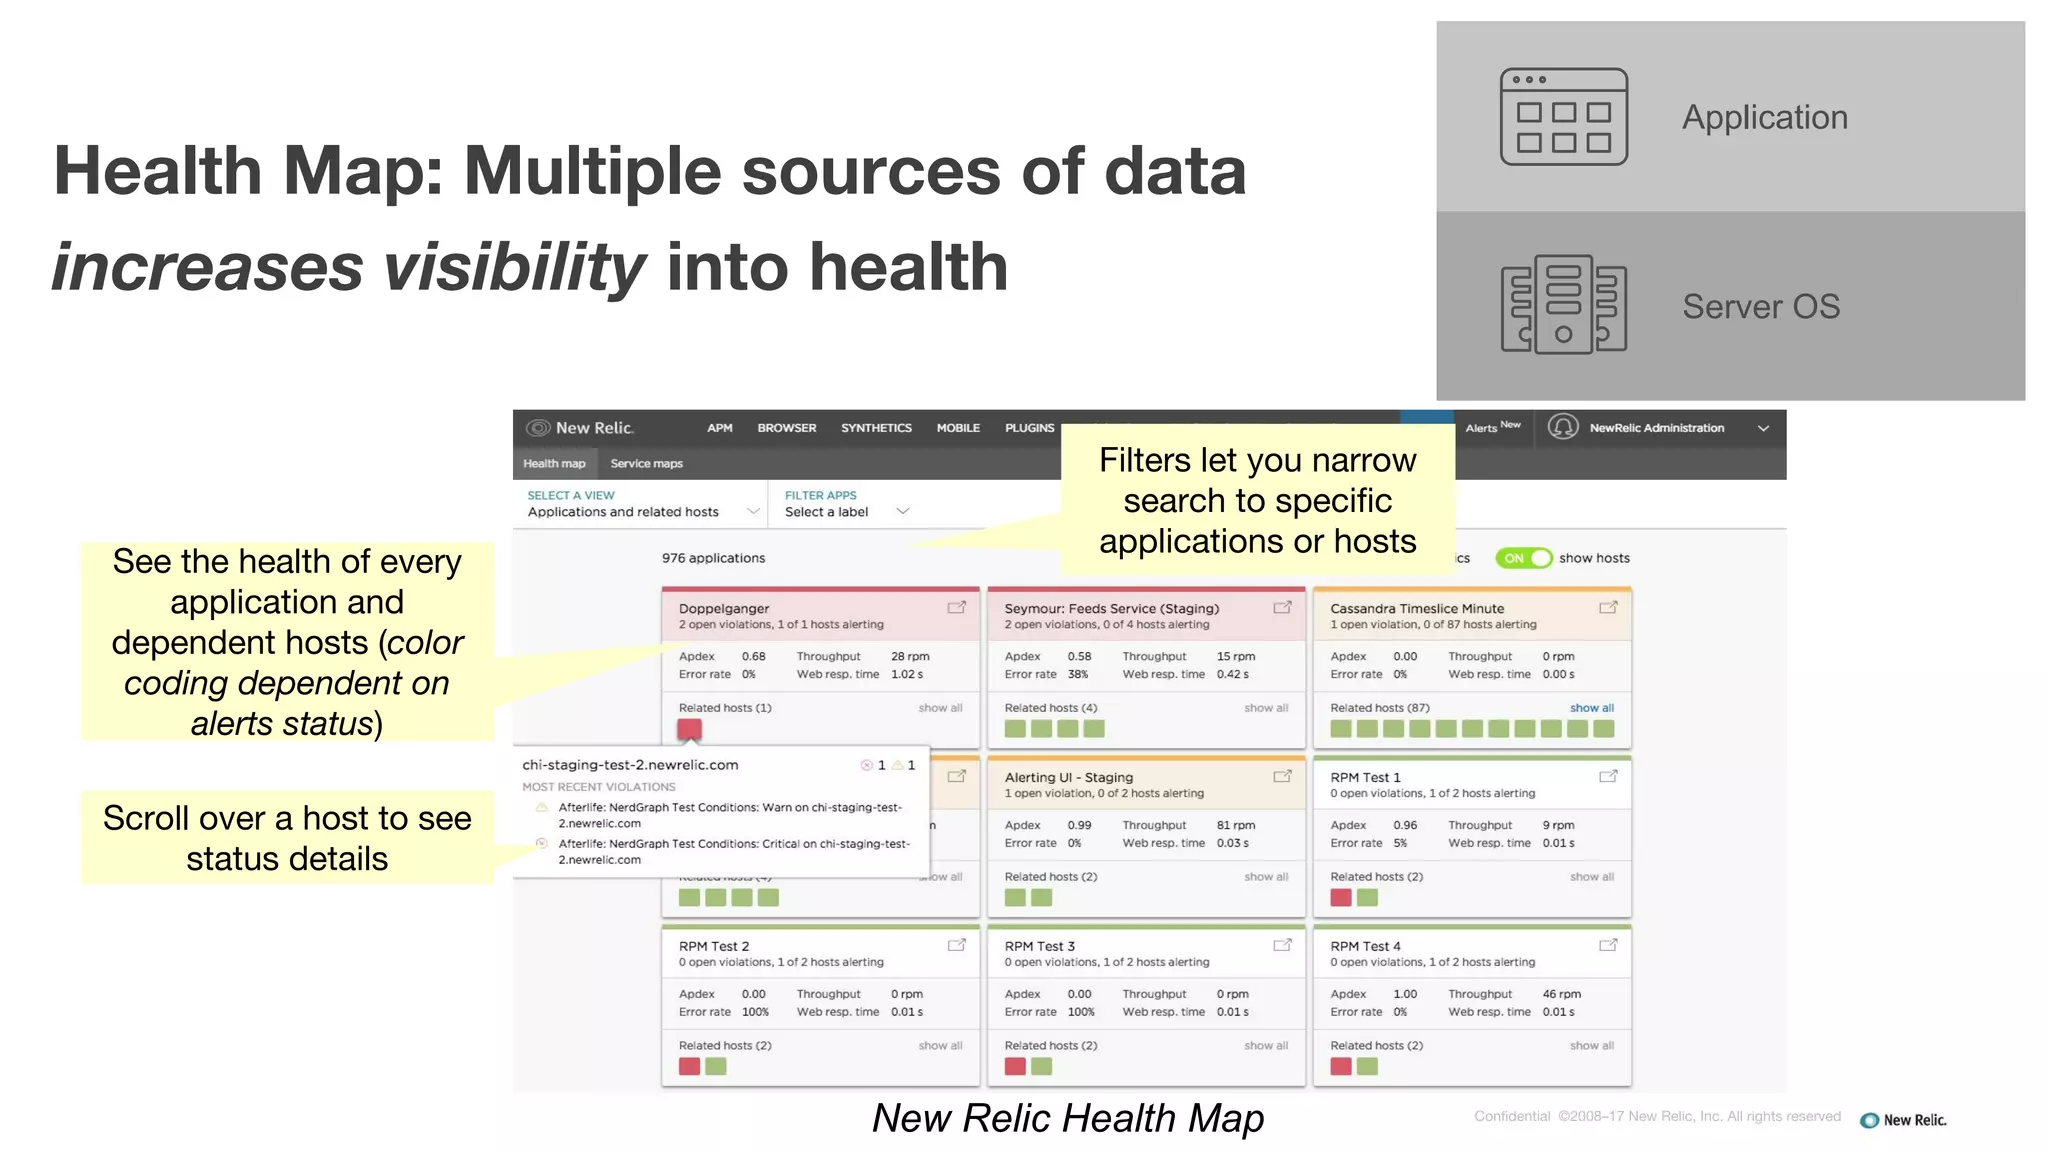
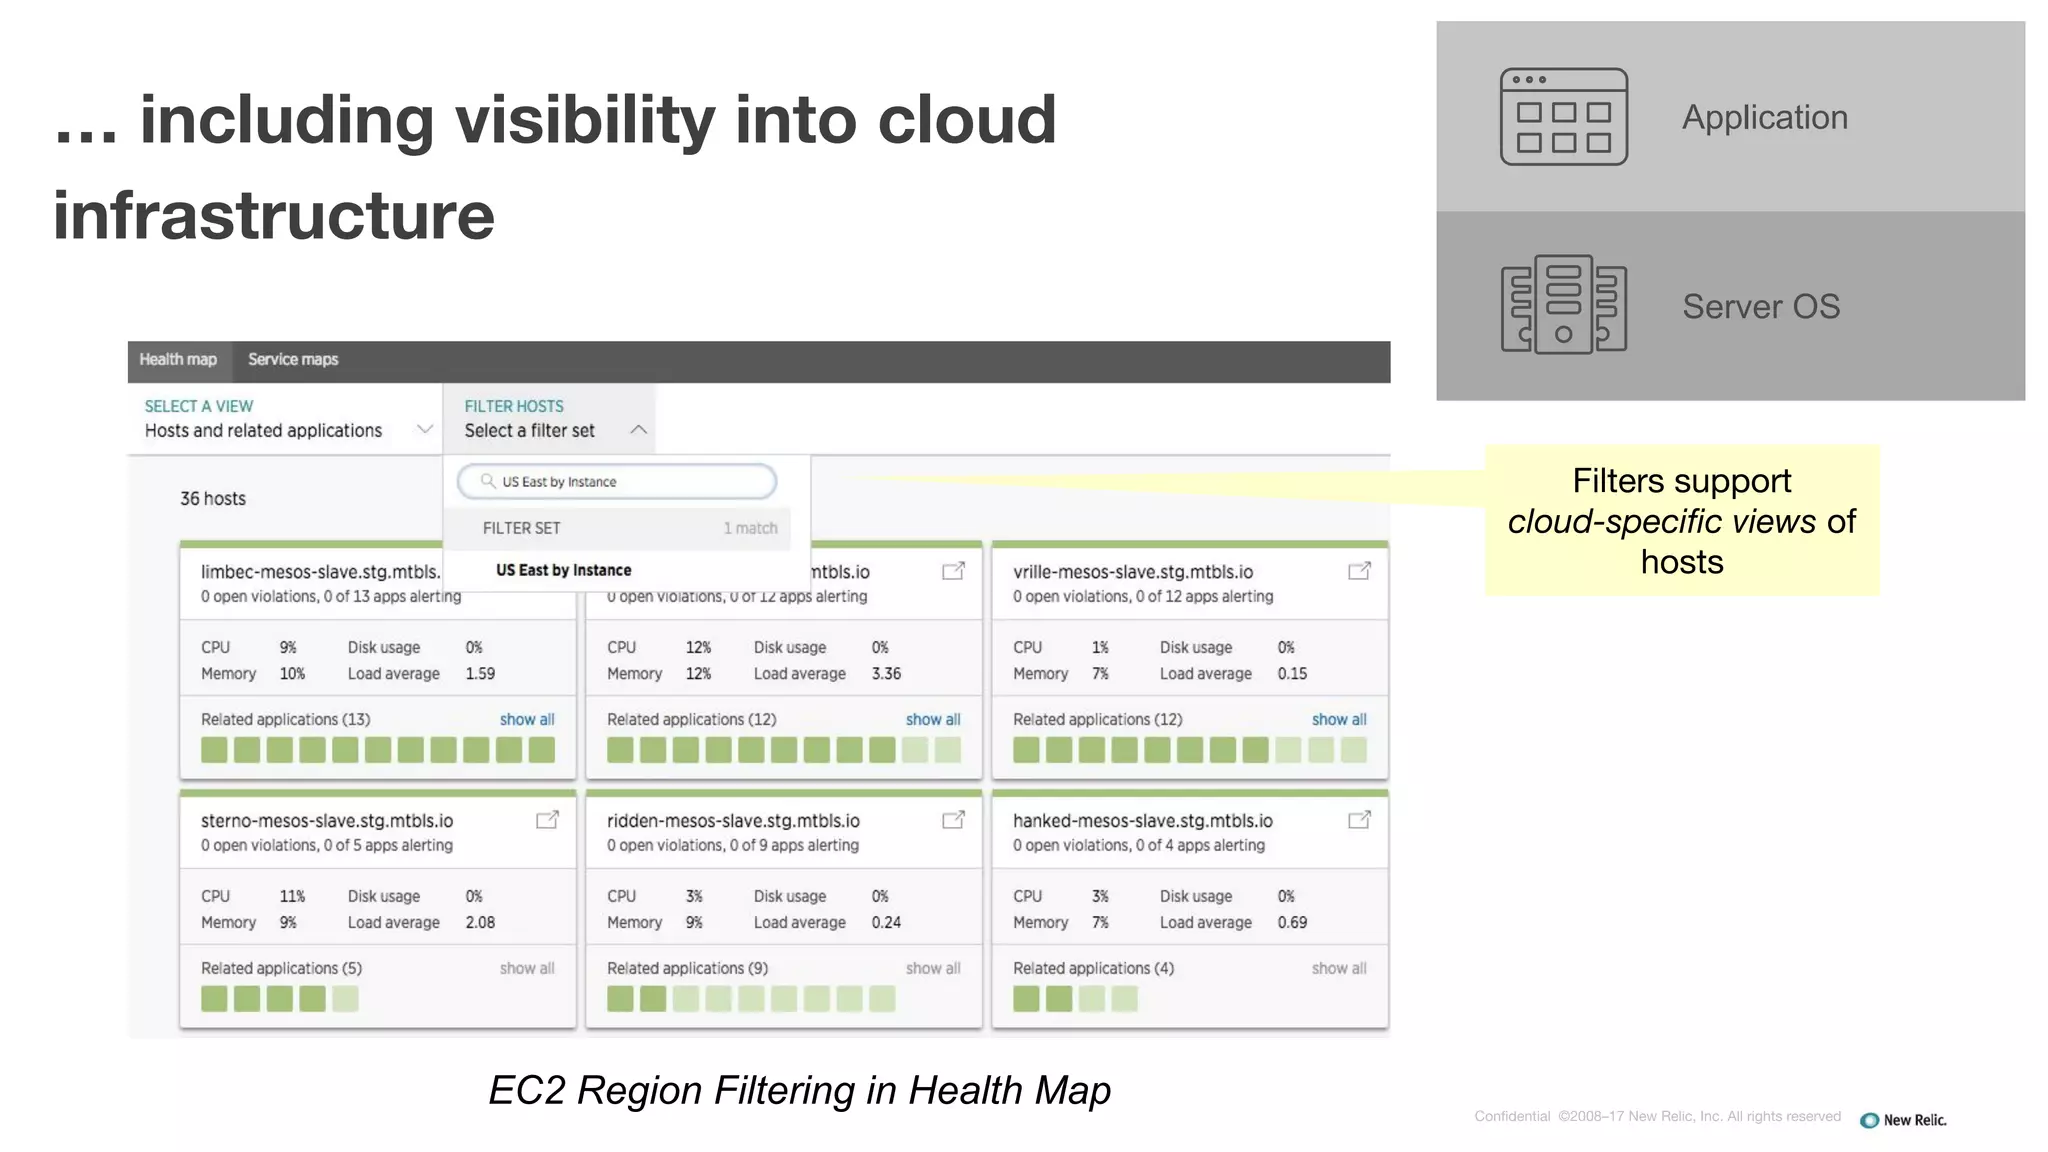
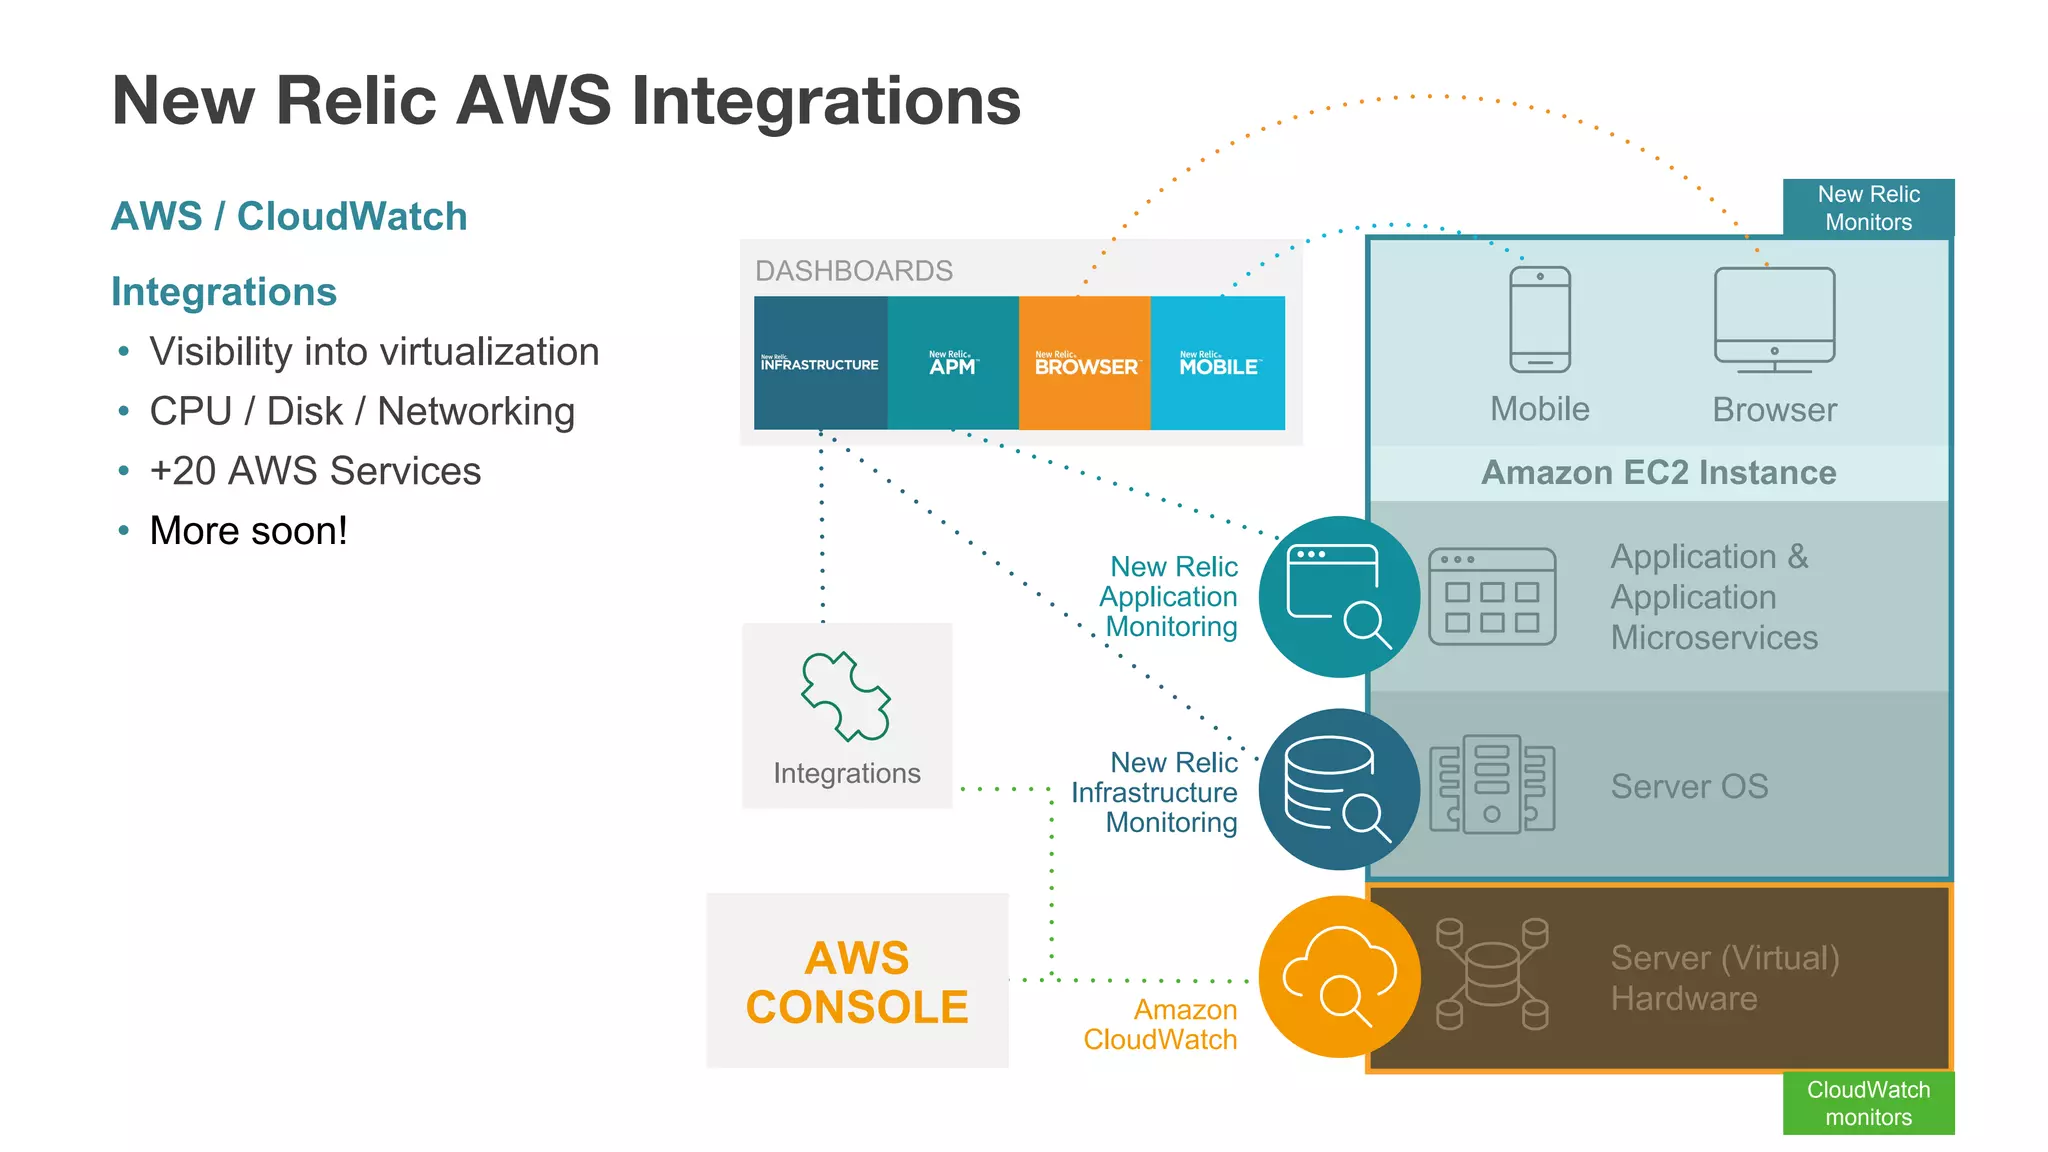
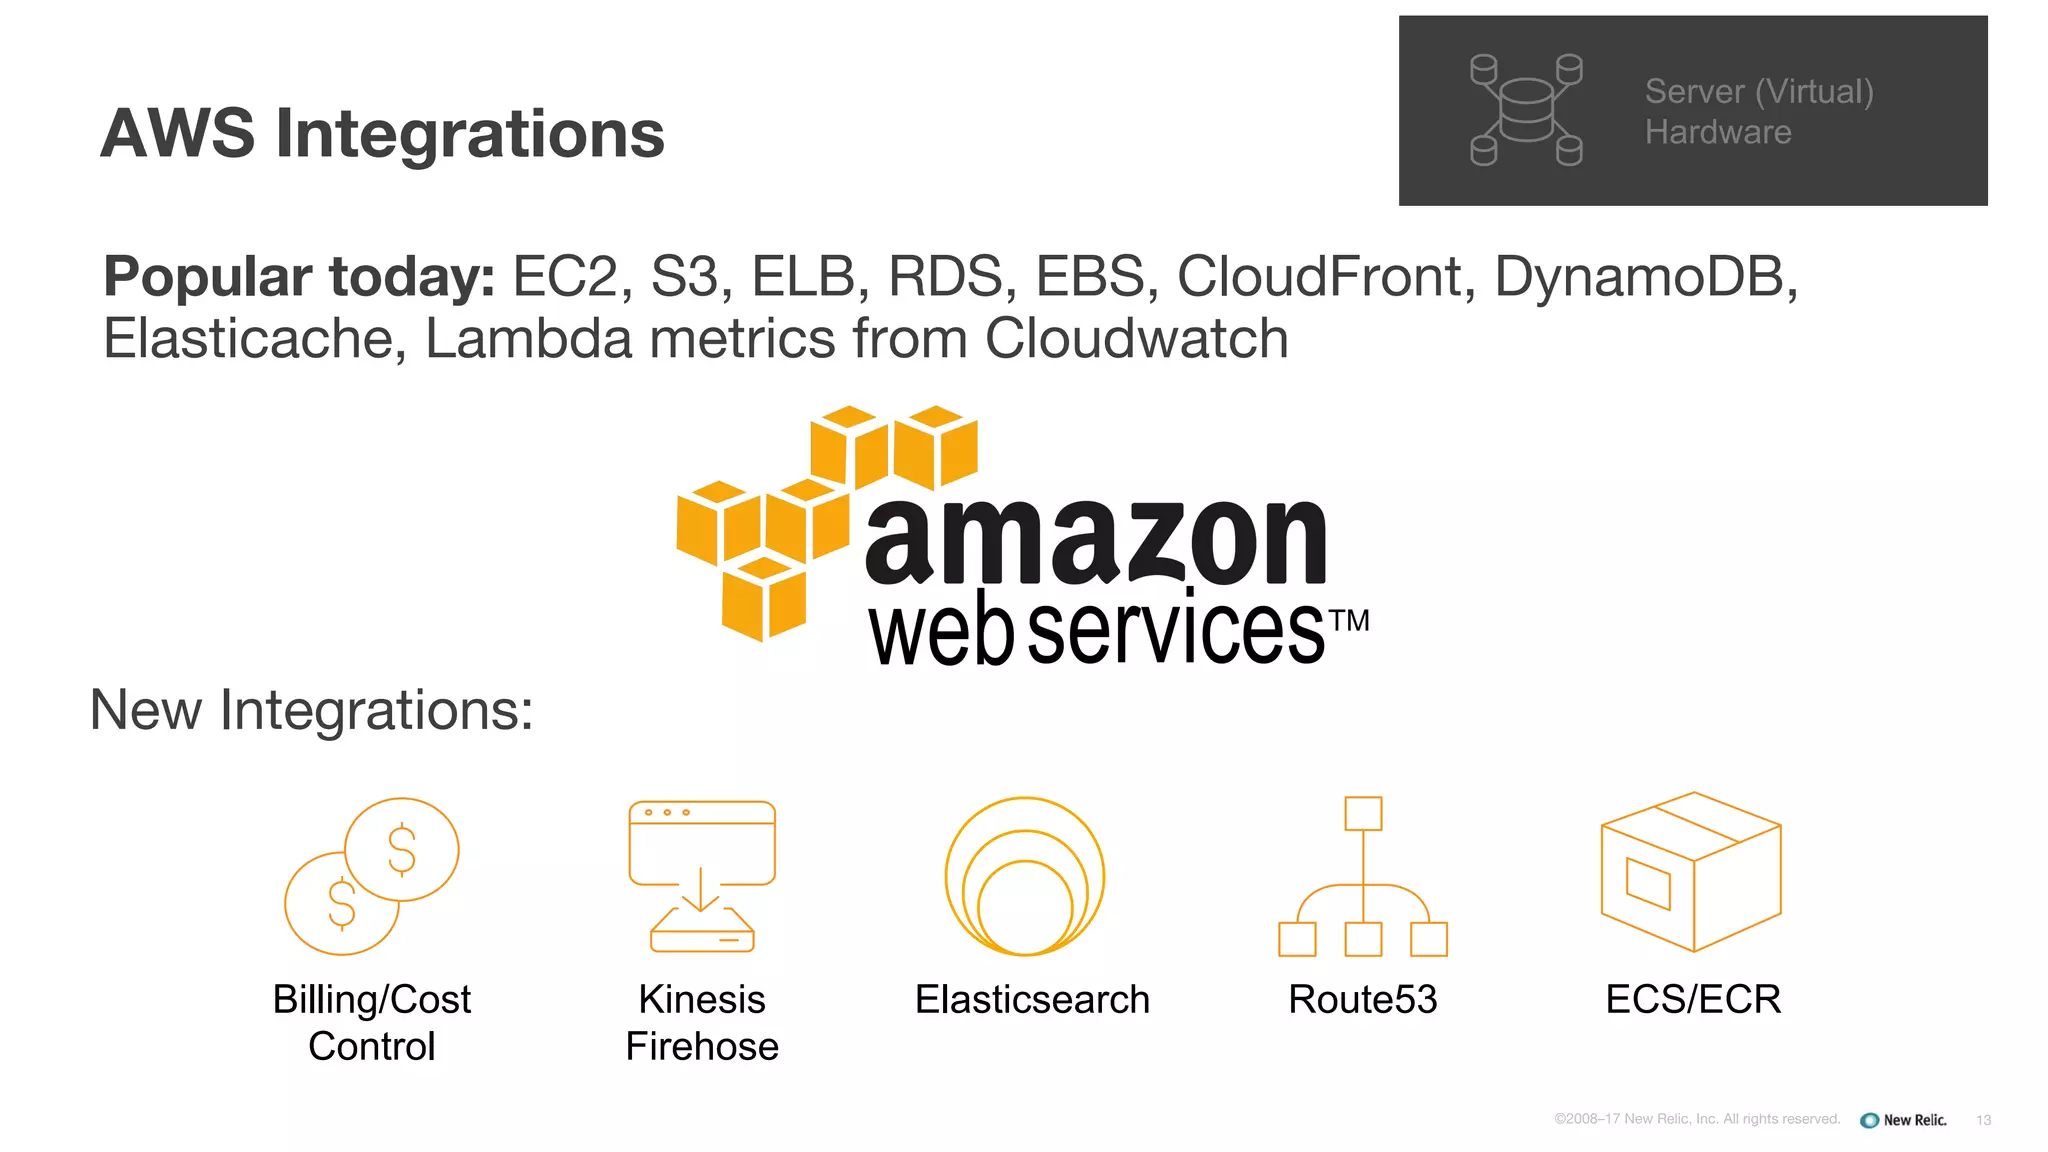
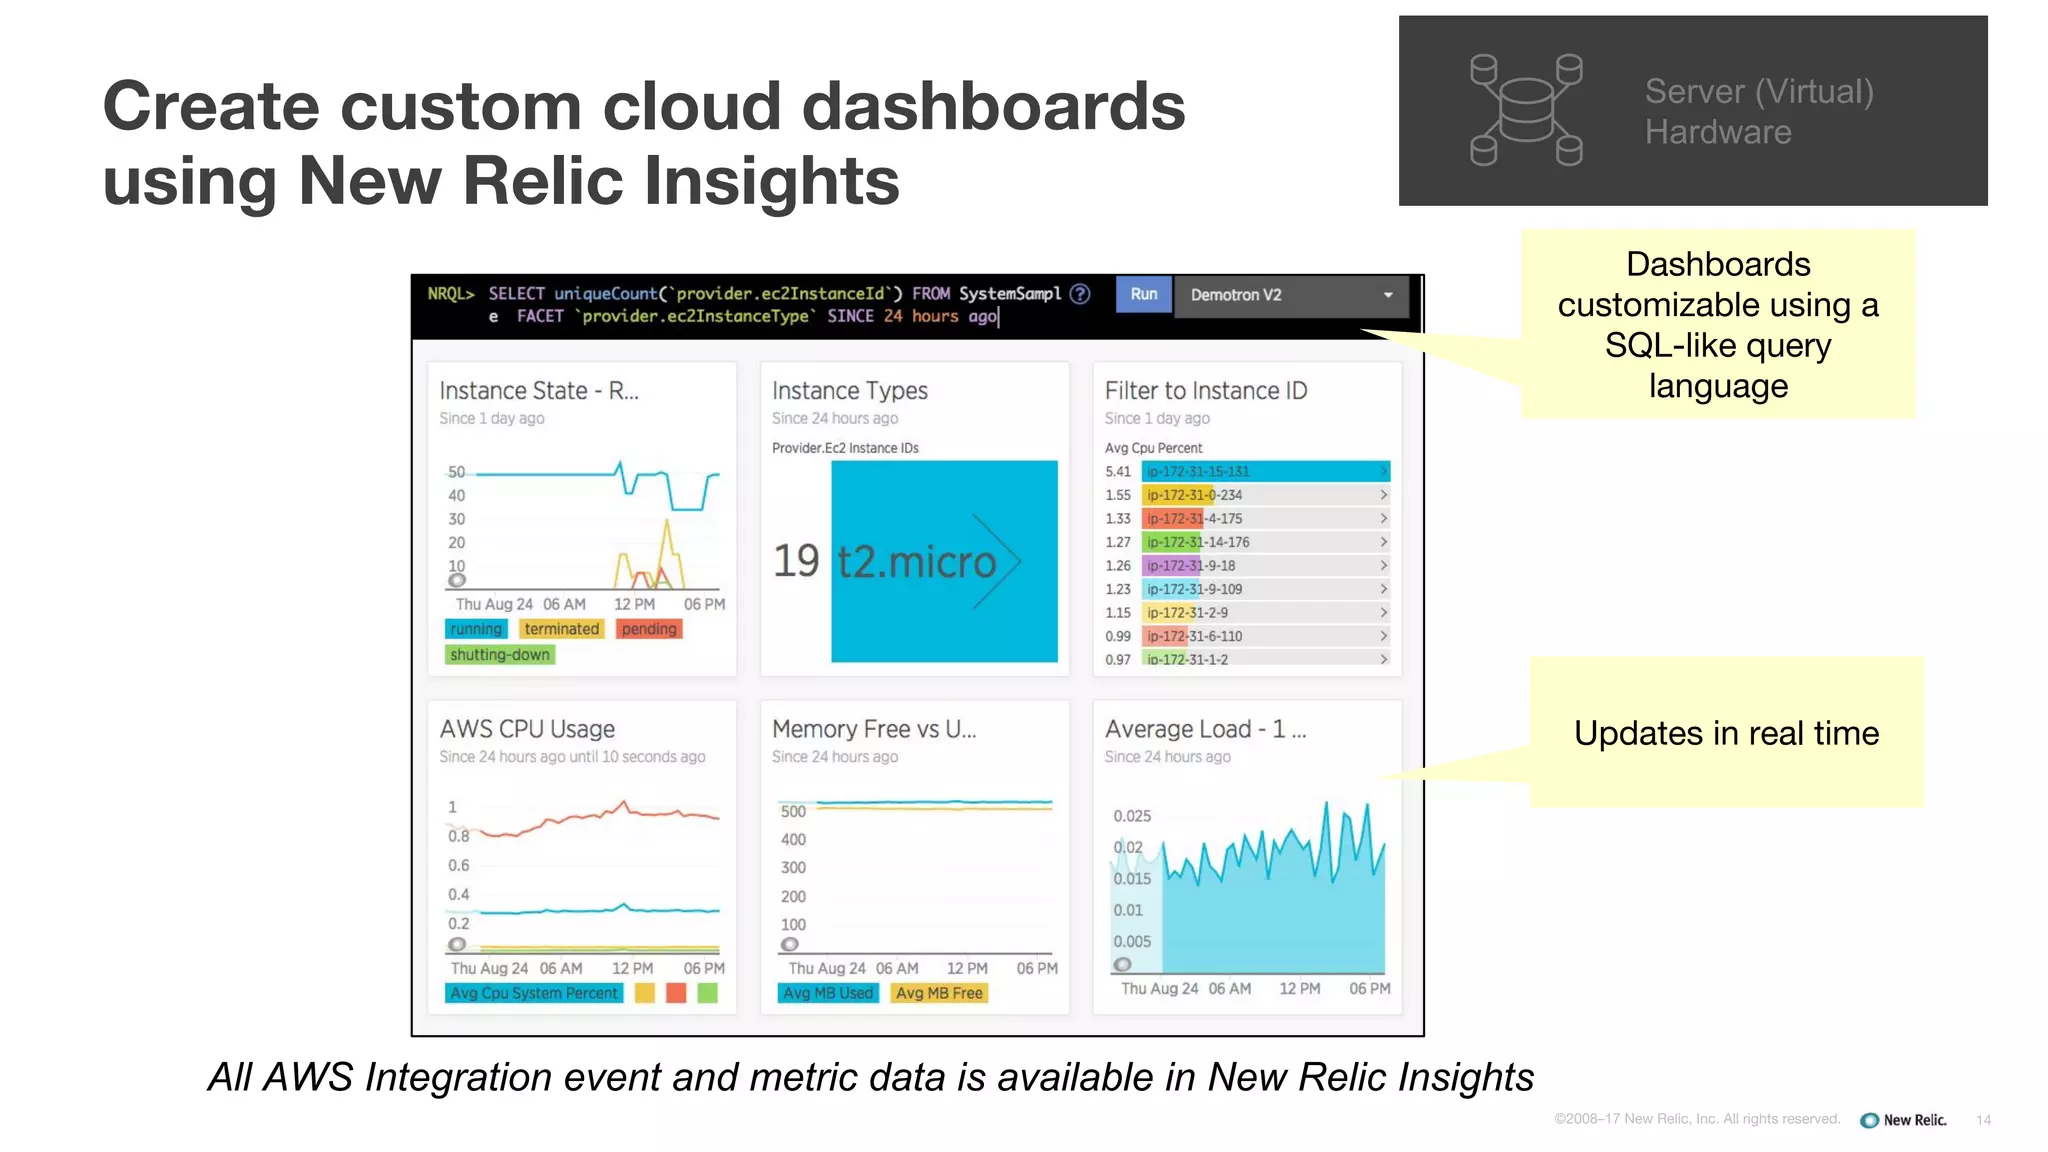
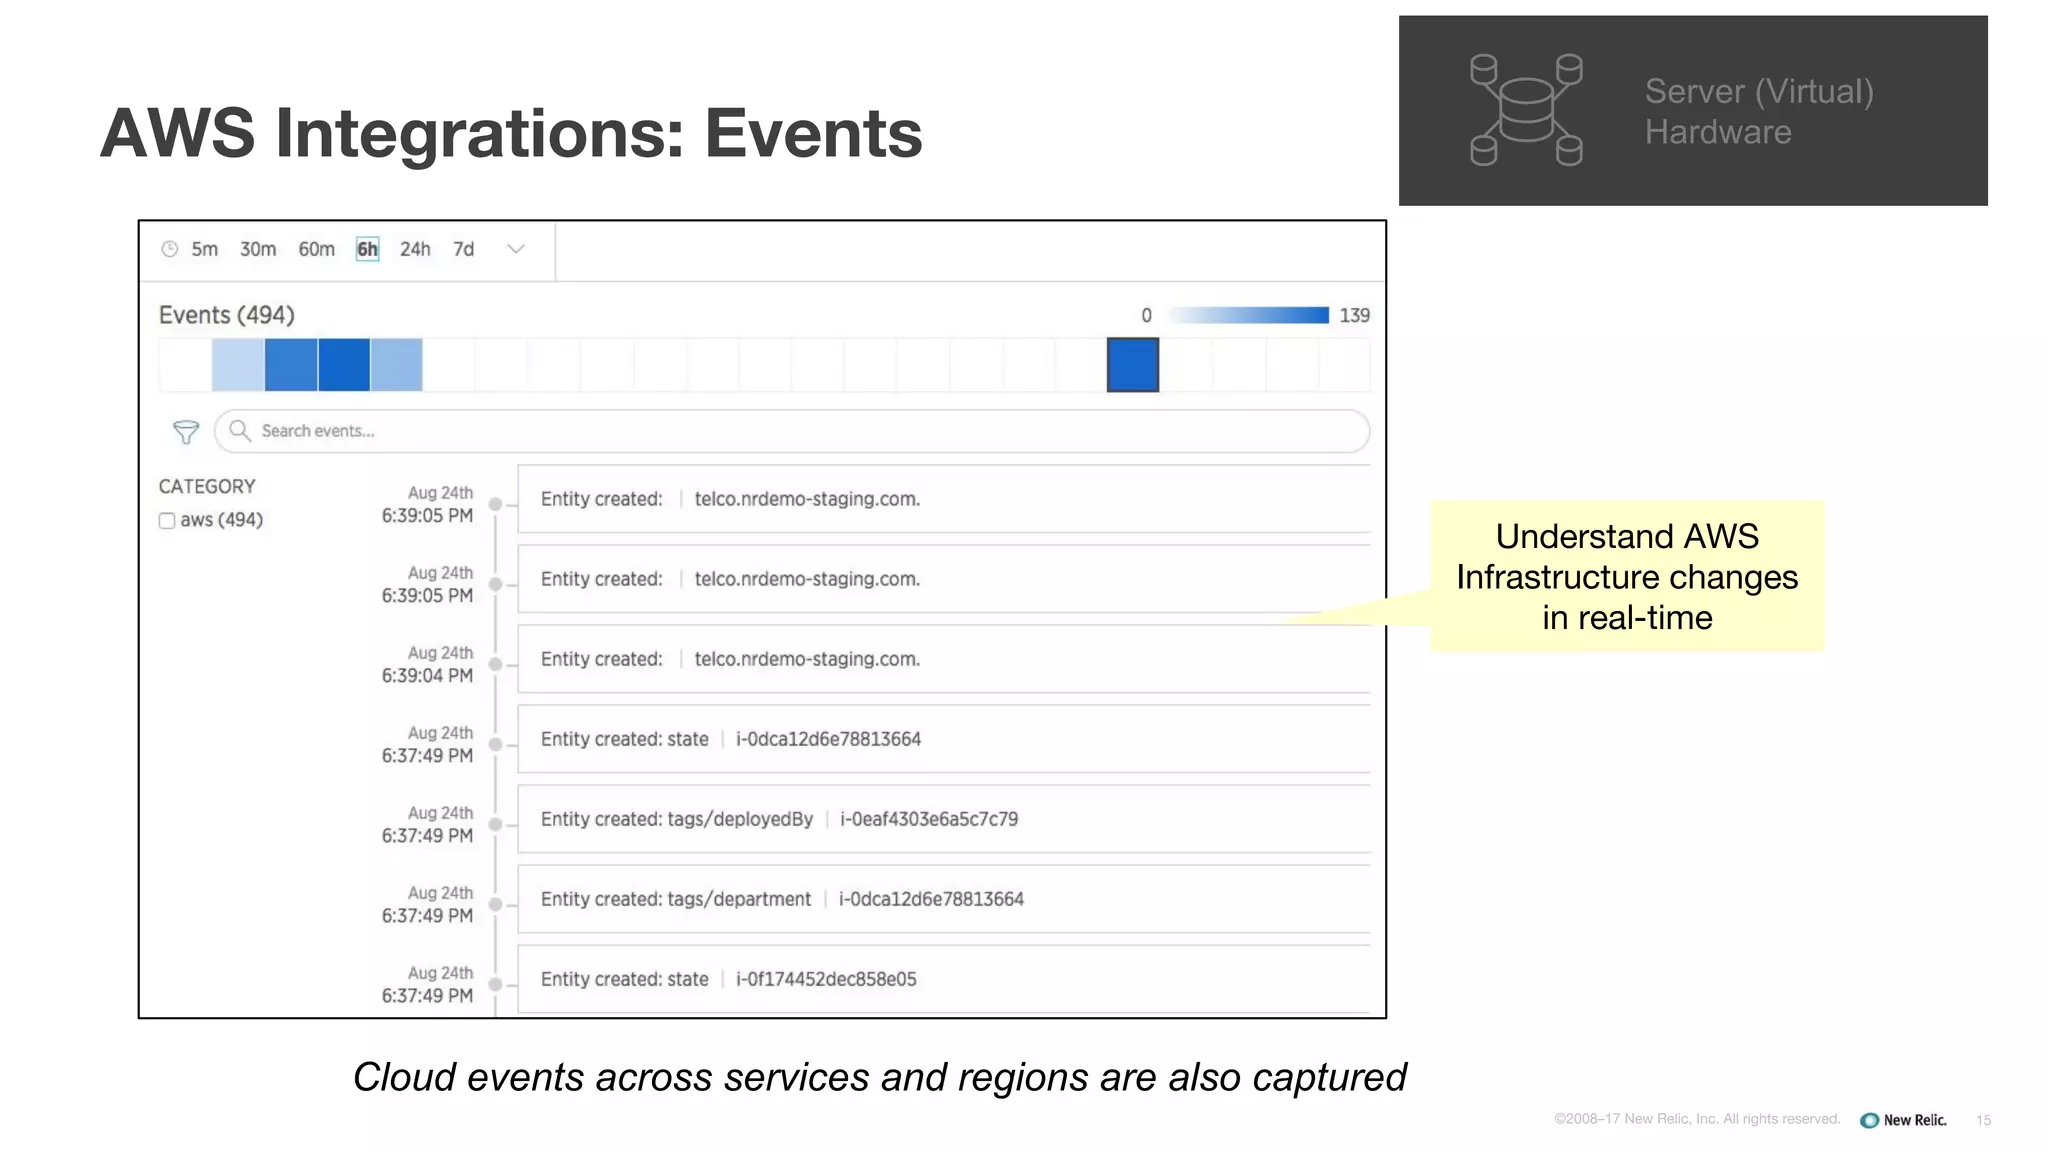
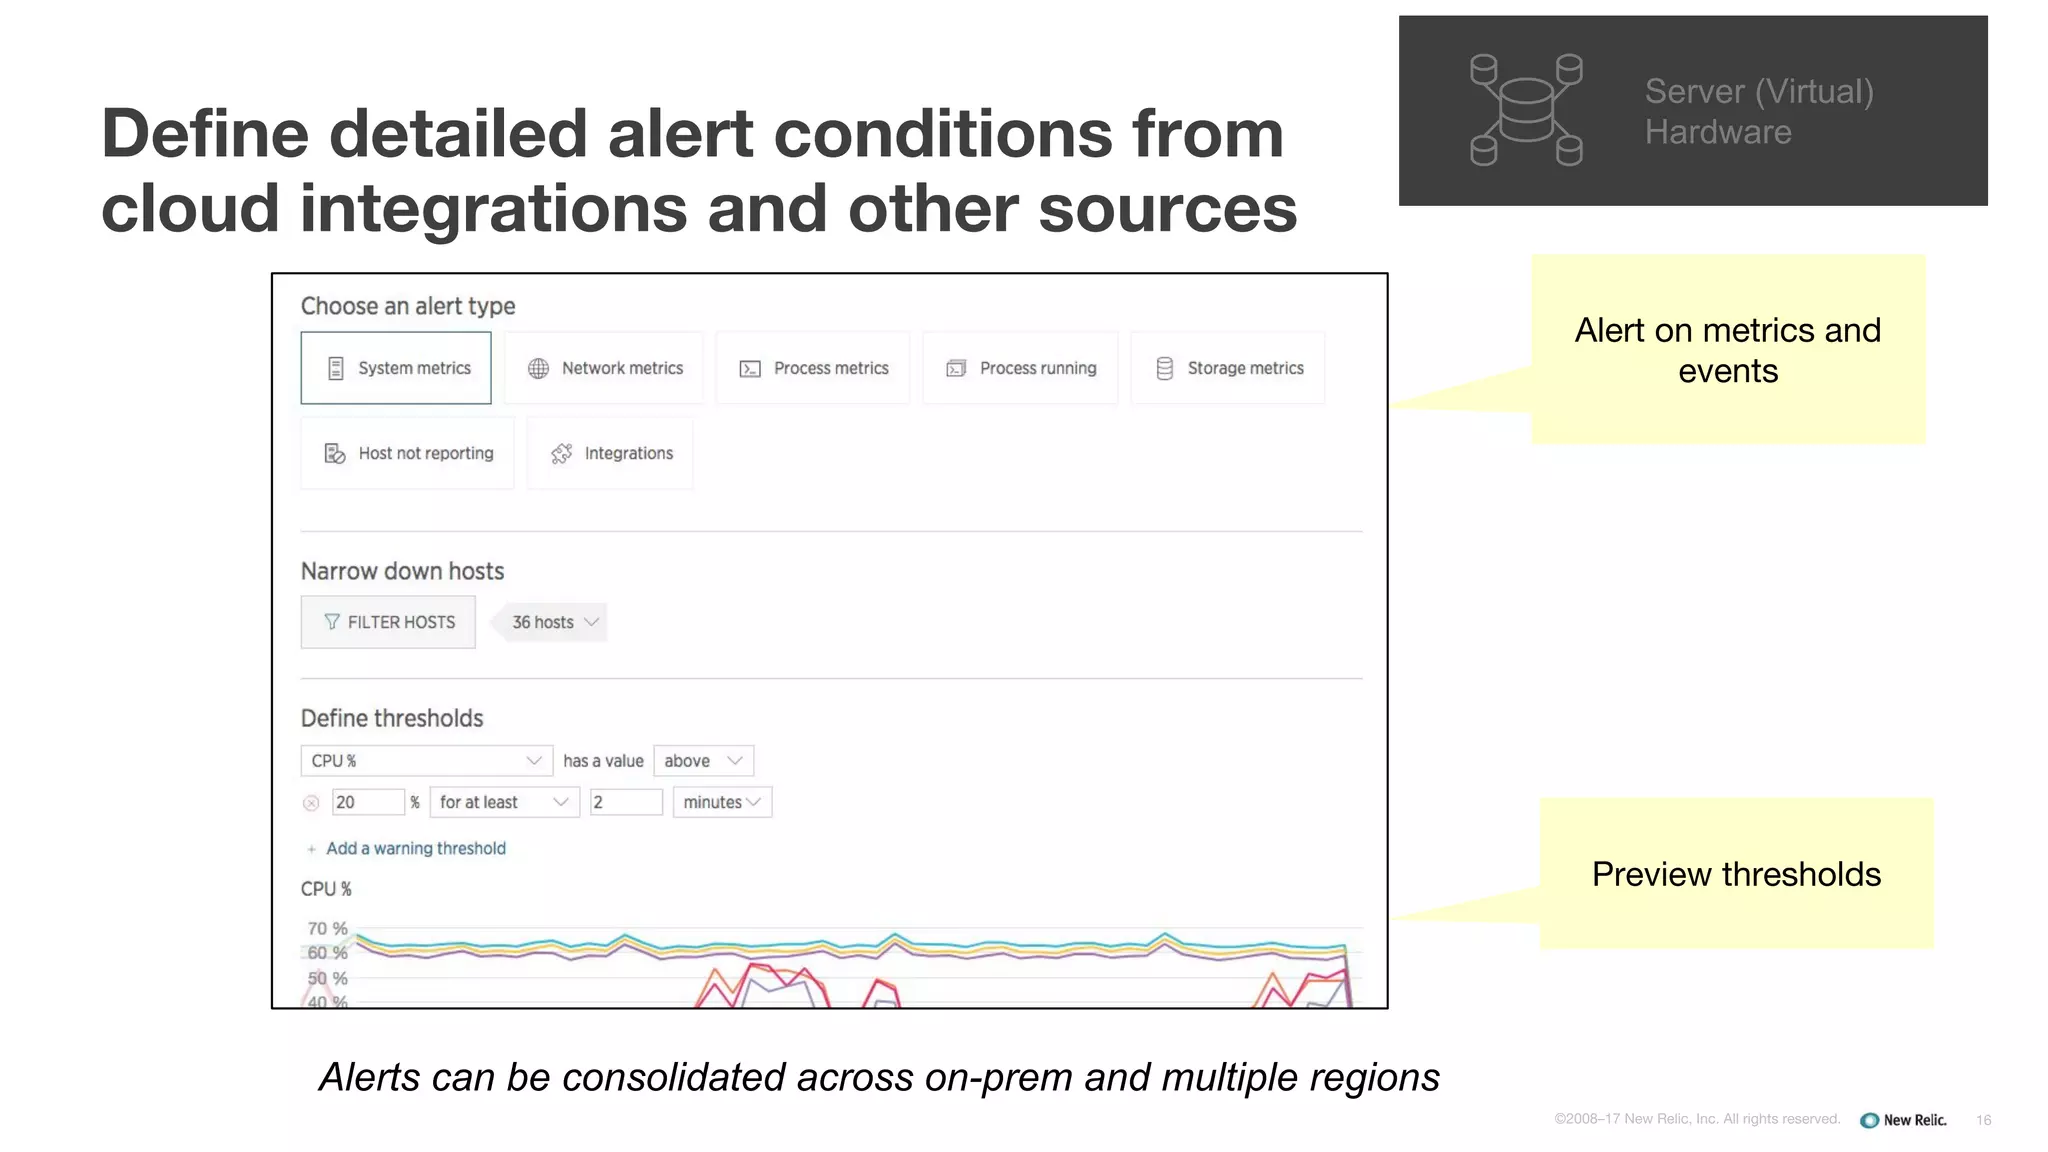
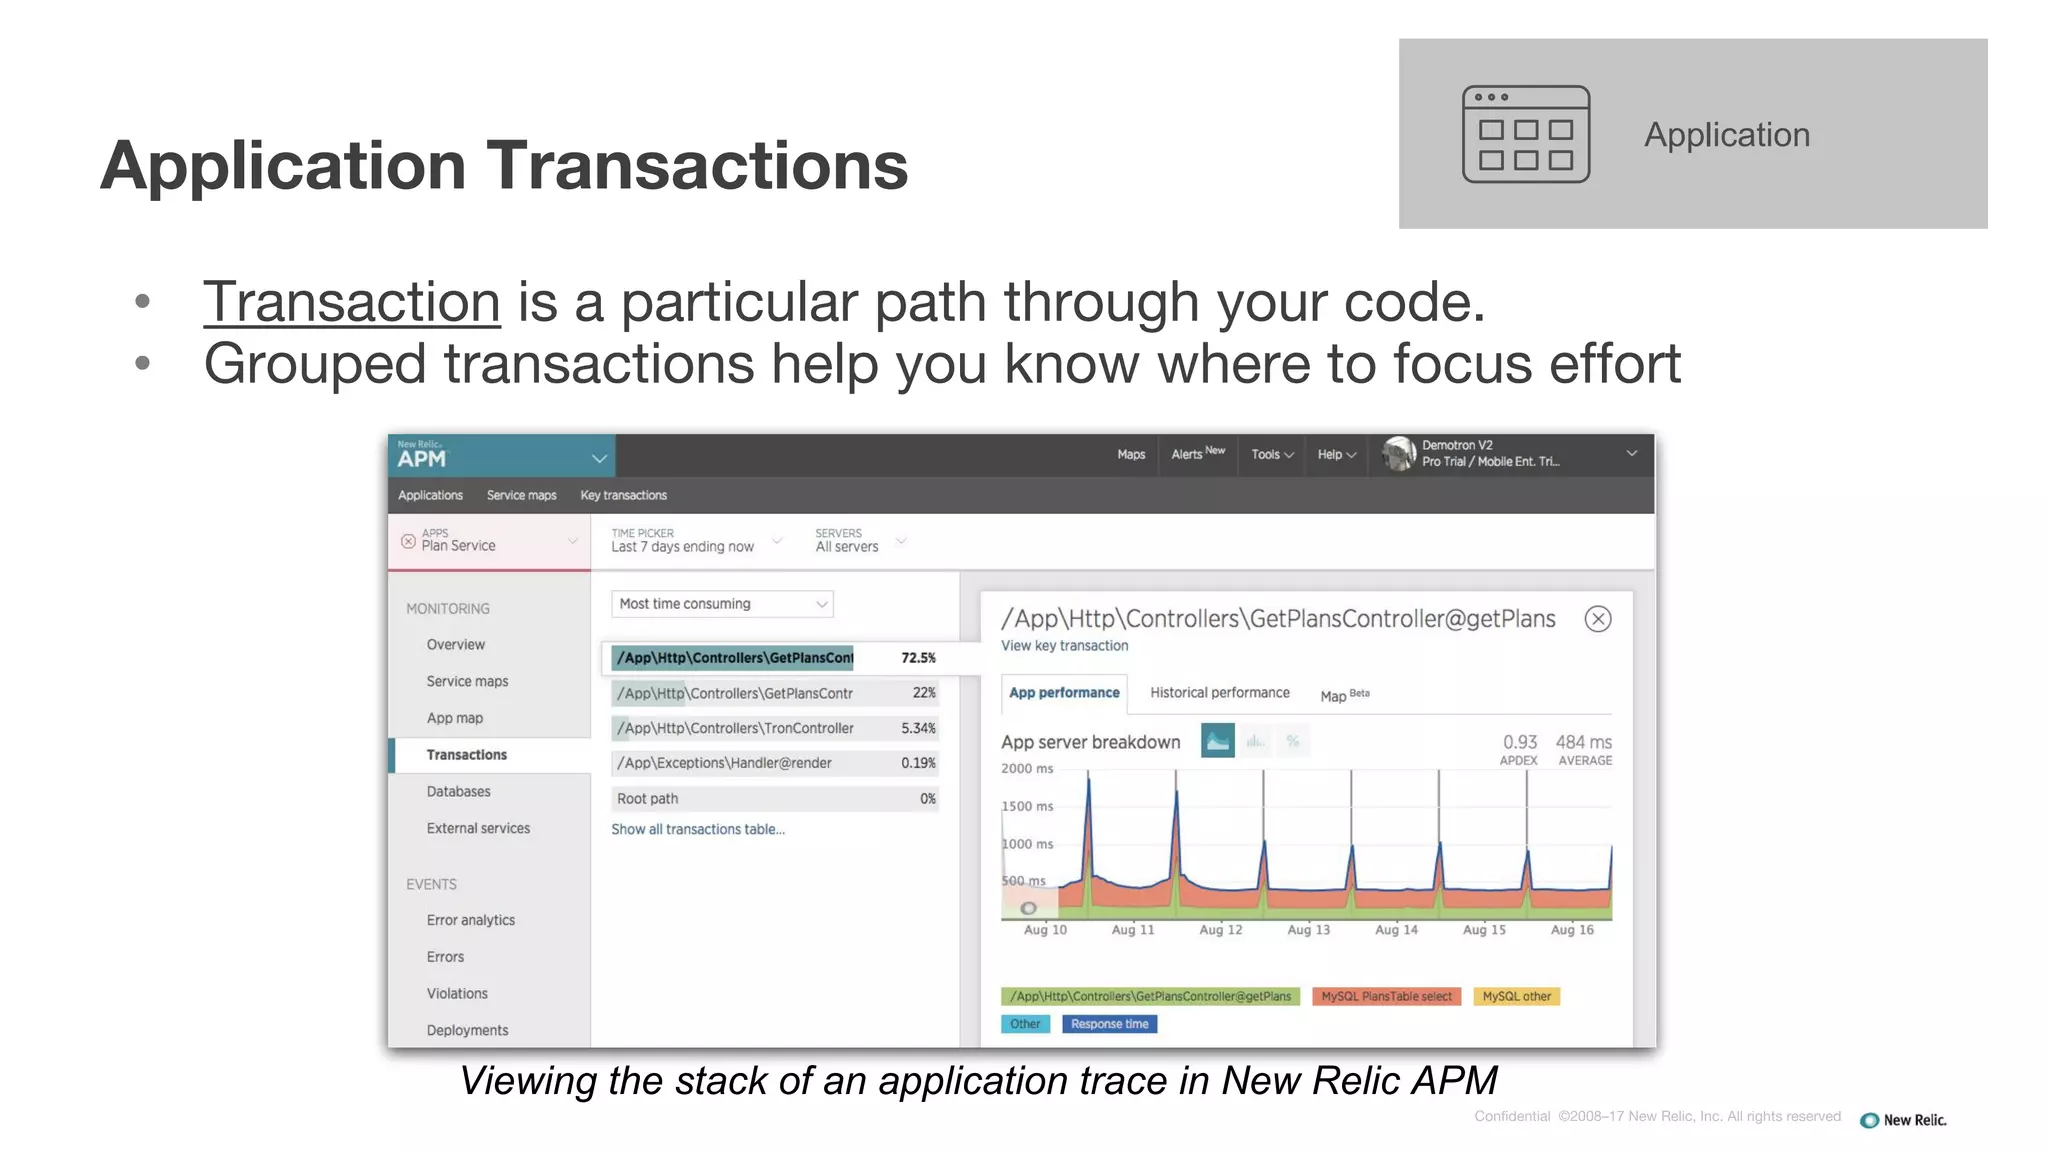
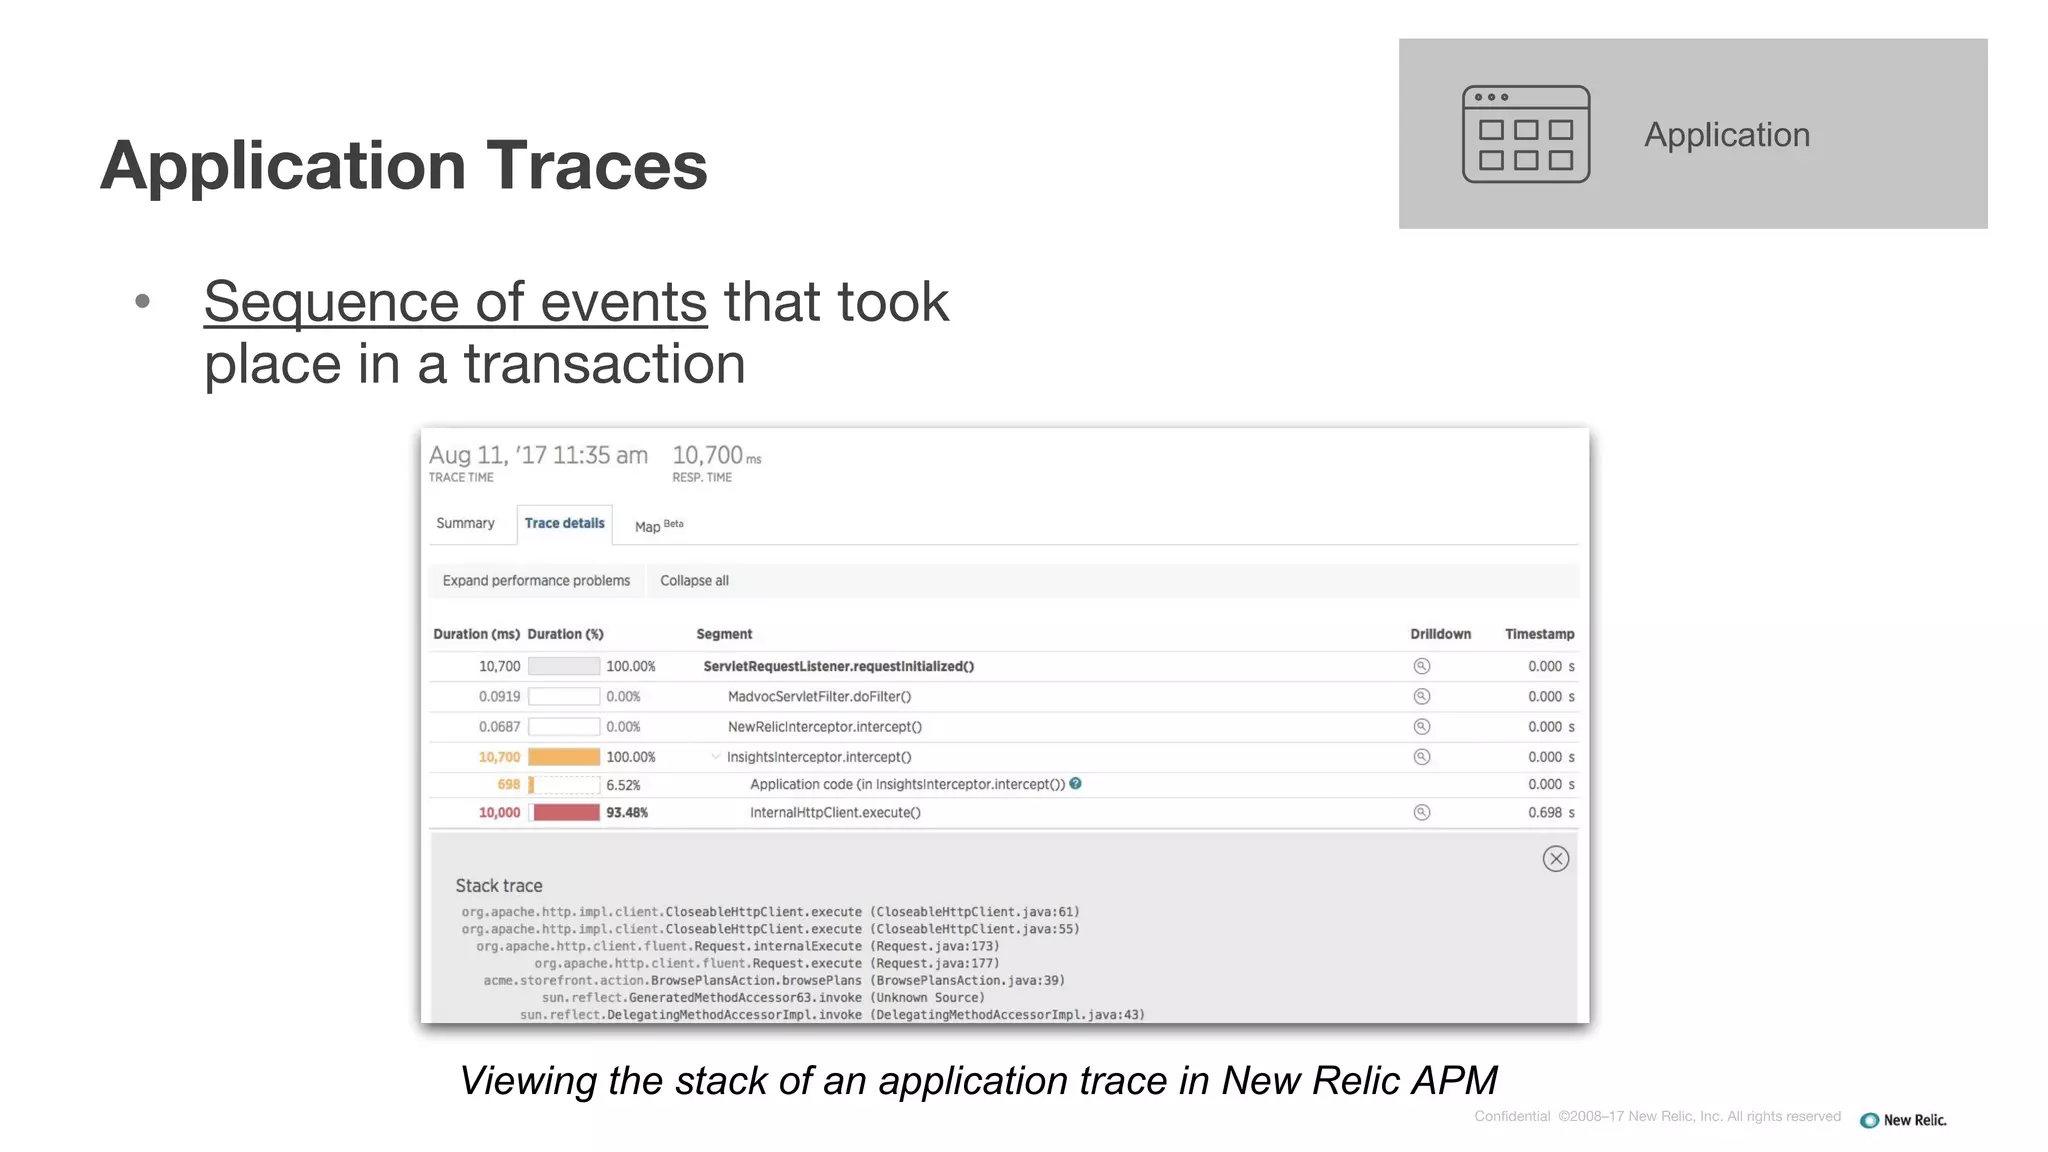
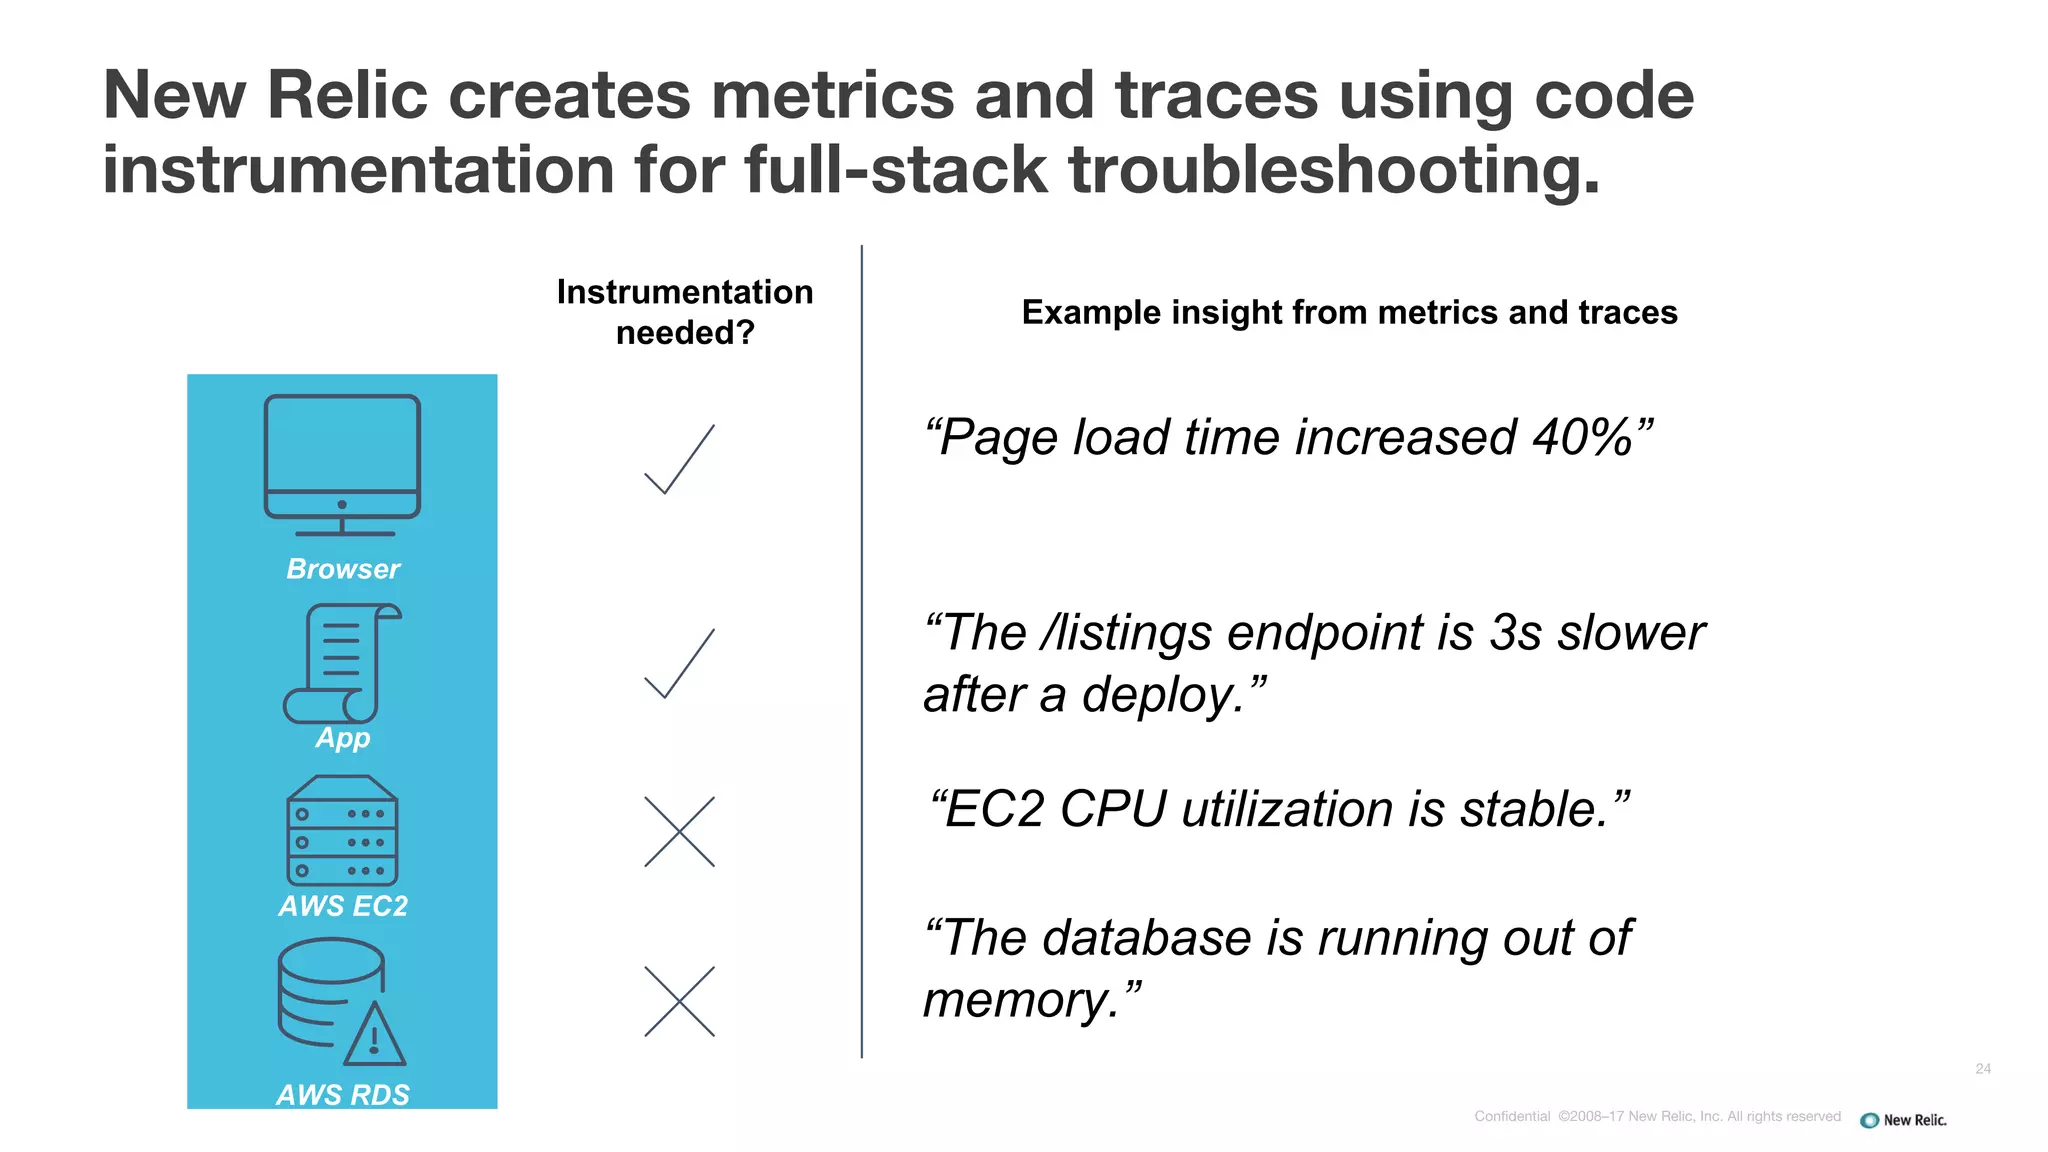
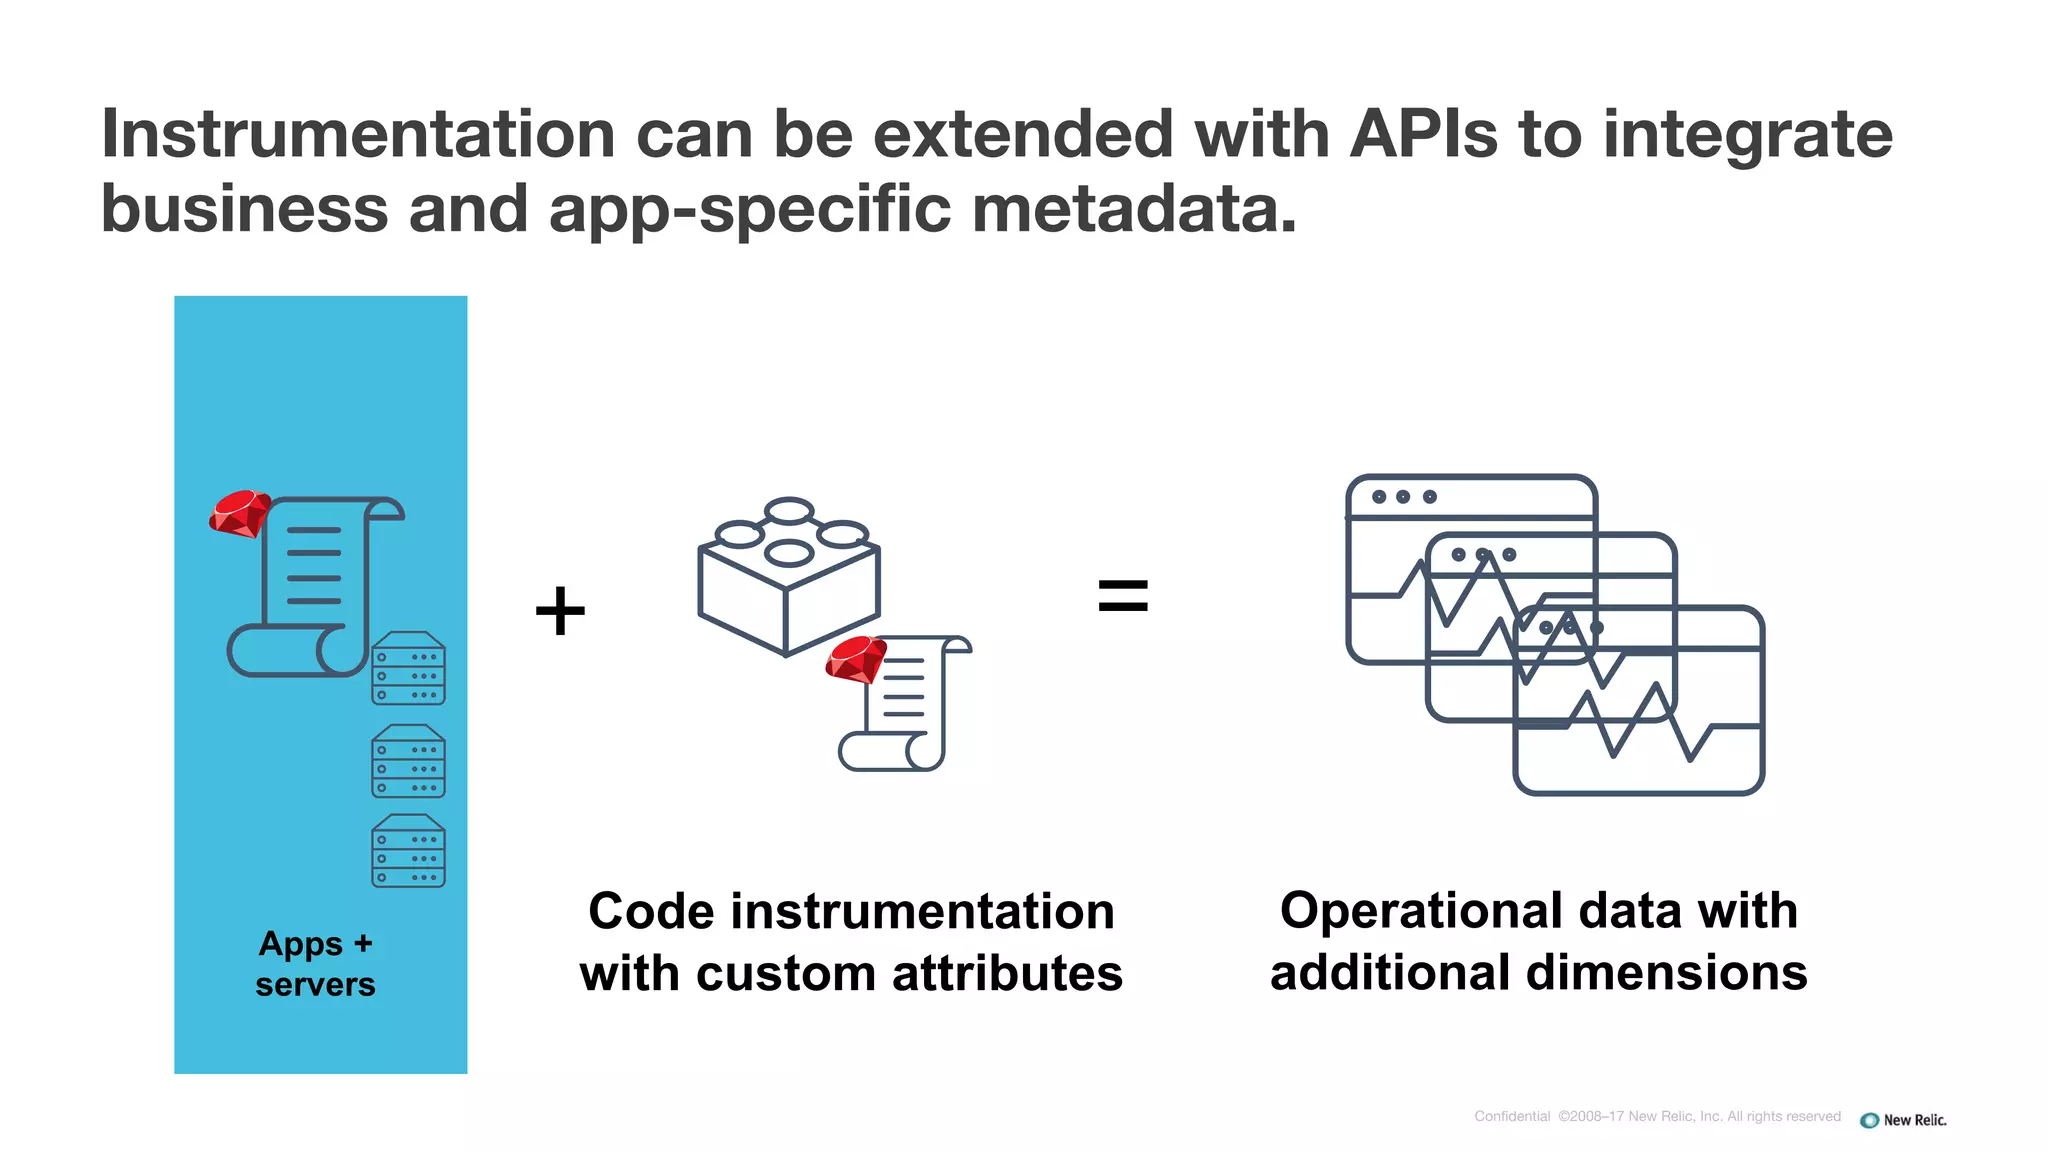
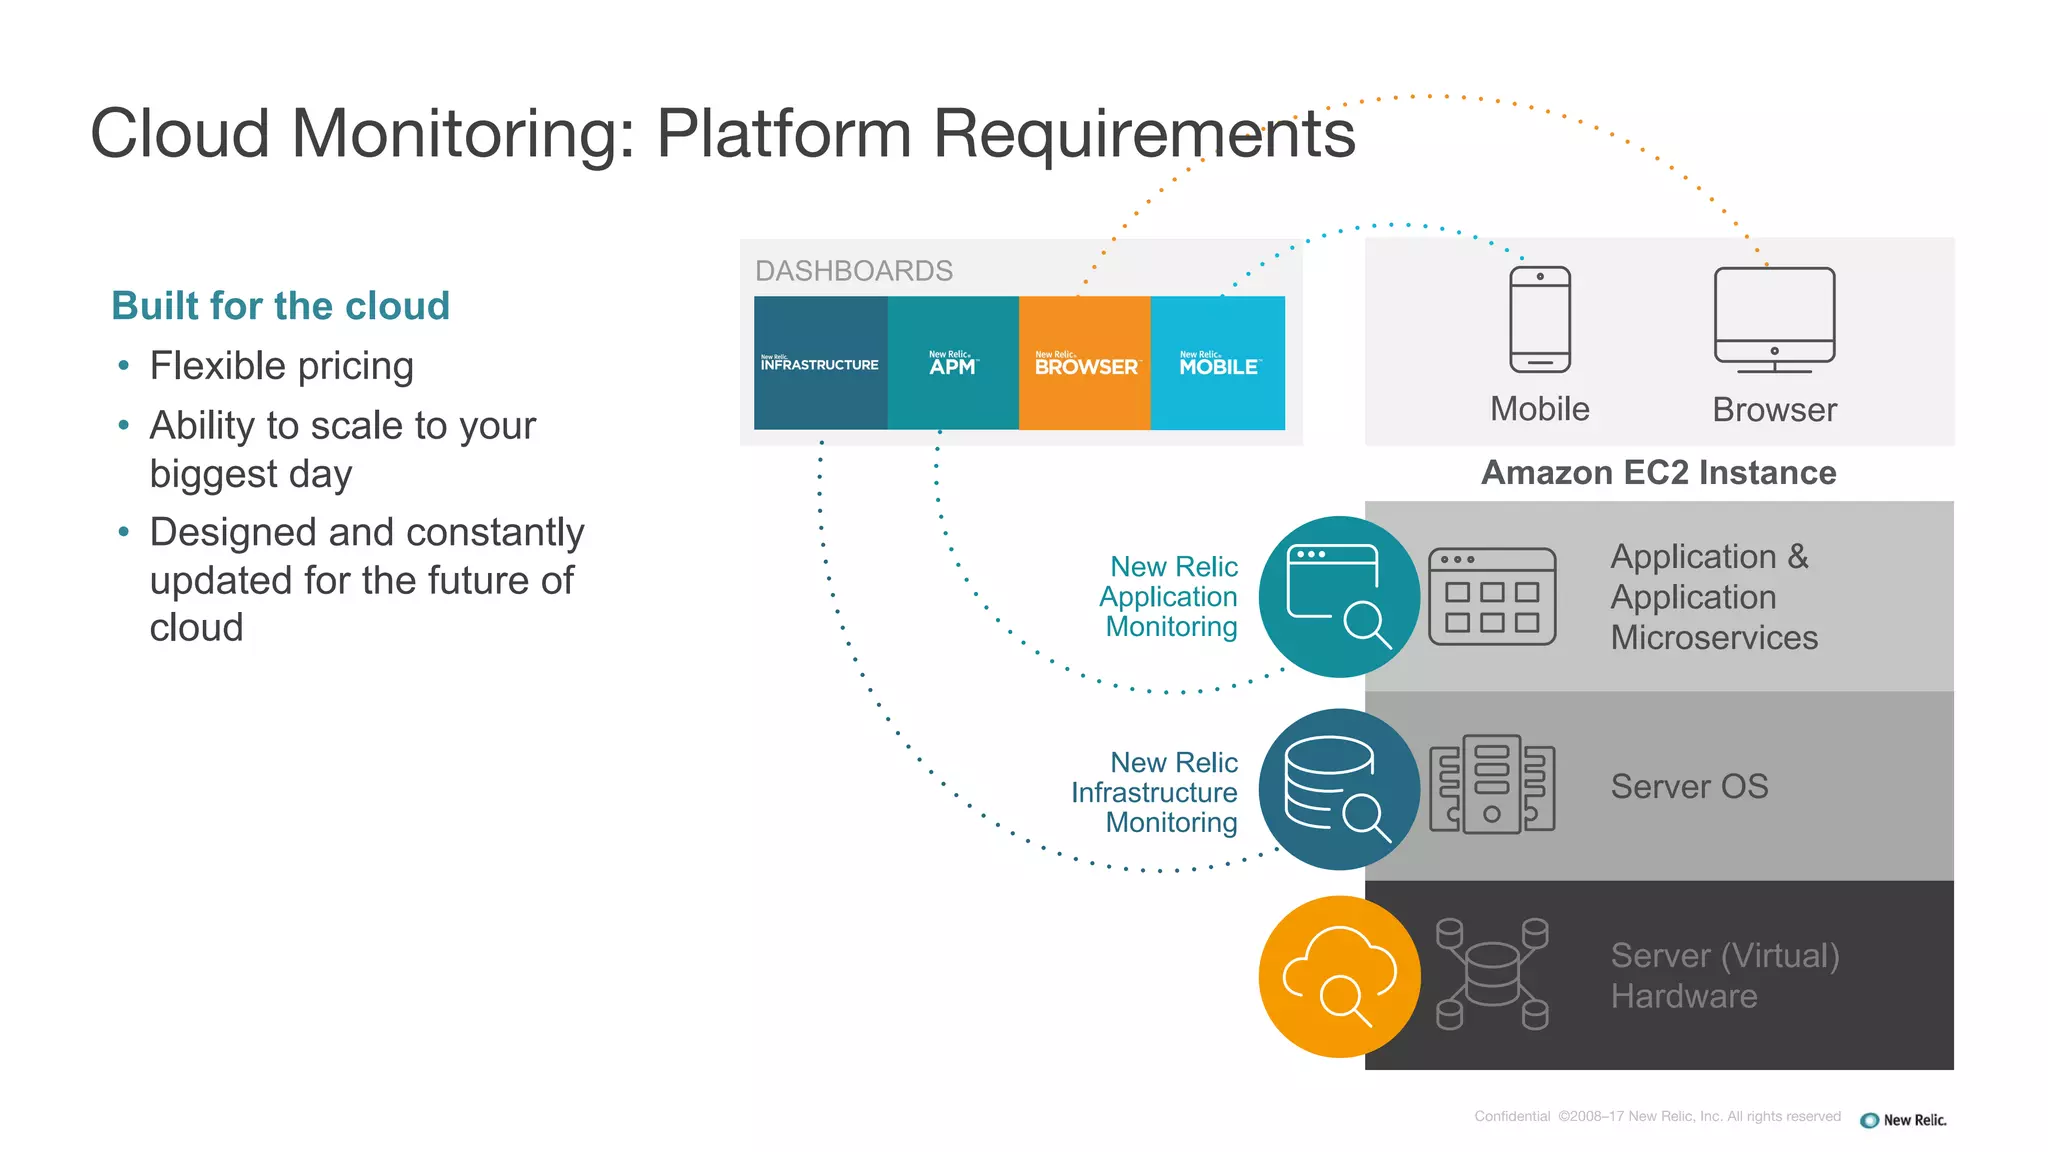

The document discusses the importance and requirements of monitoring cloud applications and infrastructure, highlighting the challenges posed by increased complexity and data volume in cloud environments. It emphasizes the need for visibility into cloud application architecture, operational data, and integration with cloud-managed services through tools like New Relic. Key features such as service maps, health maps, and real-time metrics from cloud integrations are presented to aid in effective monitoring and troubleshooting.


![Monitoring the Dynamic Nature of the Cloud [FutureStack16 NYC]](https://cdn.slidesharecdn.com/ss_thumbnails/futurestack-nymonitoringdynamicnatureofcloudatchison-160816180342-thumbnail.jpg?width=640&height=640&fit=bounds)
![Building A System That Never Stops [FutureStack16 NYC]](https://cdn.slidesharecdn.com/ss_thumbnails/buildingasystemthatneverstopsfs16nycv2-160815233101-thumbnail.jpg?width=640&height=640&fit=bounds)


![FutureStack Tokyo 19 -[パートナー講演]アマゾン ウェブ サービス ジャパン株式会社: New Relicを活用したAWSへのアプリ...](https://cdn.slidesharecdn.com/ss_thumbnails/awsmorookanewrelicfuturestacktokyo20190314-190401092319-thumbnail.jpg?width=640&height=640&fit=bounds)


![FutureStack Tokyo 19 -[特別講演]システム開発によろこびと驚きの連鎖を](https://cdn.slidesharecdn.com/ss_thumbnails/creditsaisonononewrelicfuturestacktokyo20190314-190402055010-thumbnail.jpg?width=640&height=640&fit=bounds)


![FutureStack Tokyo 19 -[New Relic テクニカル講演]モニタリングと可視化がデジタルトランスフォーメーションを救う! - サ...](https://cdn.slidesharecdn.com/ss_thumbnails/fssasaki20190312-190403080804-thumbnail.jpg?width=640&height=640&fit=bounds)
![FutureStack Tokyo 19 -[事例講演]株式会社リクルートライフスタイル:年間9300万件以上のサロン予約を支えるホットペッパービューティ...](https://cdn.slidesharecdn.com/ss_thumbnails/newrelicfuturestacktokyokabutoya20190314-190403084958-thumbnail.jpg?width=640&height=640&fit=bounds)


