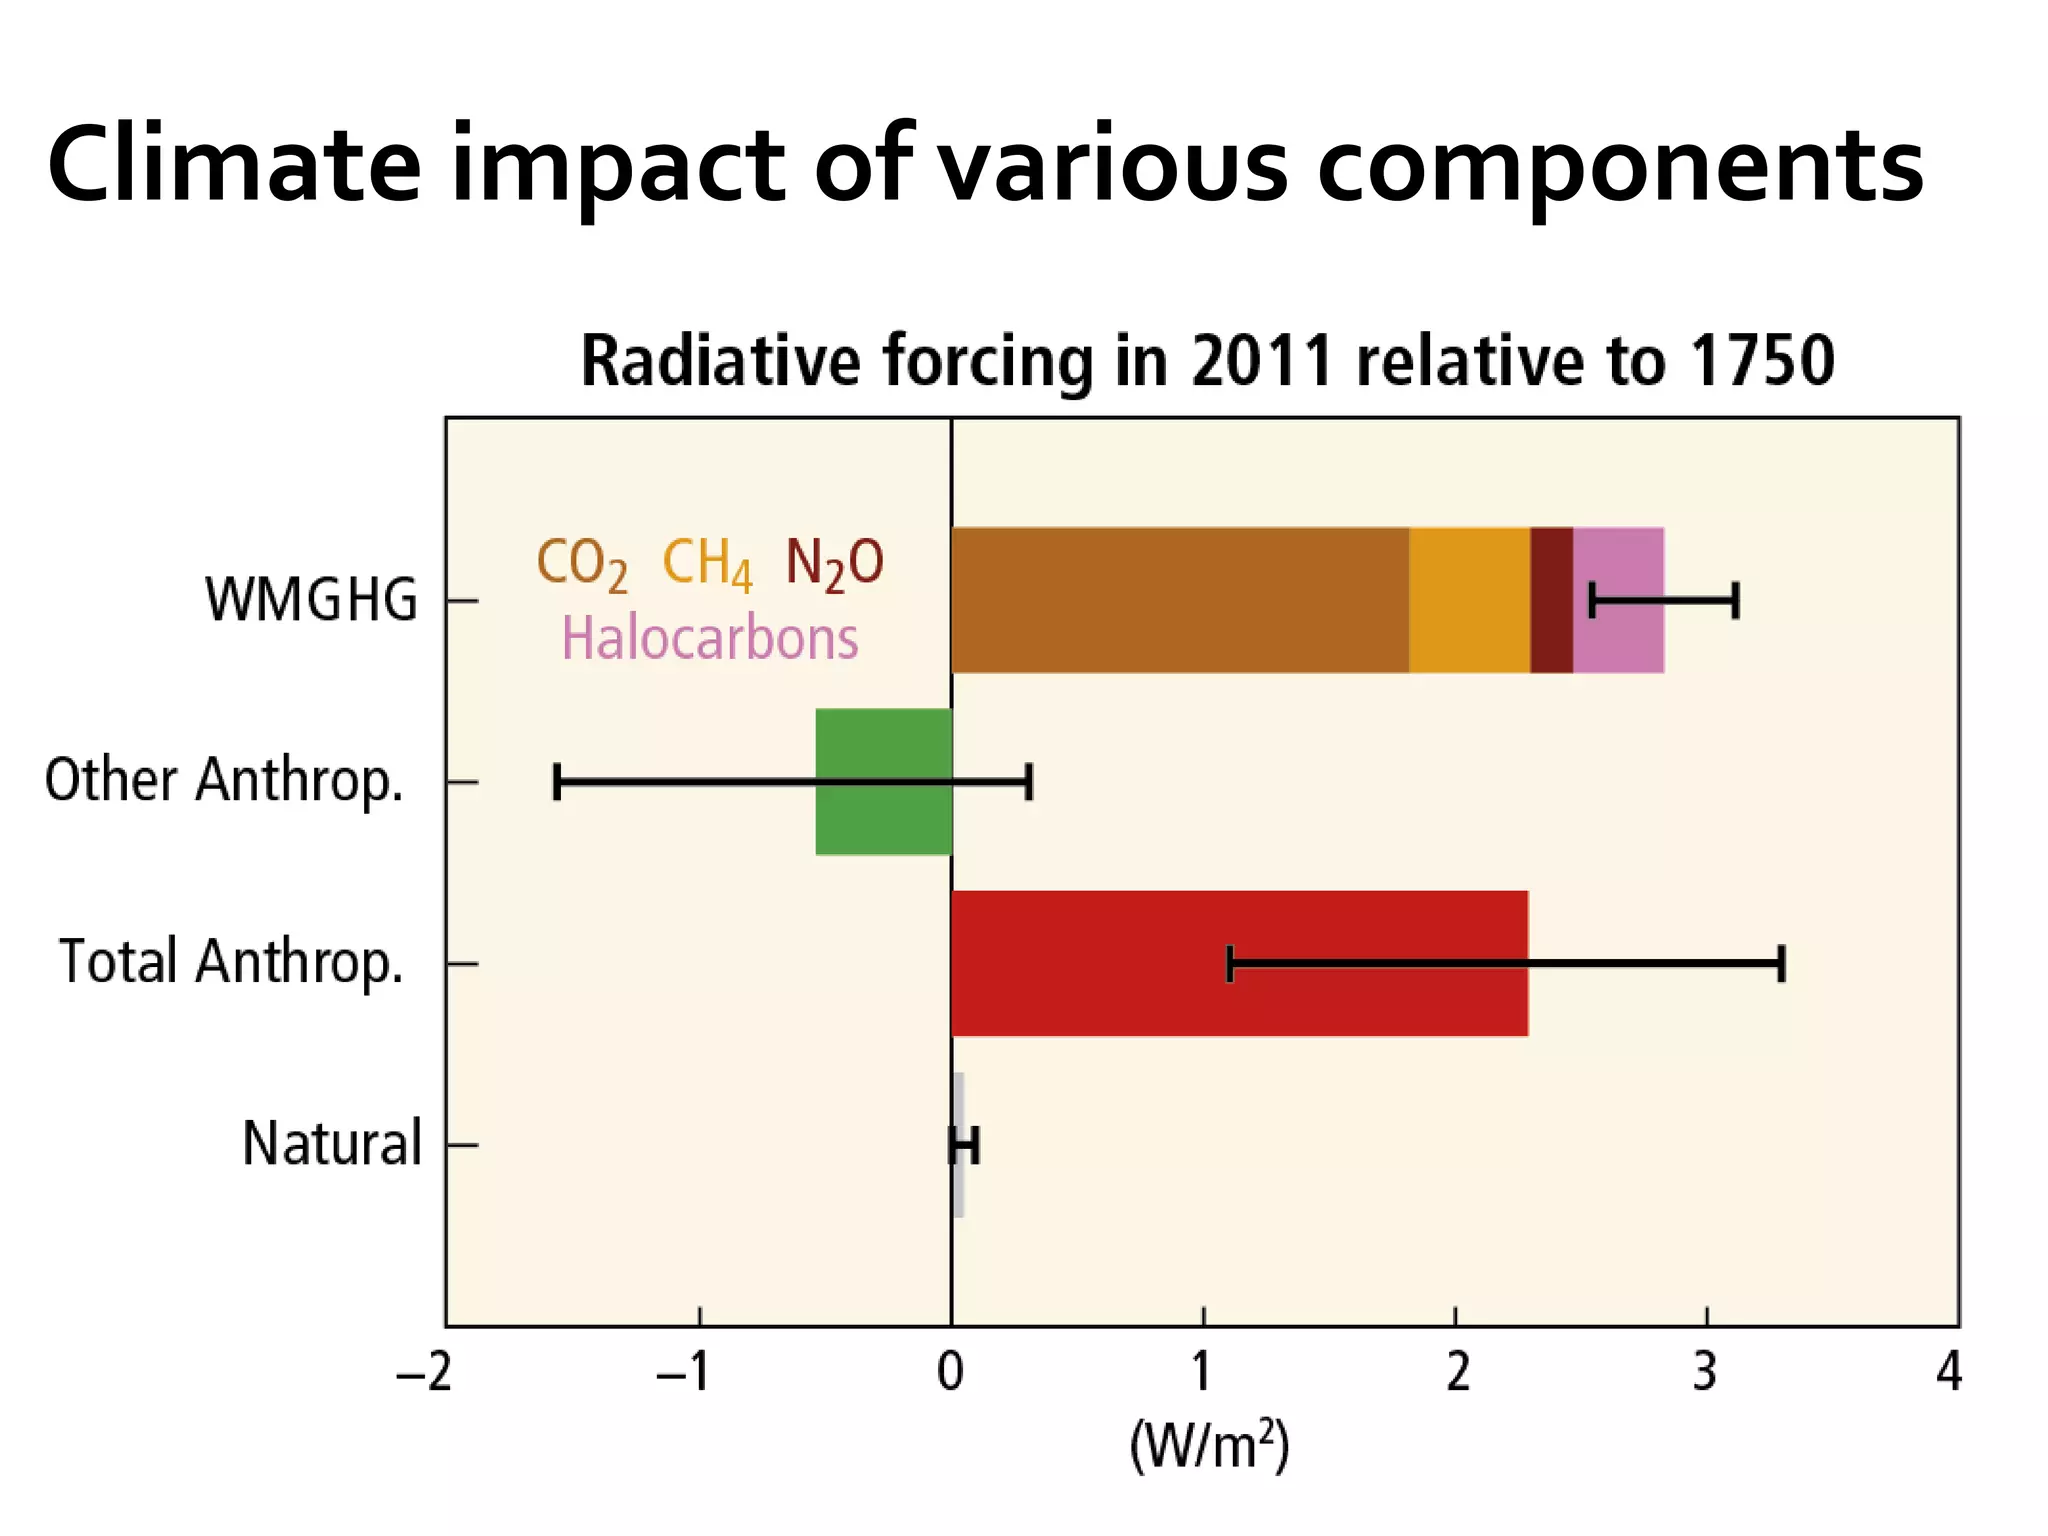
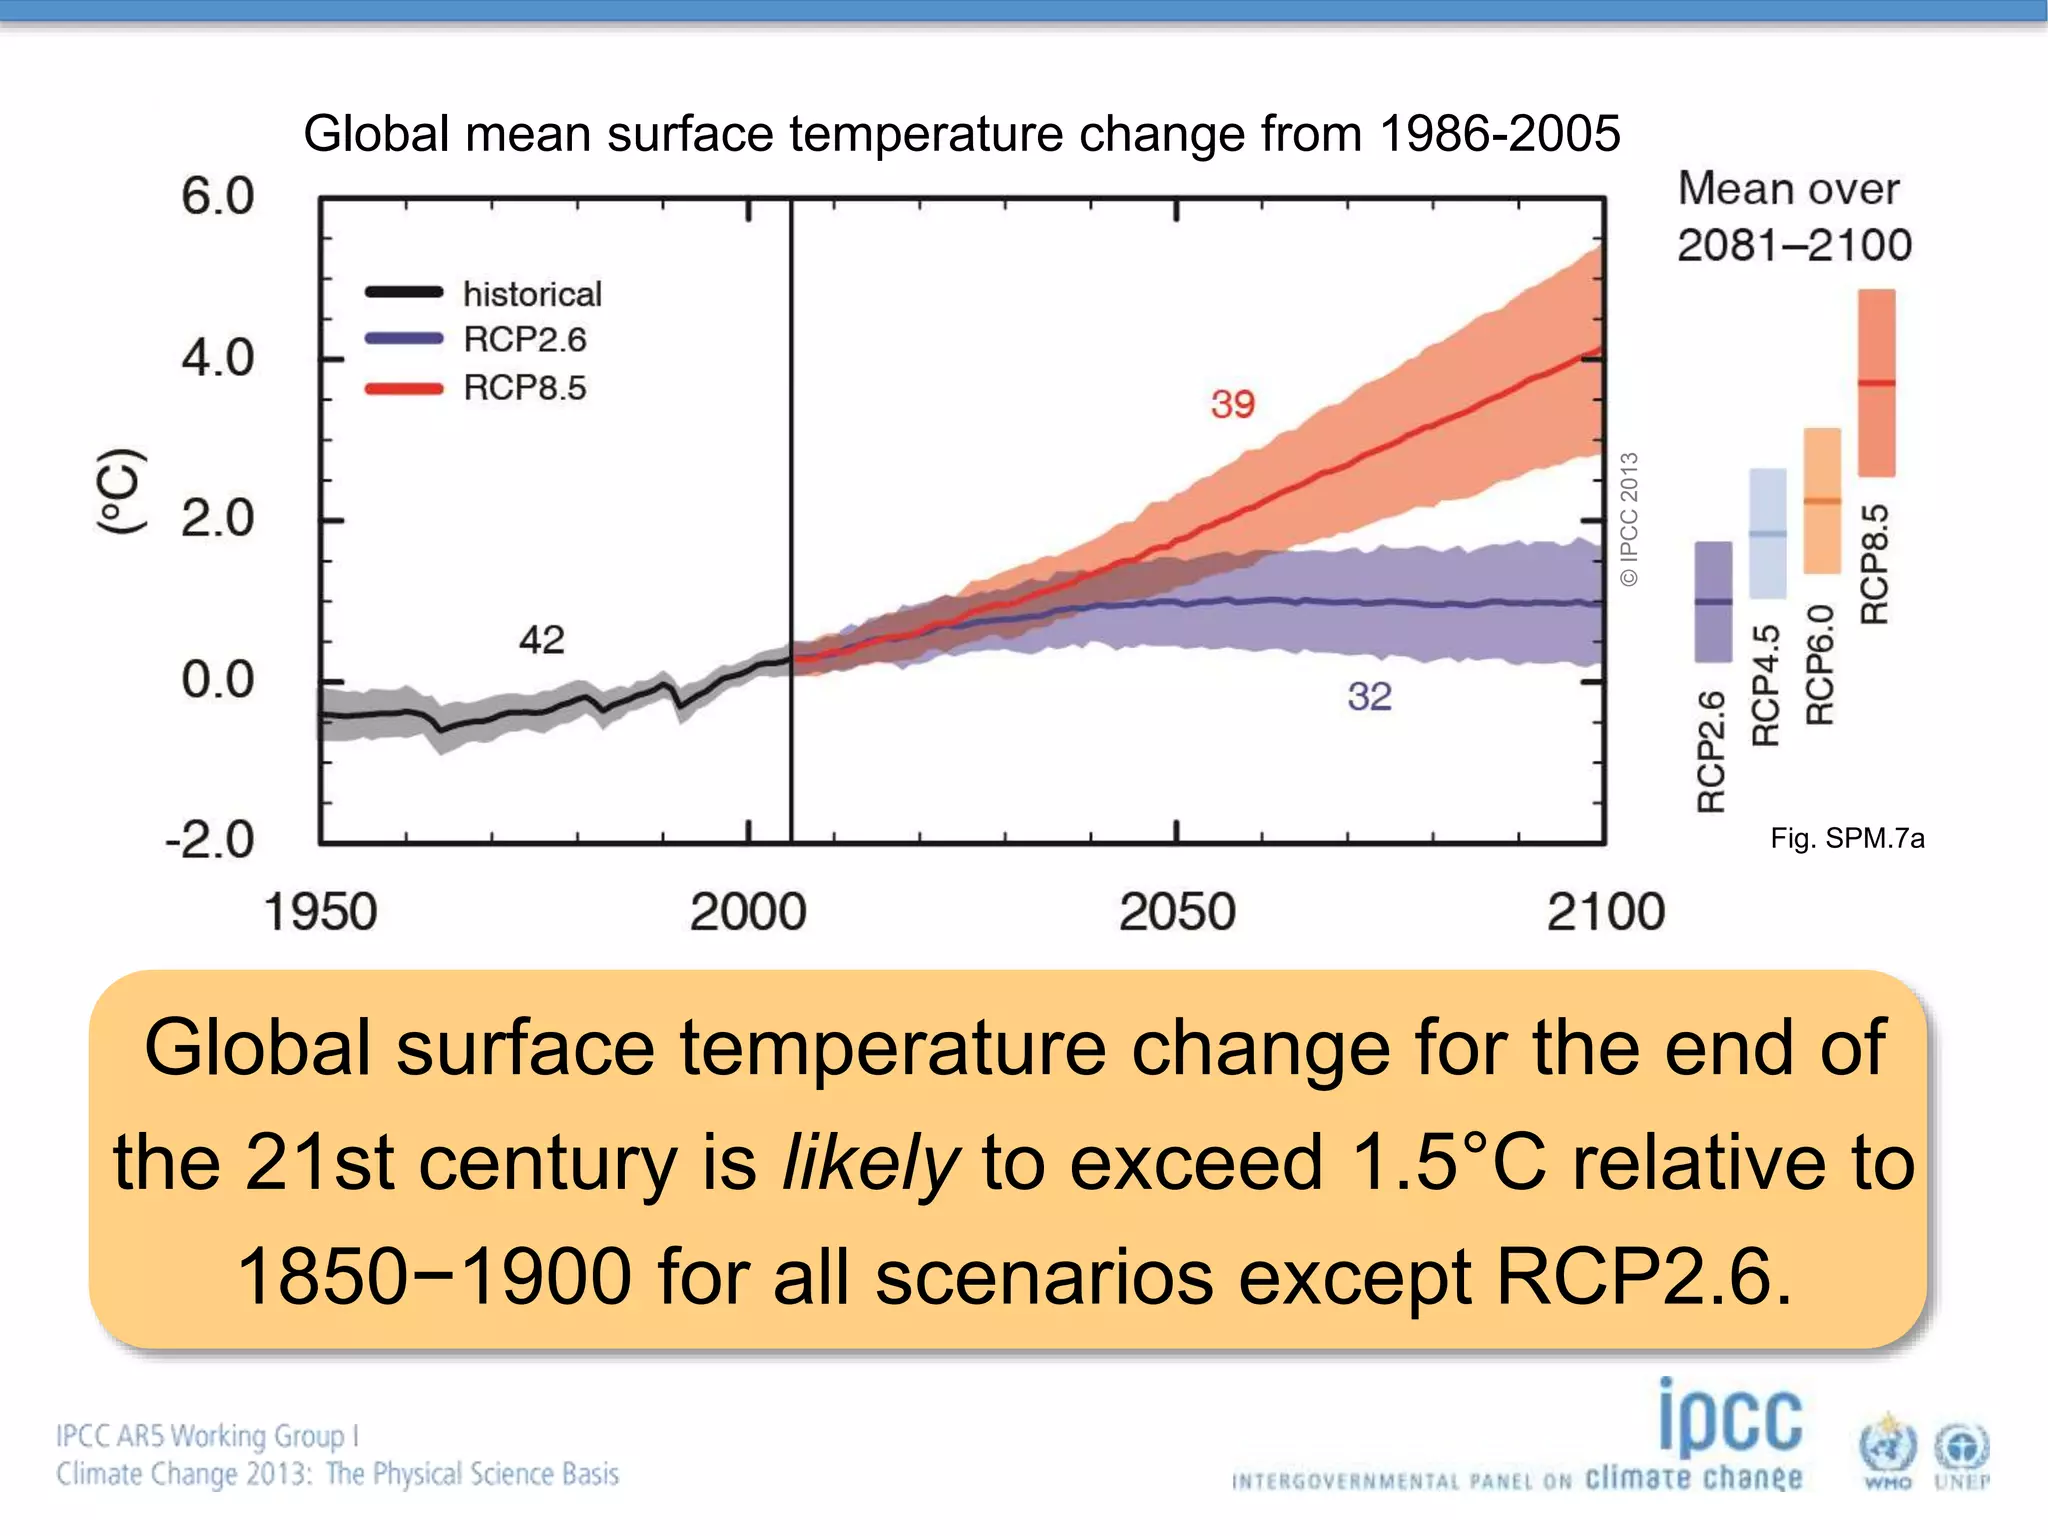
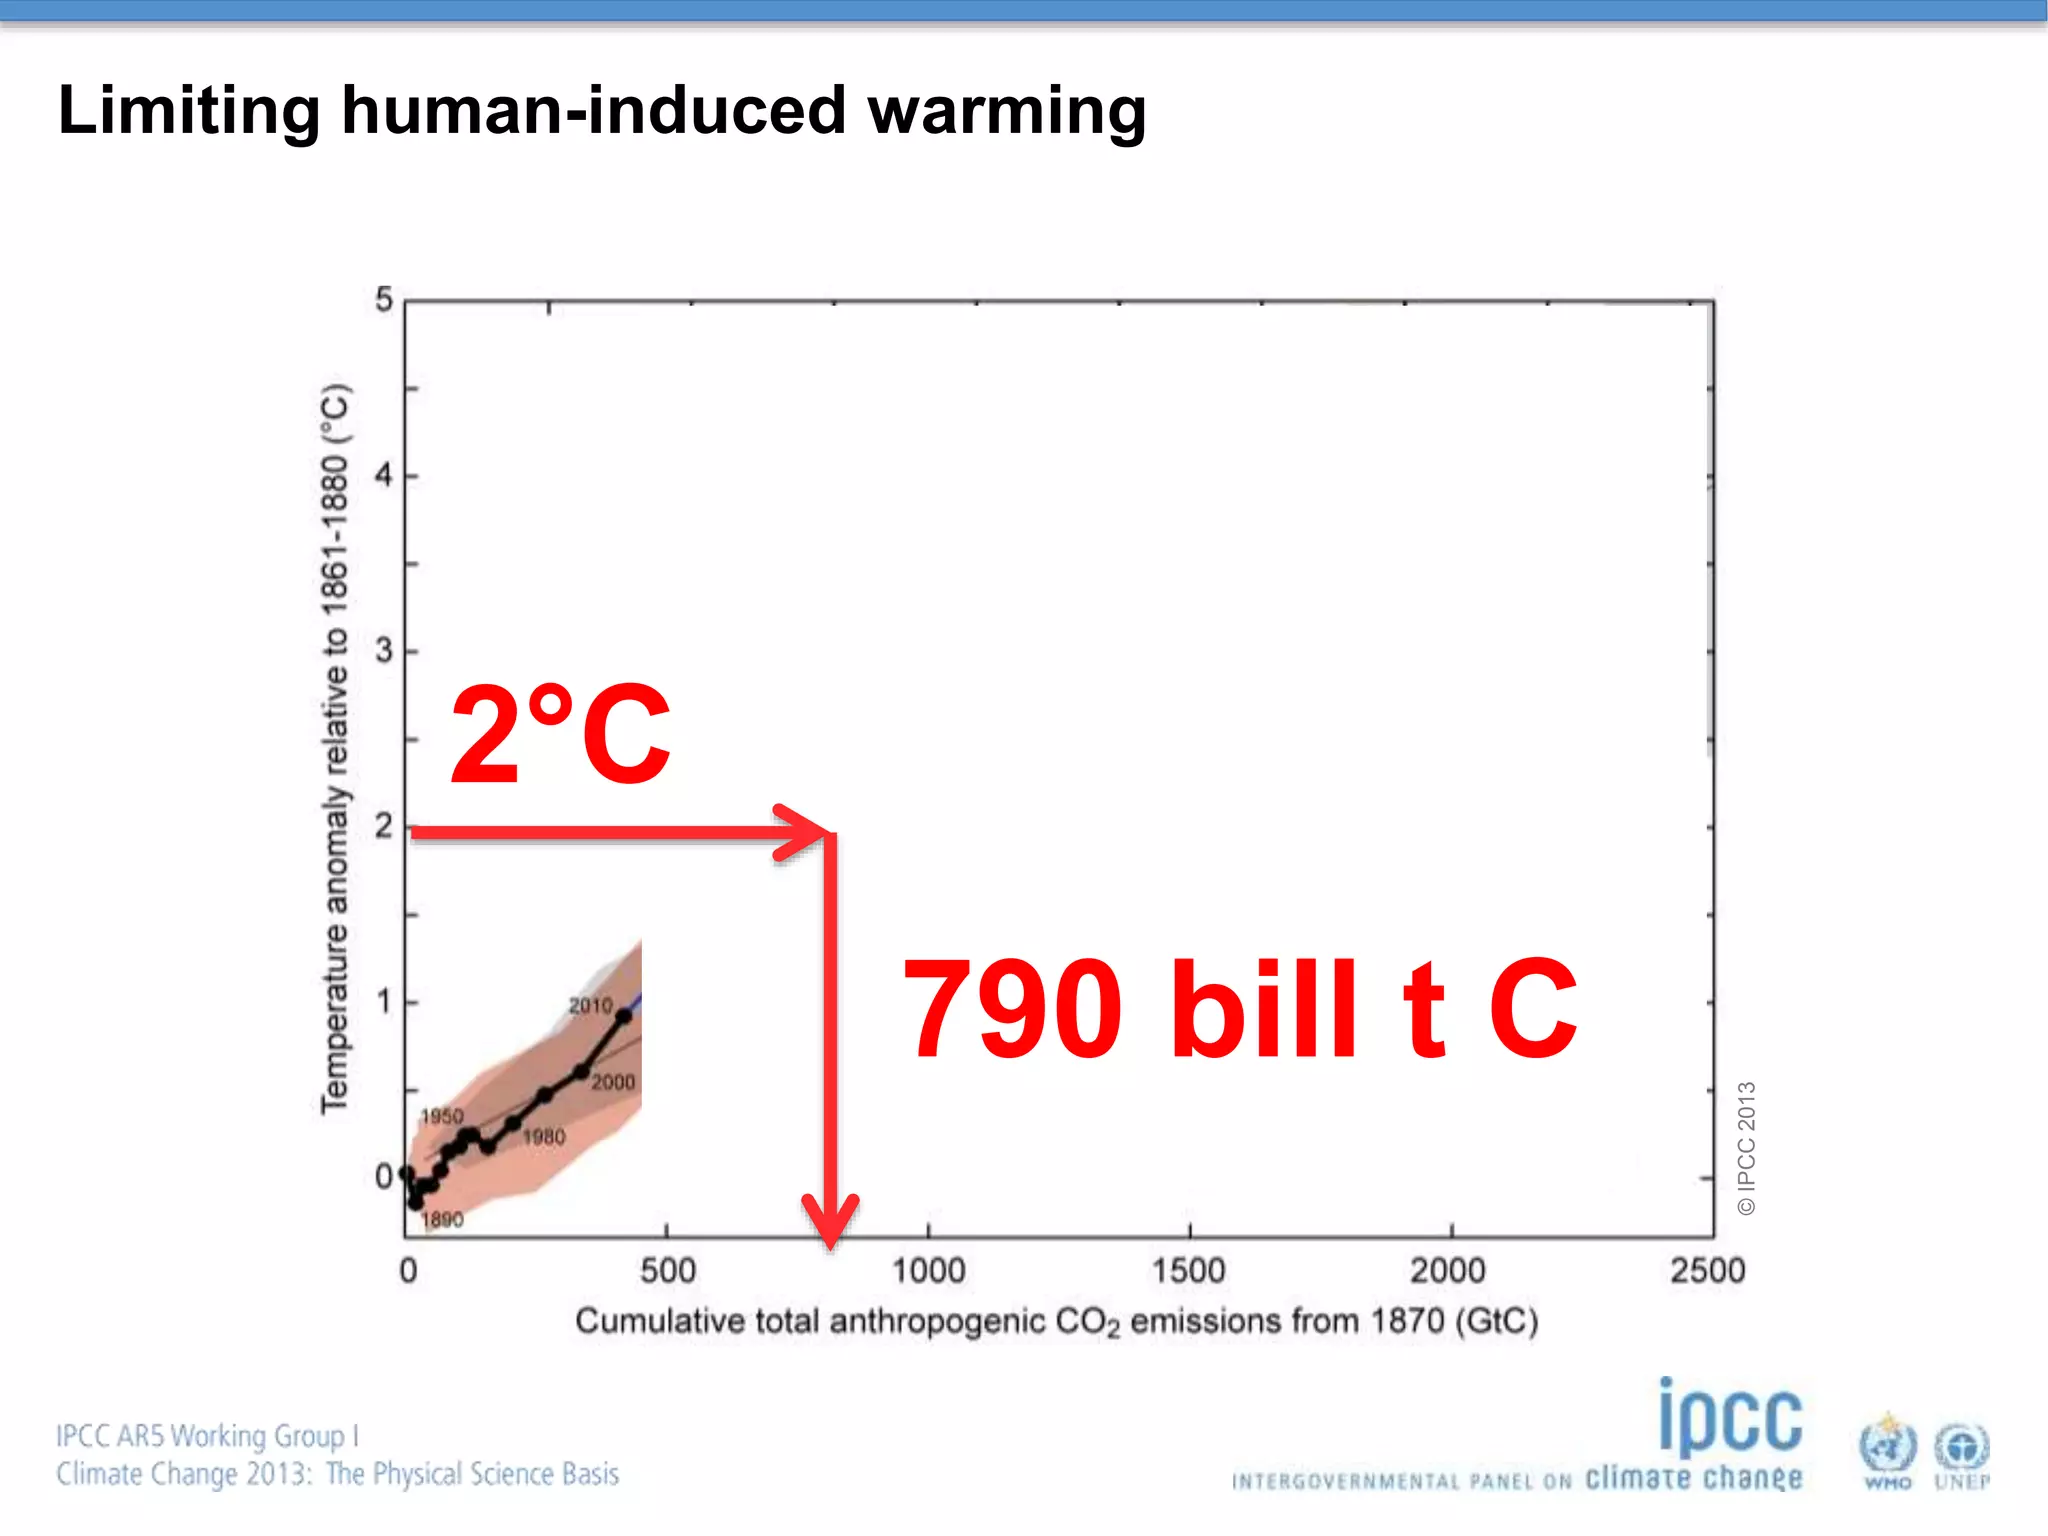
Human influence on the climate system is clear according to observations and scientific understanding. Warming of the climate system is unequivocal, with each of the last three decades likely being the warmest in the last 1400 years in the Northern Hemisphere. Limiting climate change will require substantial reductions in greenhouse gas emissions to keep global temperature increases below 2°C compared to pre-industrial levels.

![Warming in the climate system
is unequivocal, […]
Human influence on the
climate system is clear.
Limiting climate change will require
substantial and sustained reductions of
greenhouse gas emissions.](https://image.slidesharecdn.com/fuglestvedtaddisfirstpres-170429062221/75/Climate-Change-The-physical-science-basis-3-2048.jpg)


![Fig.SPM.1b
Temperature Difference 1901 to 2012 based on trend (°C)
Fig.SPM.2
Precipitation Trend (mm/yr per decade)
© IPCC 2013© IPCC 2013
Warming of the climate system
is unequivocal, […]](https://image.slidesharecdn.com/fuglestvedtaddisfirstpres-170429062221/75/Climate-Change-The-physical-science-basis-6-2048.jpg)
![Fig. SPM.3
Warming of the climate system
is unequivocal, […]
©IPCC2013](https://image.slidesharecdn.com/fuglestvedtaddisfirstpres-170429062221/75/Climate-Change-The-physical-science-basis-7-2048.jpg)