The document summarizes key findings from the IPCC 2013/2014 report on climate change science:
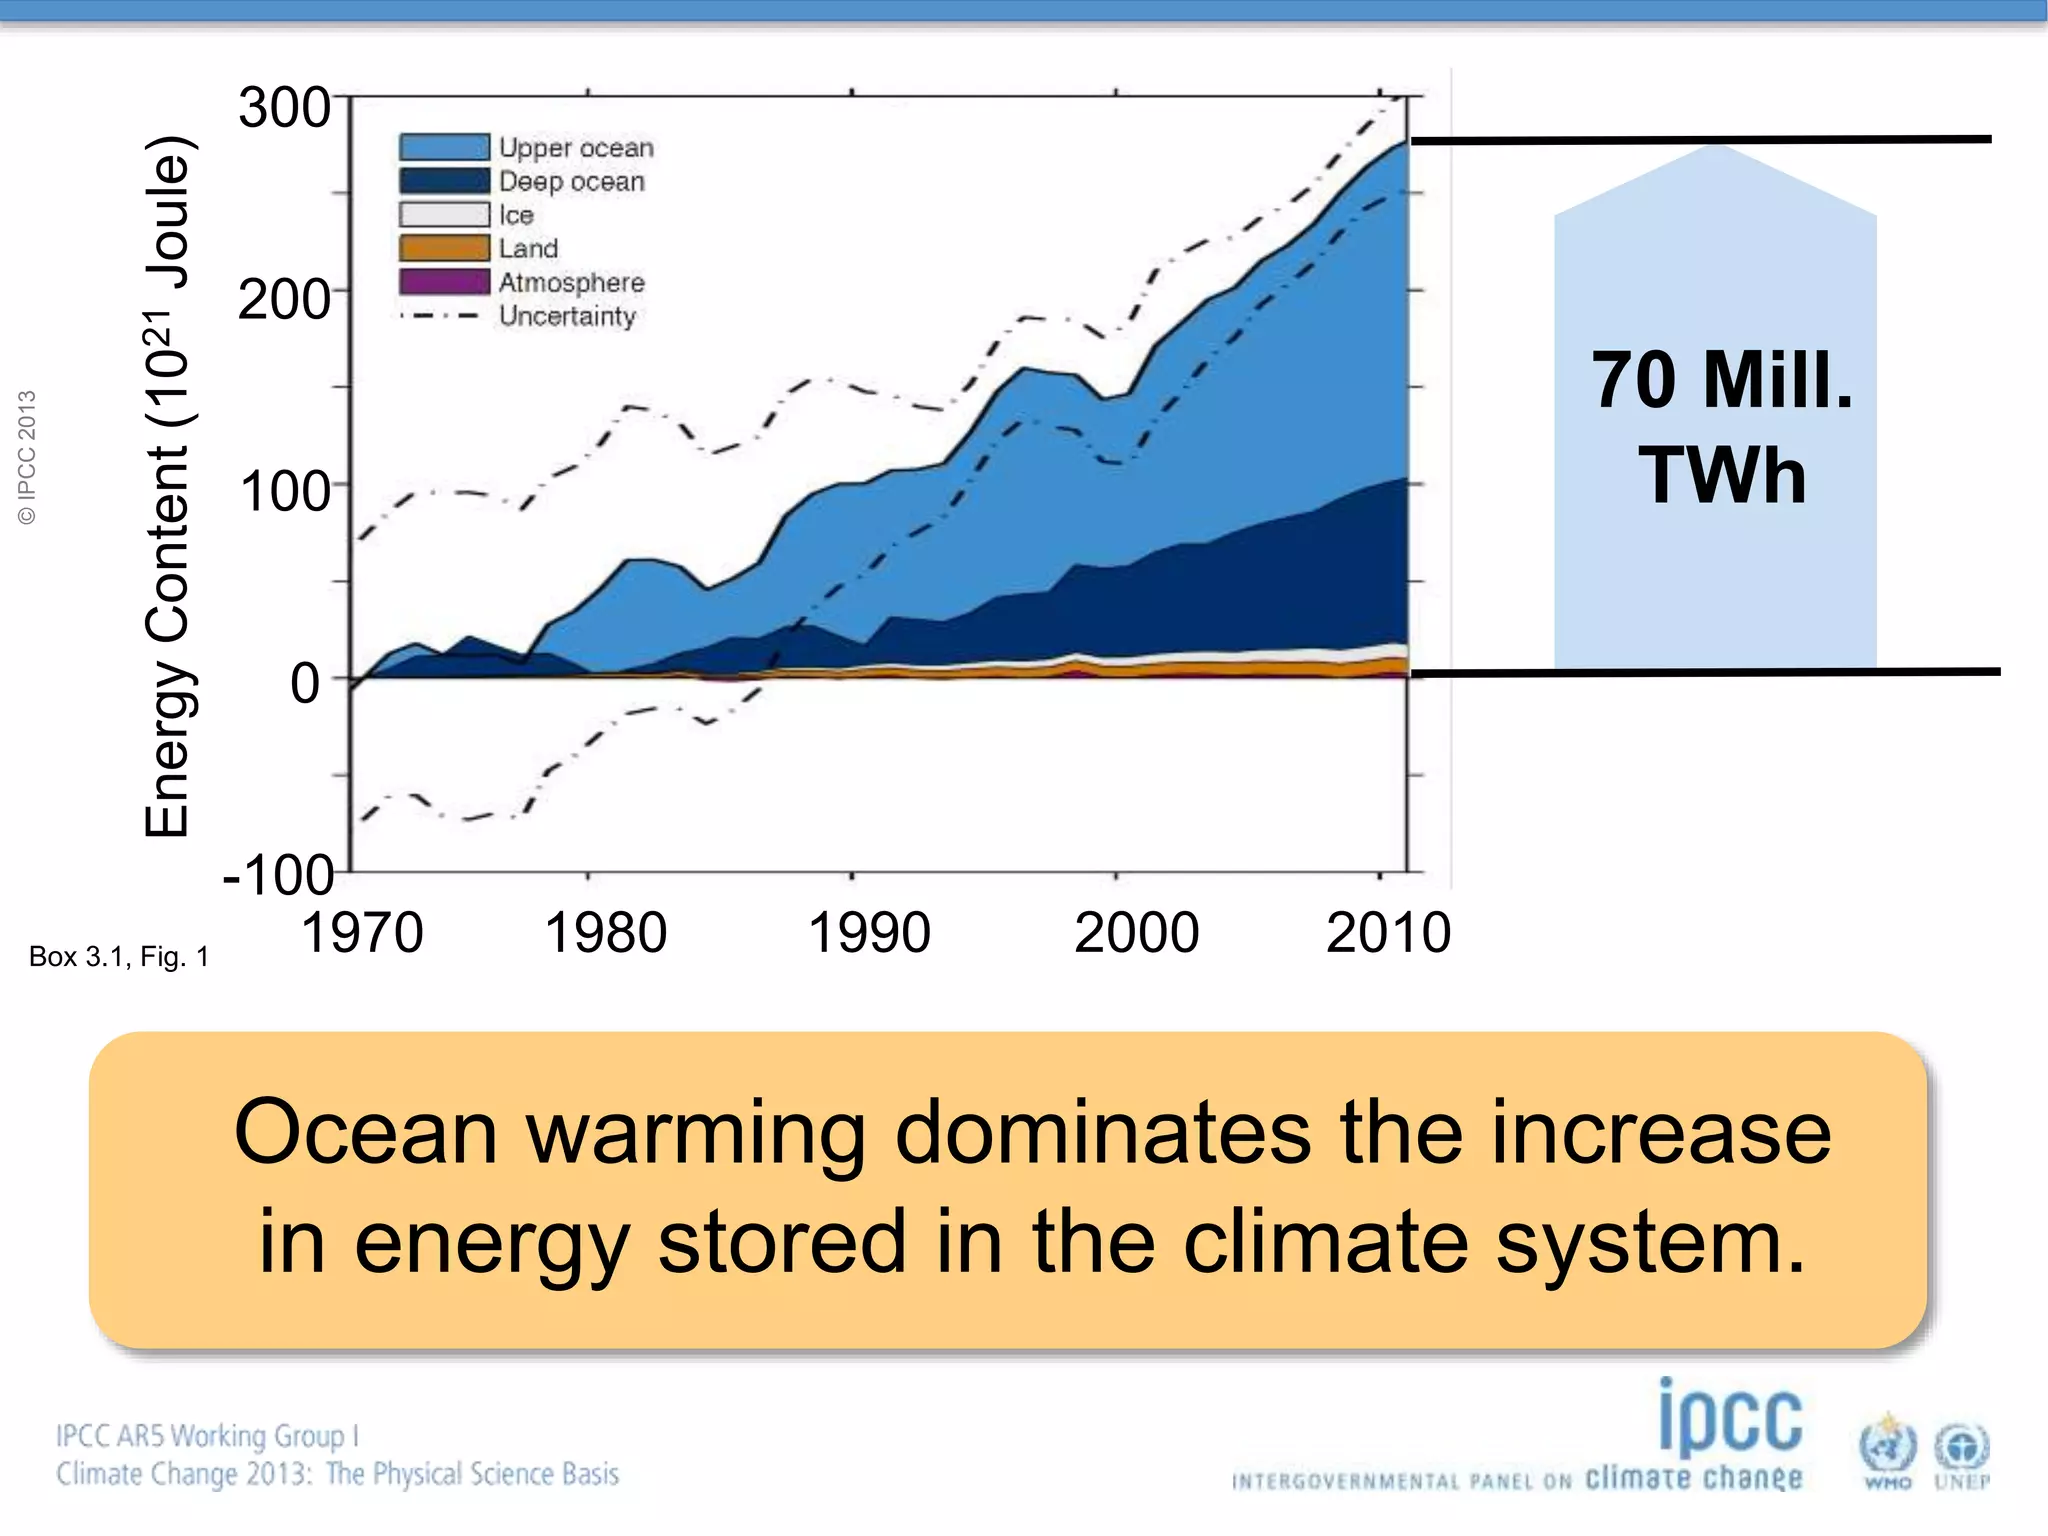
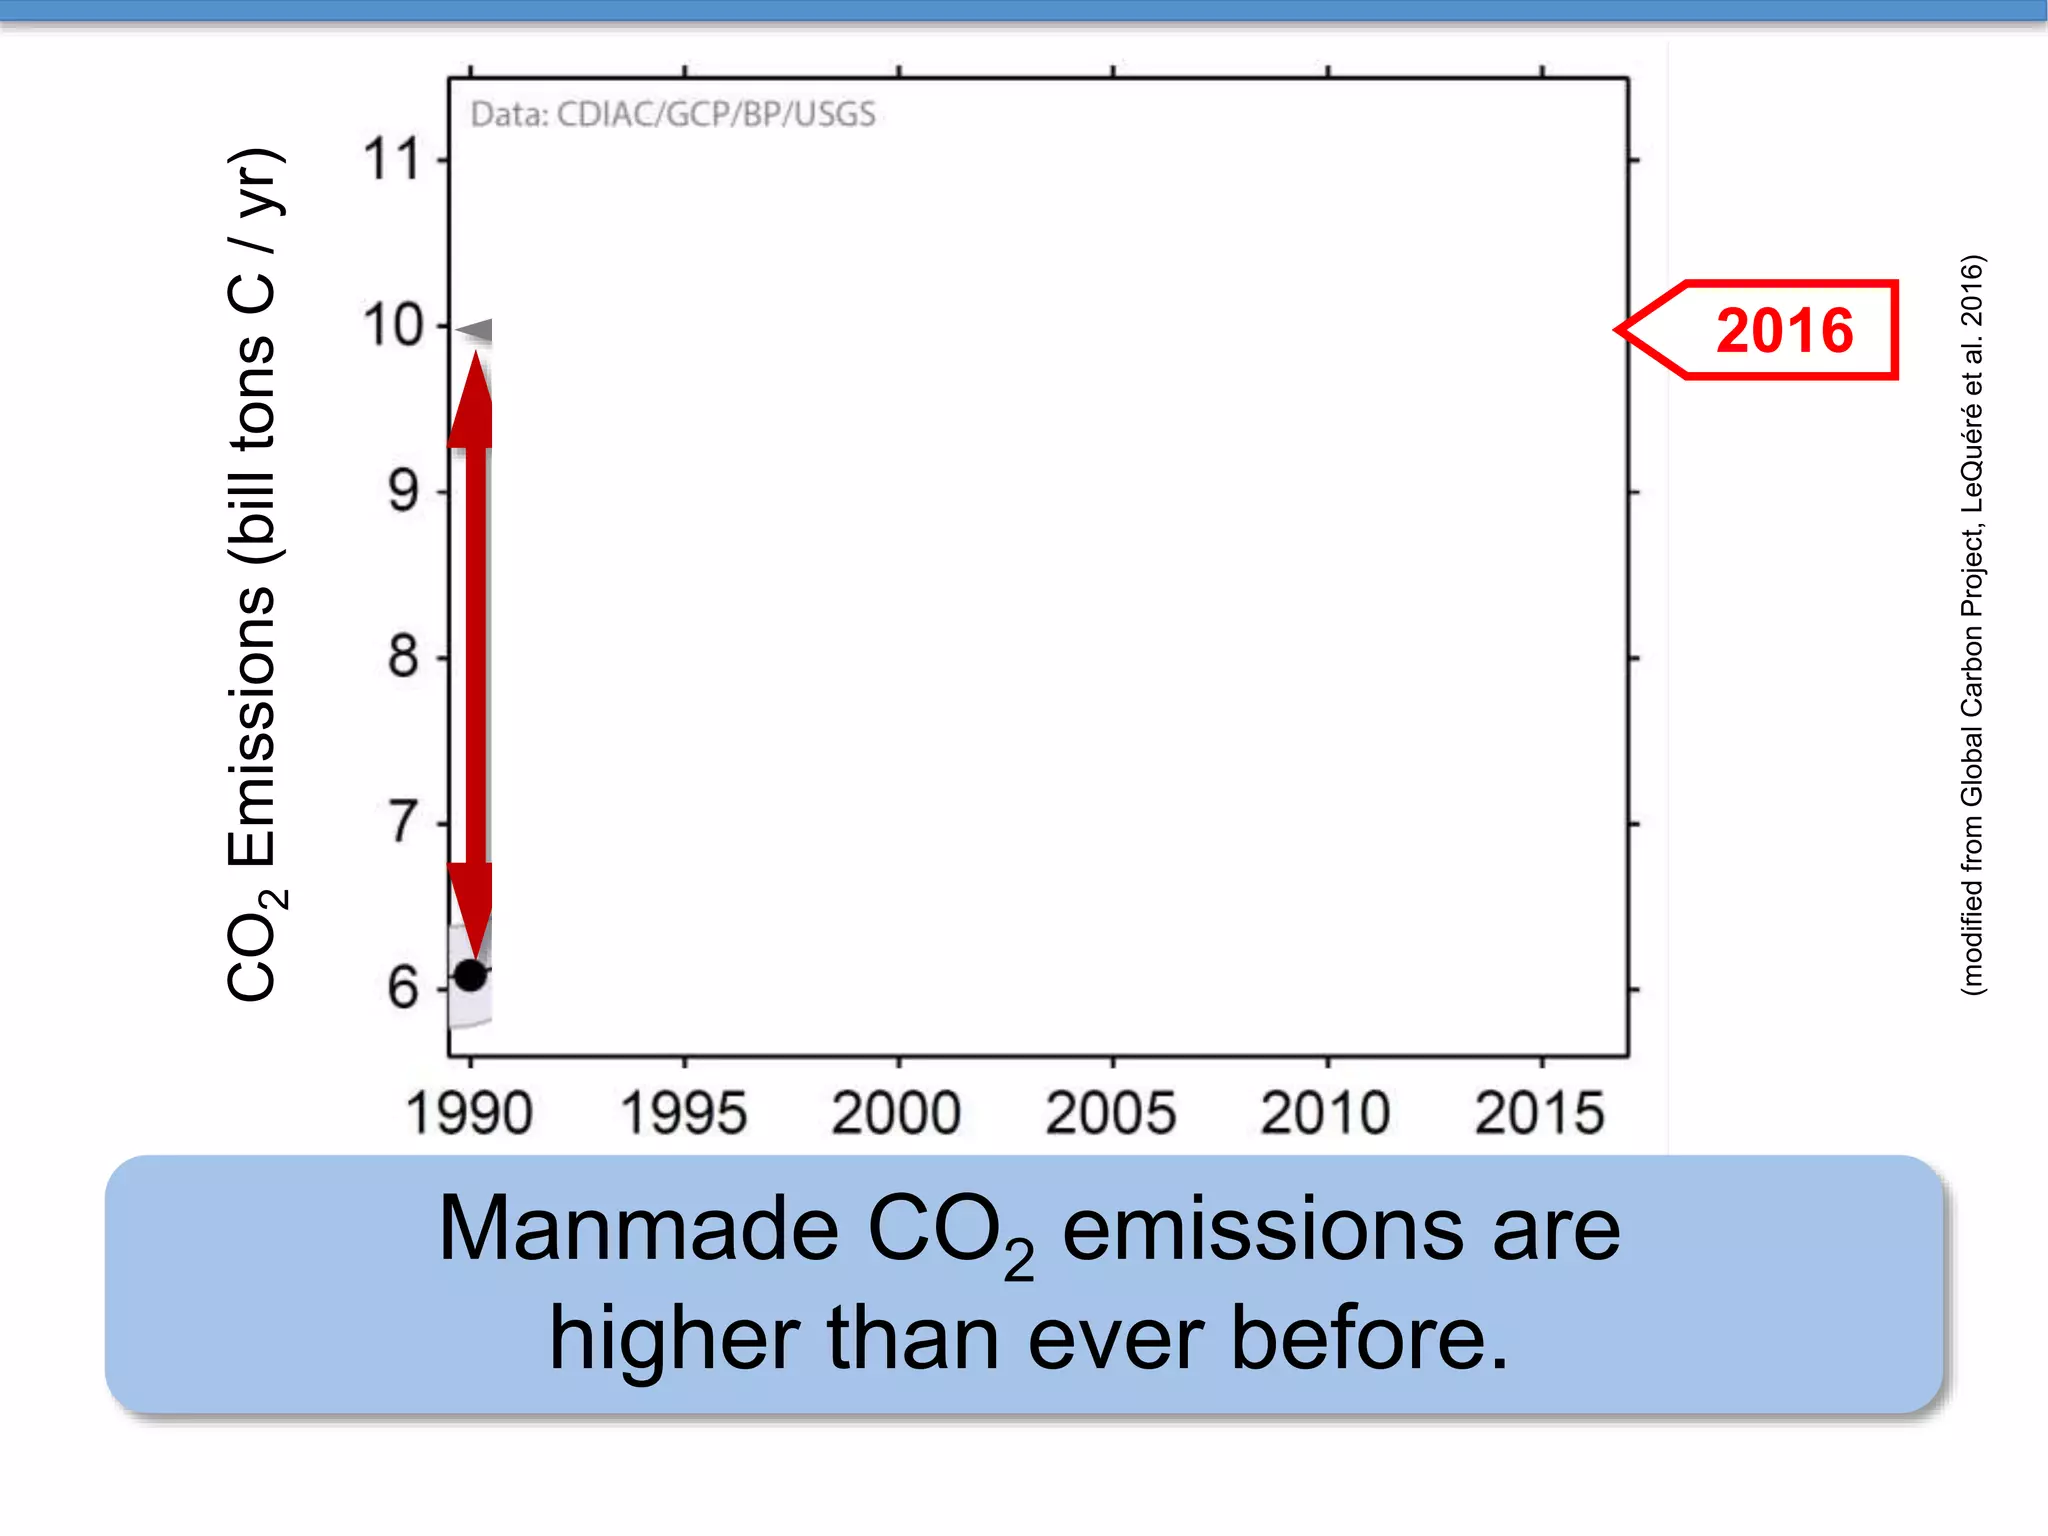
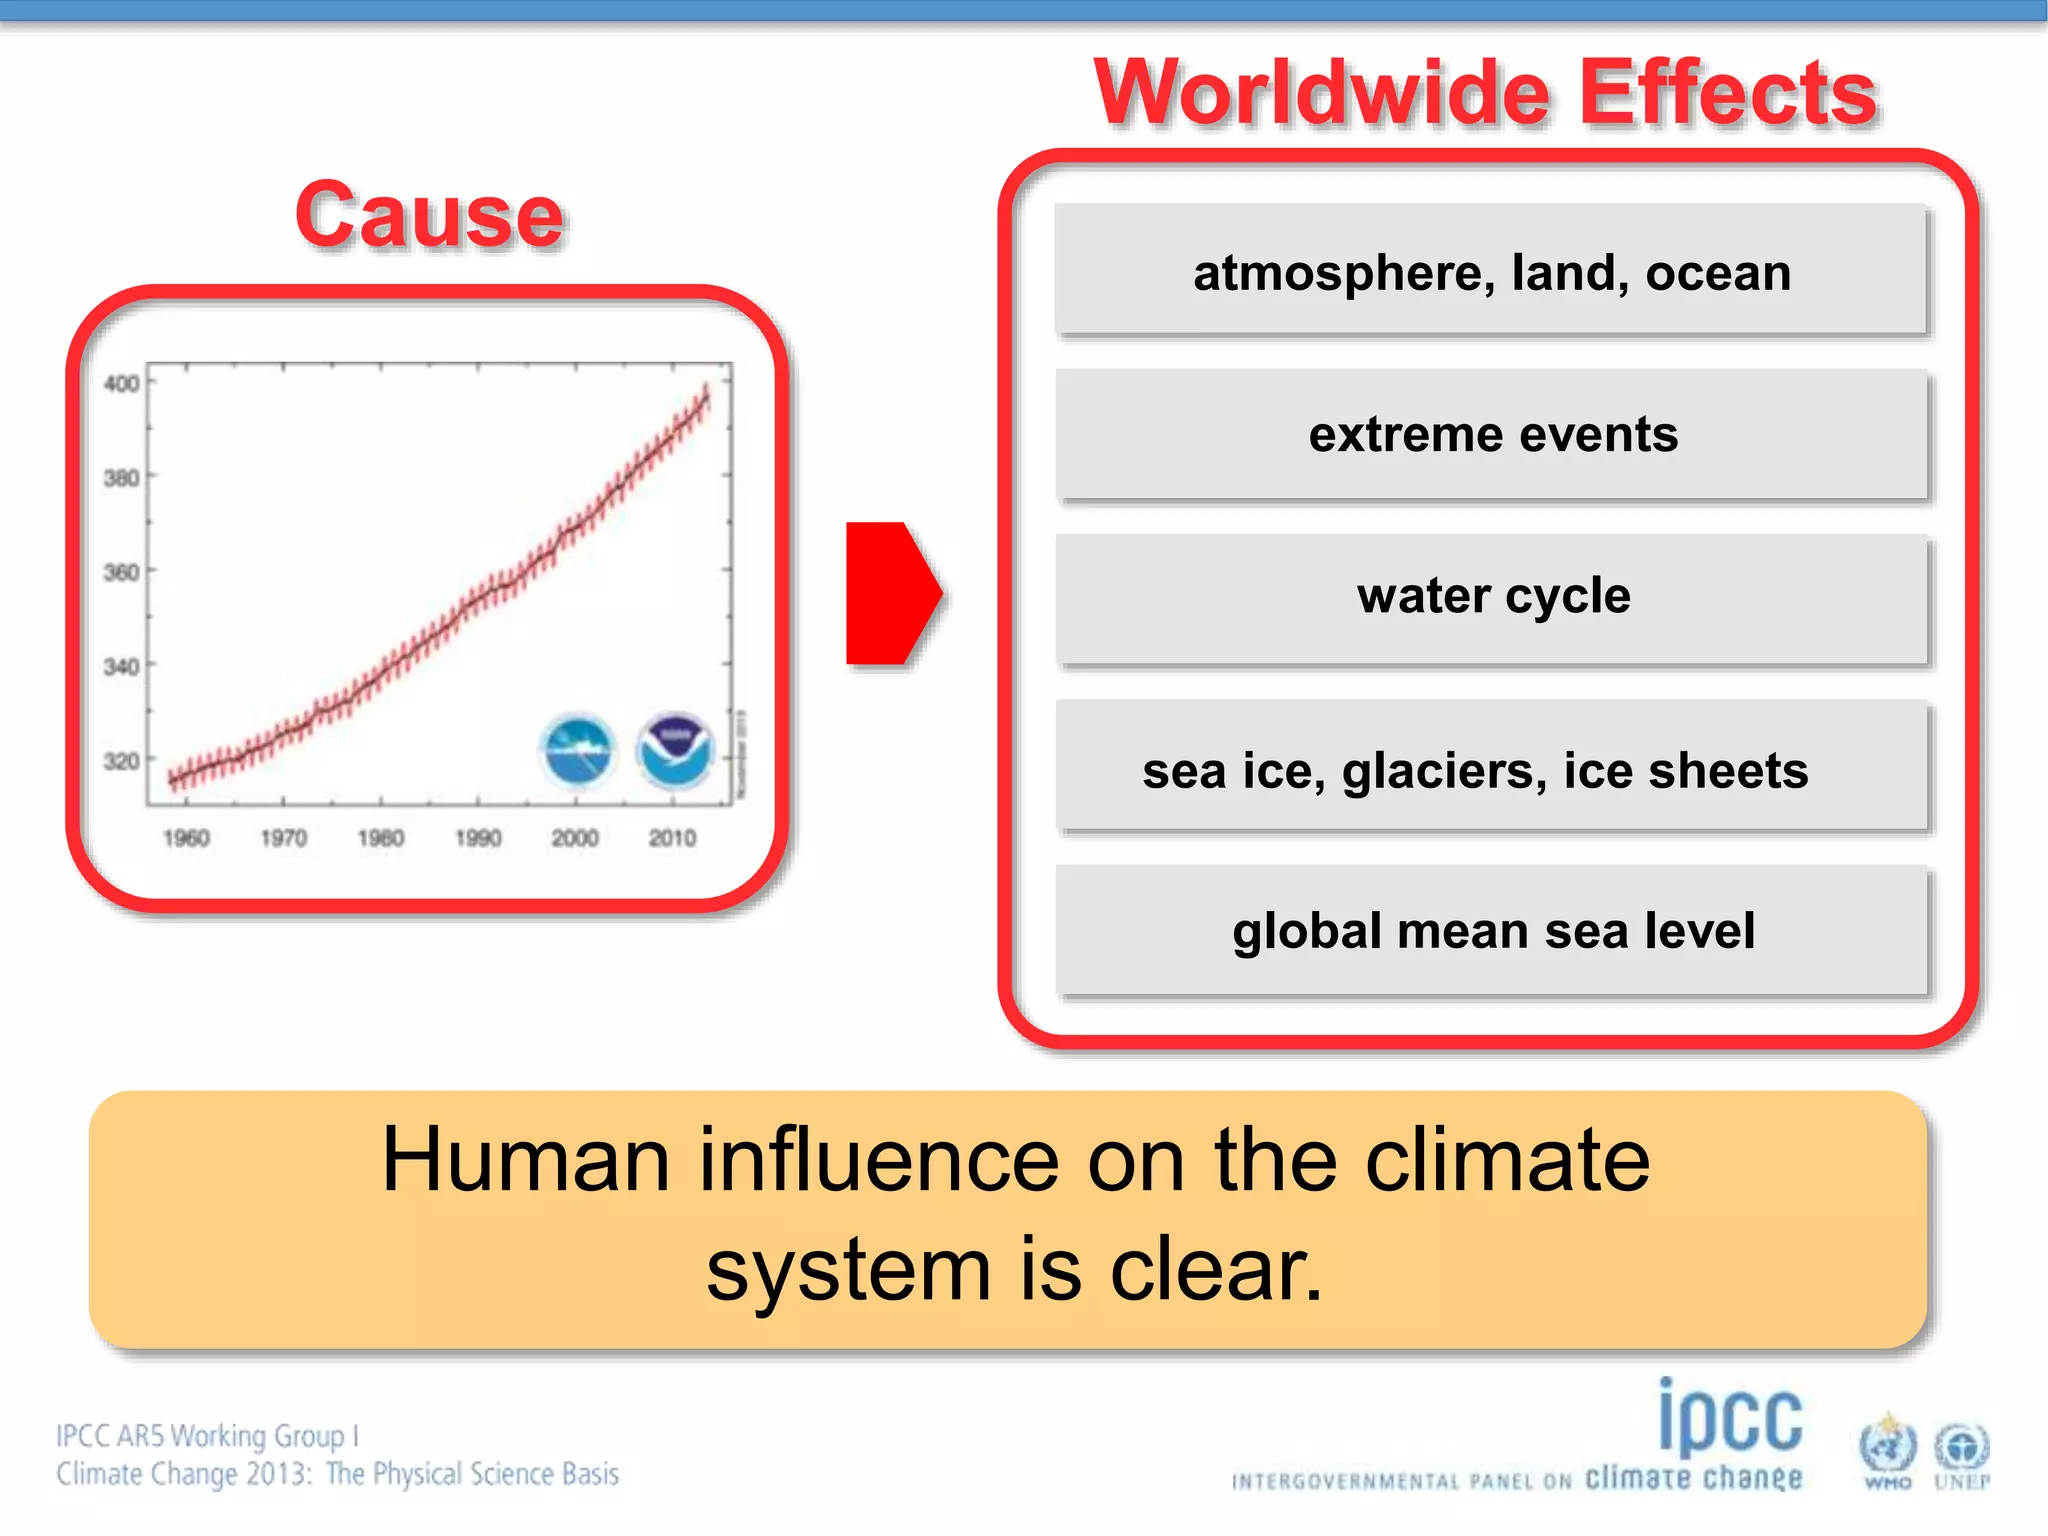
1) Warming of the climate system is unequivocal and human influence is clear based on increased greenhouse gas emissions and energy stored in oceans and atmosphere.
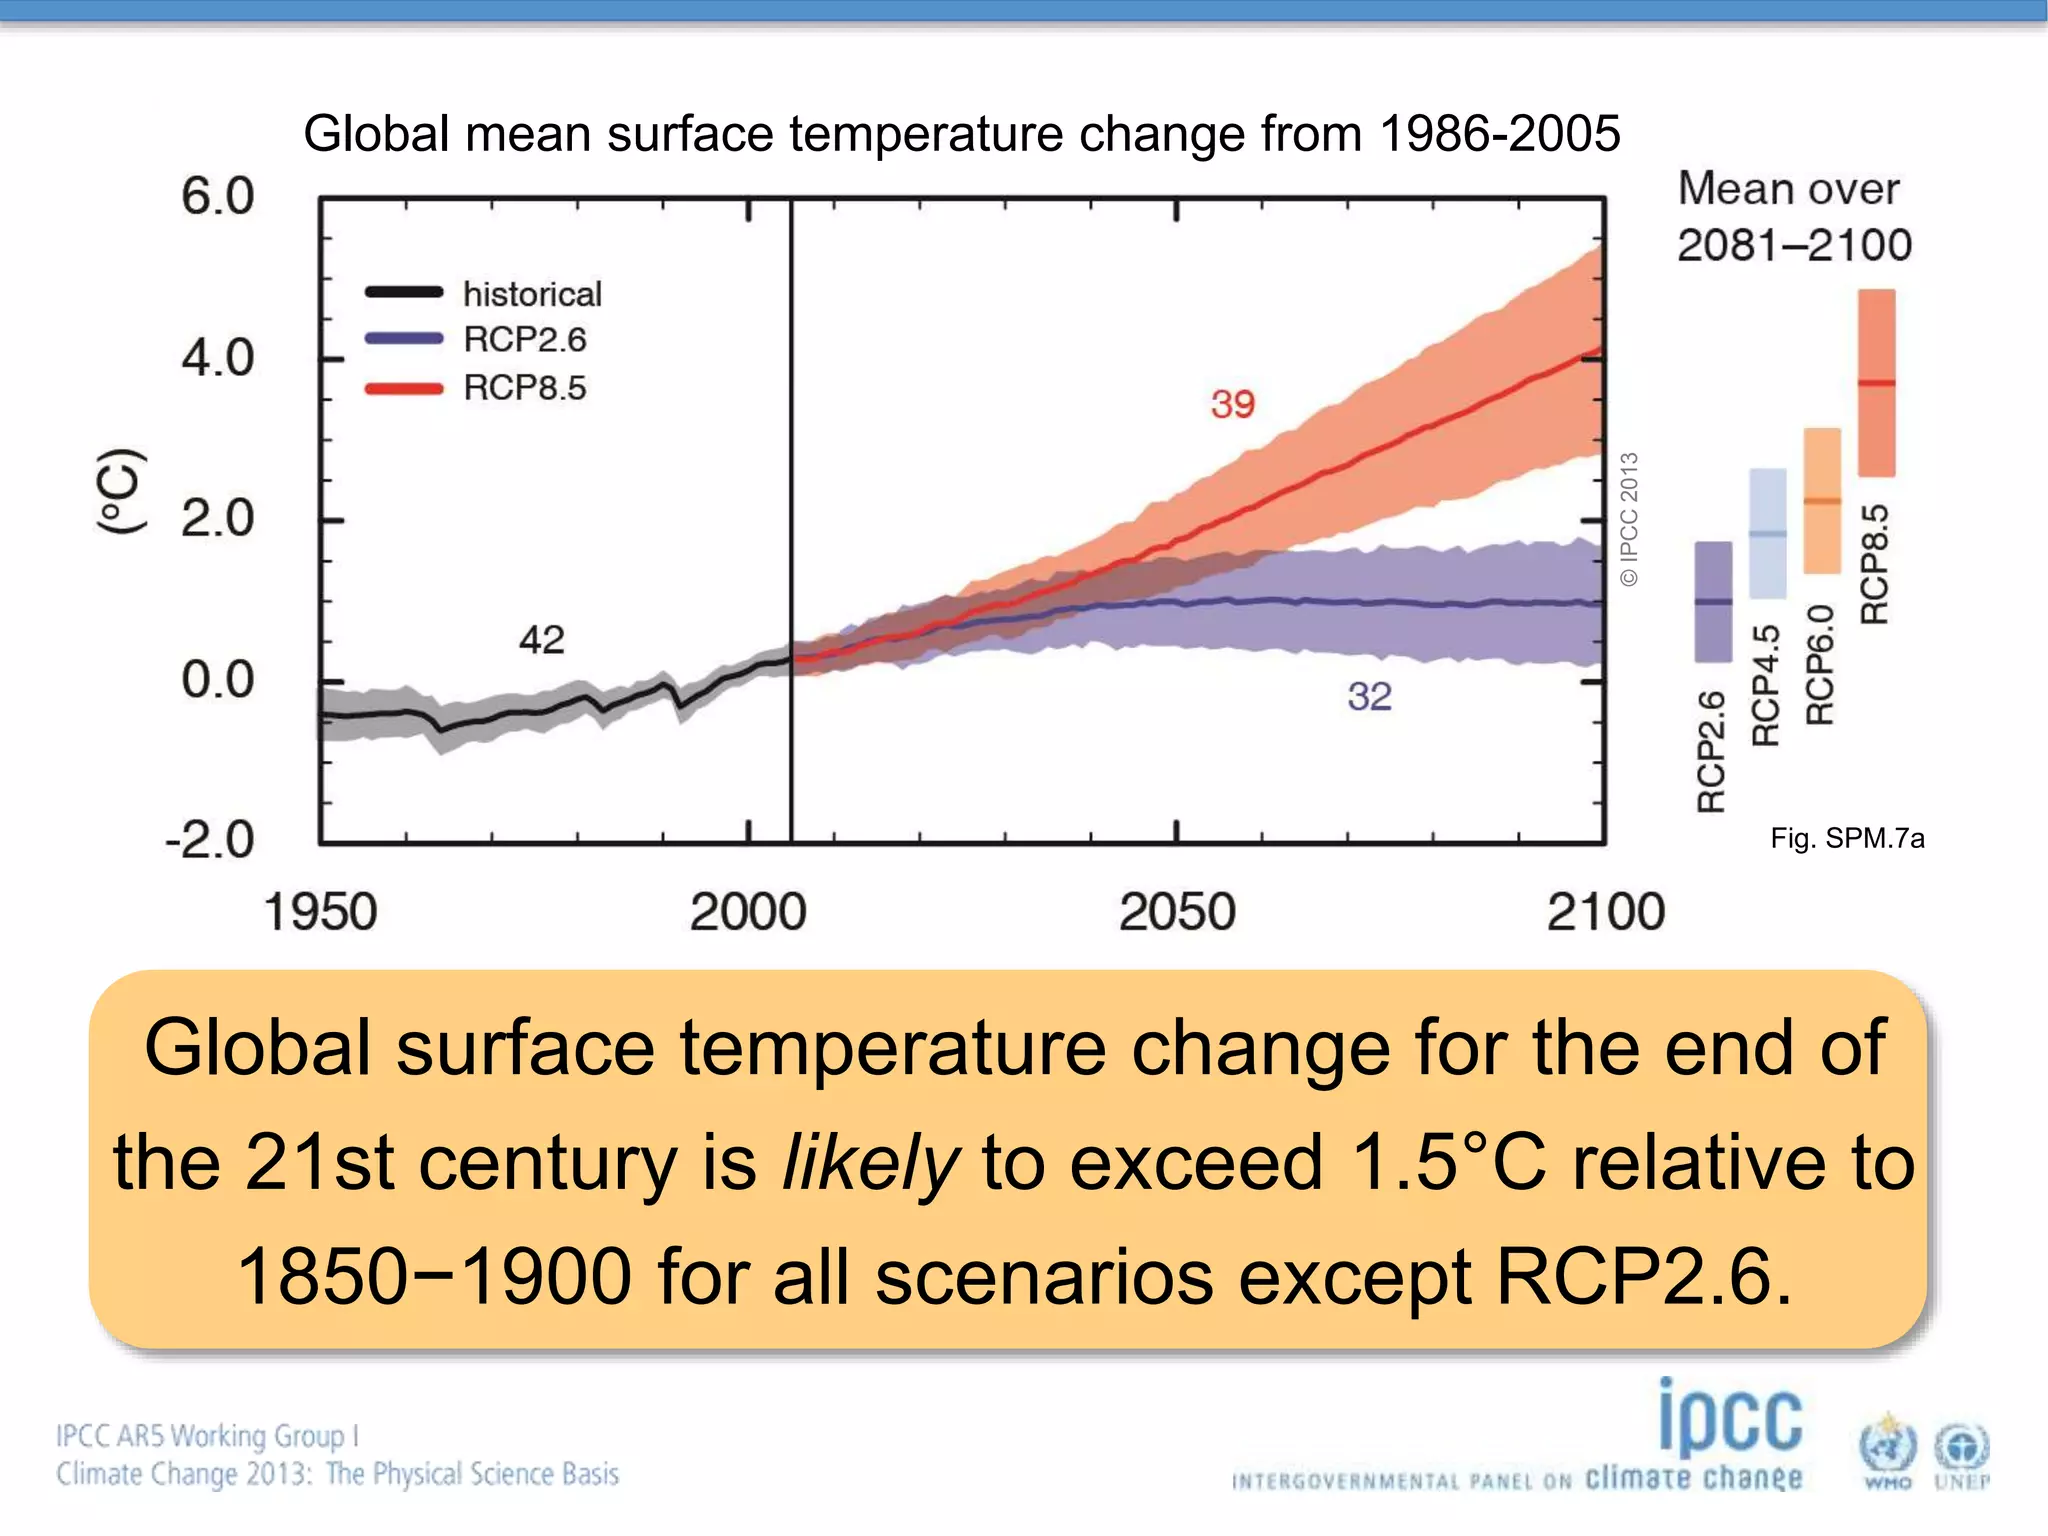
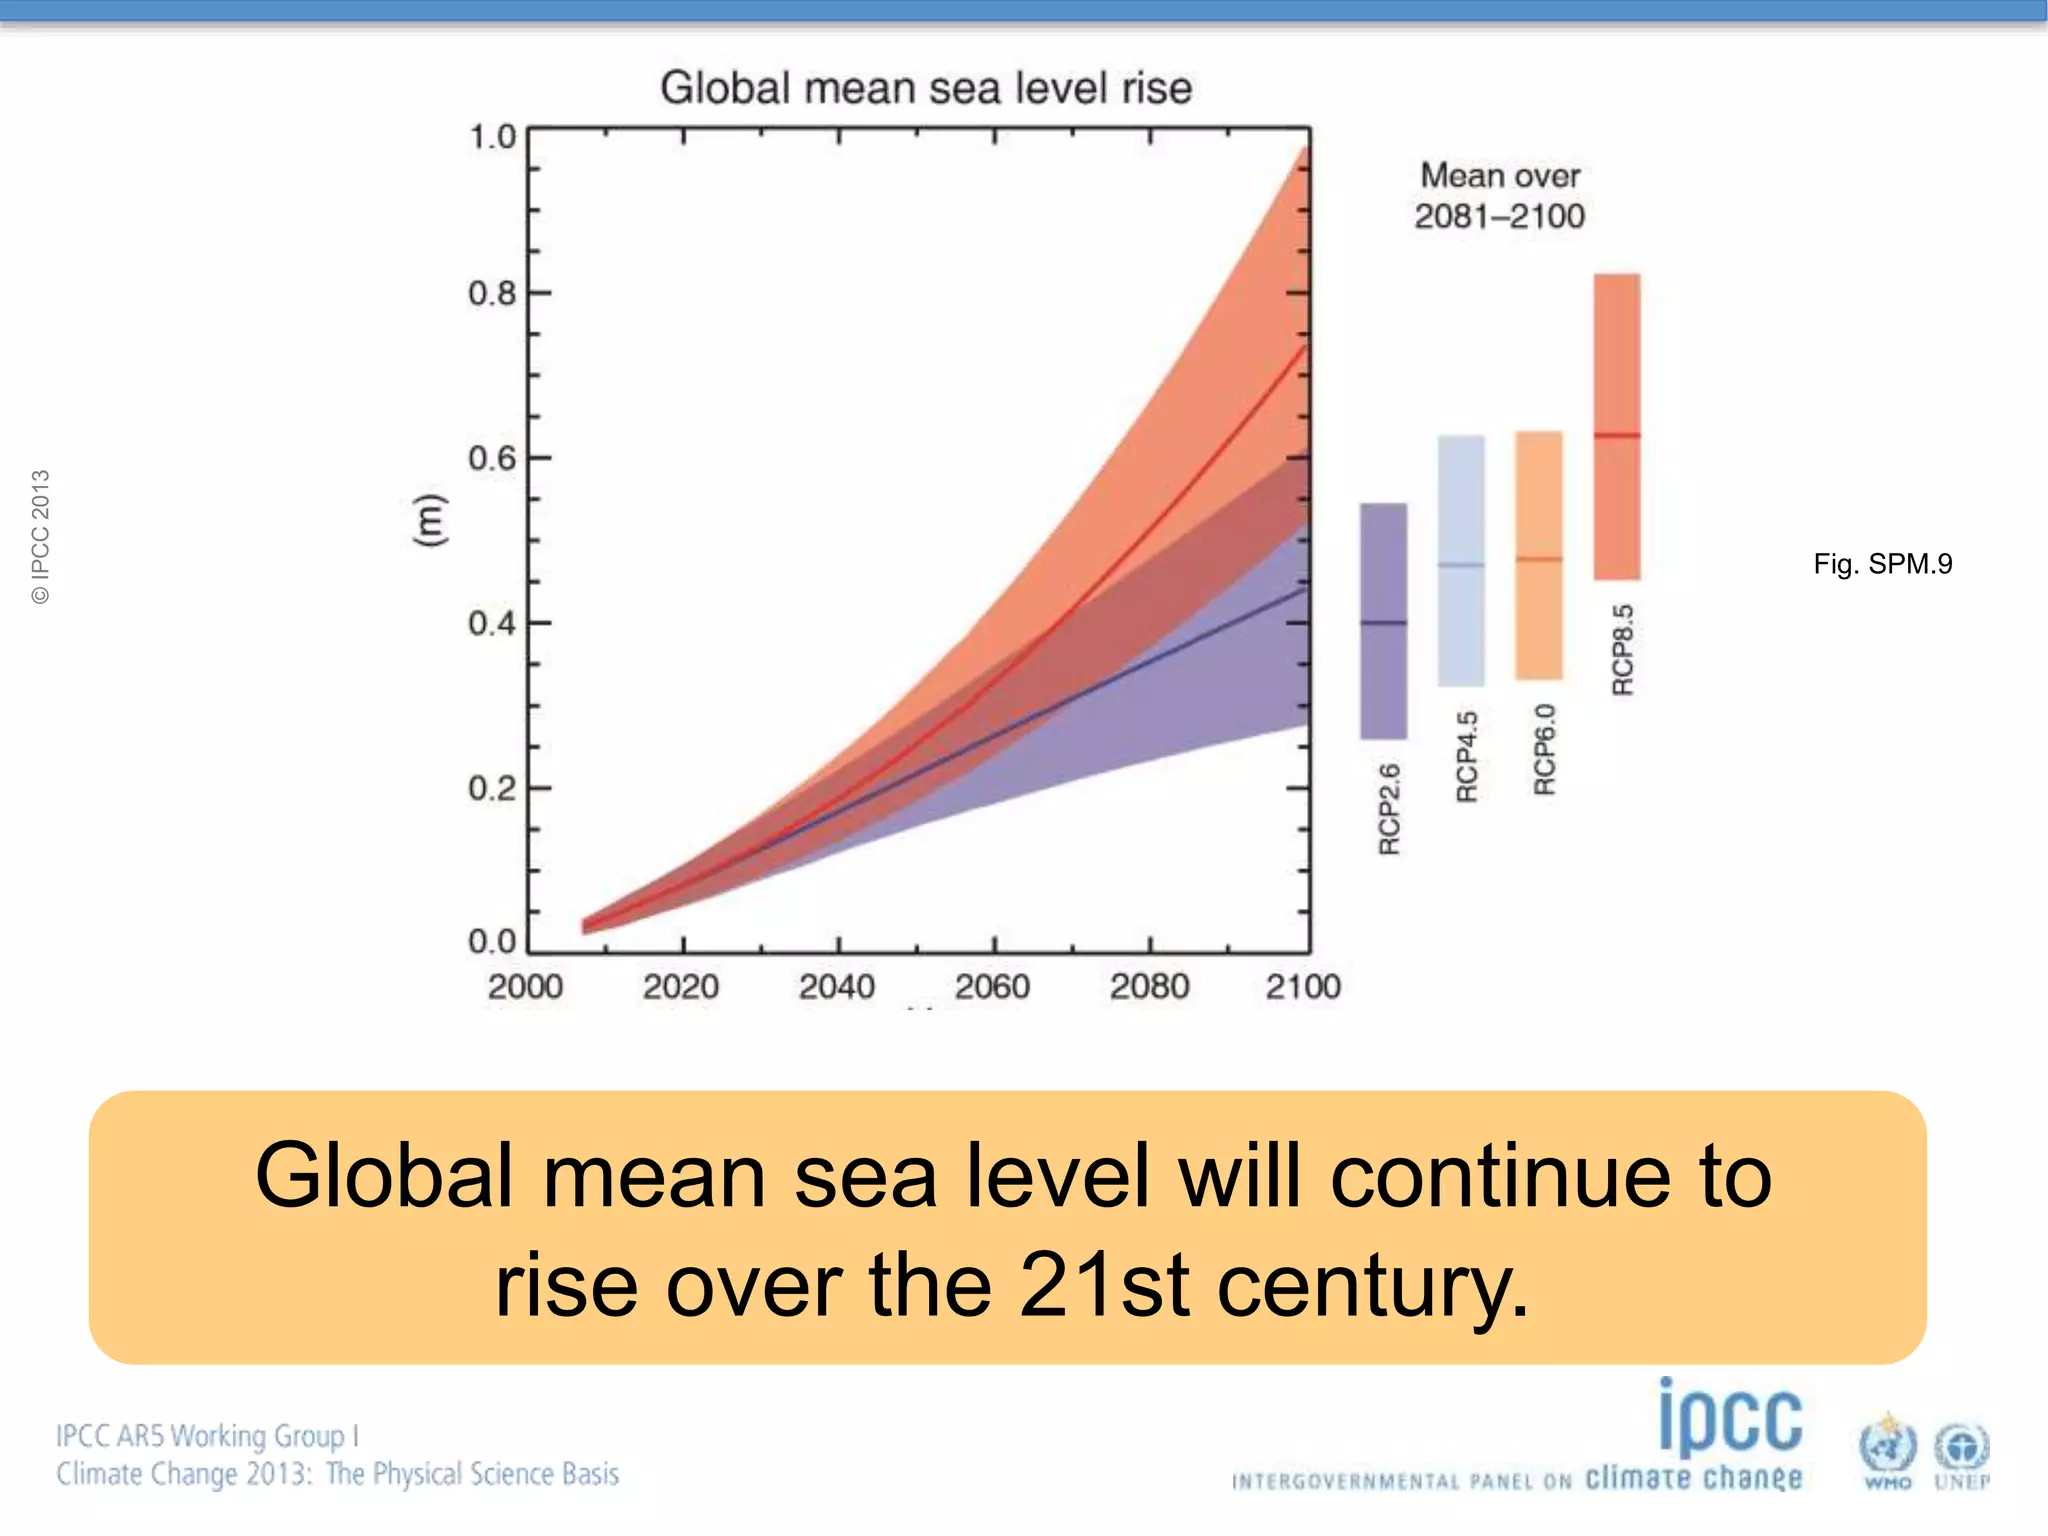
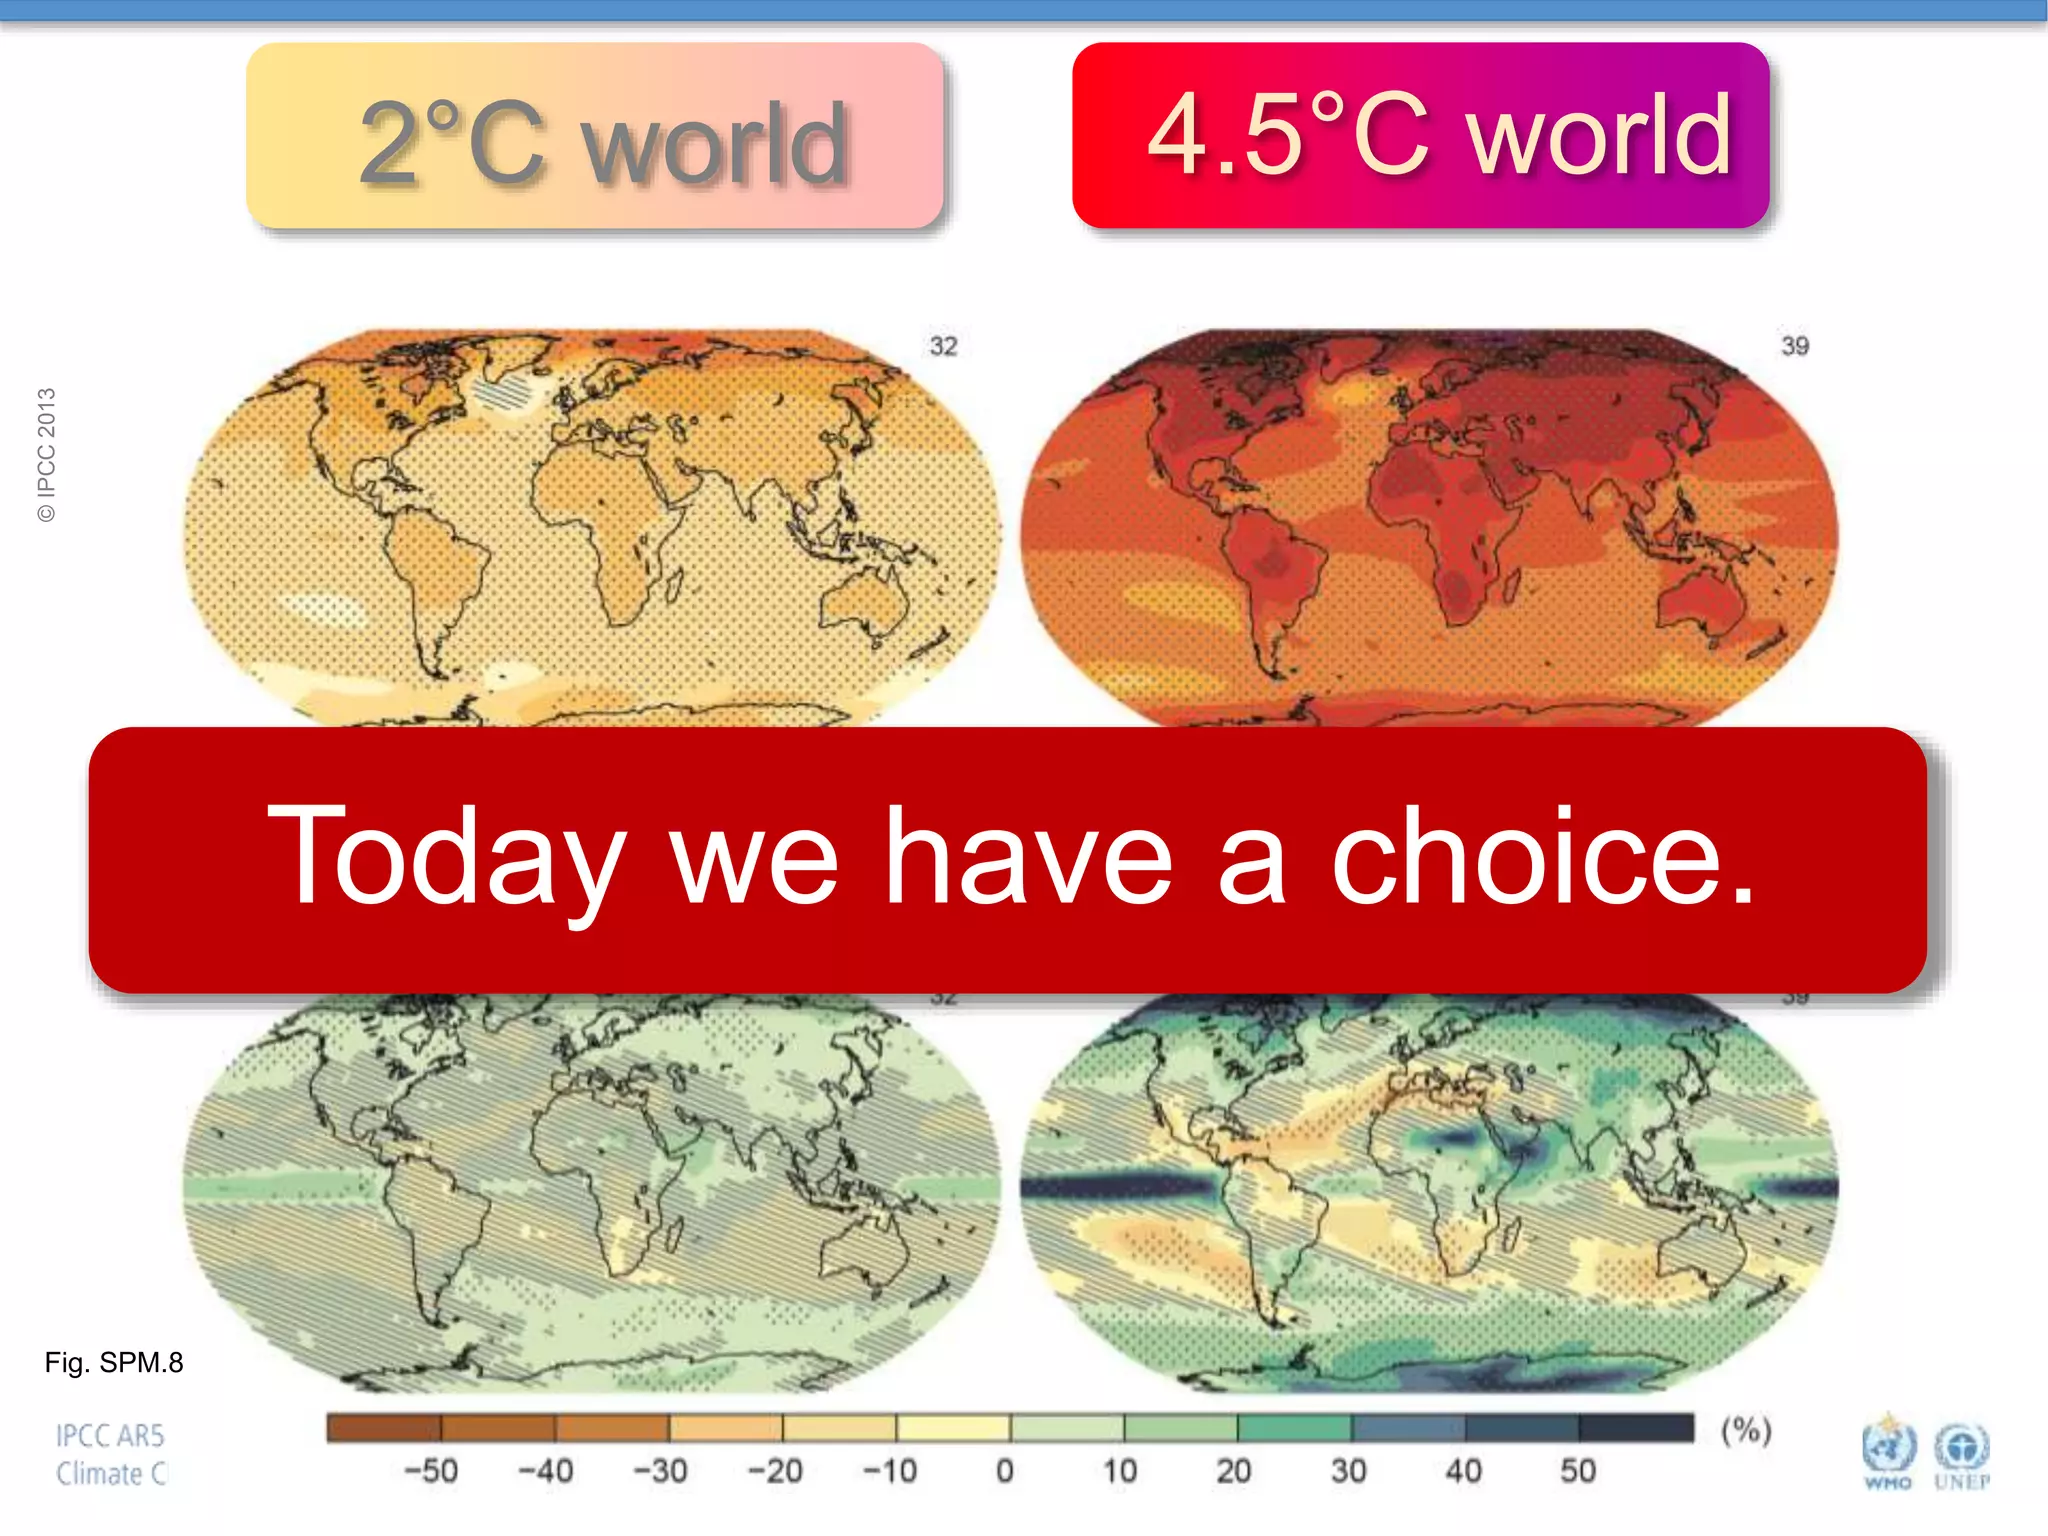
2) If emissions continue at a high level, global temperature increases by the late 21st century will likely exceed 1.5°C compared to pre-industrial levels.
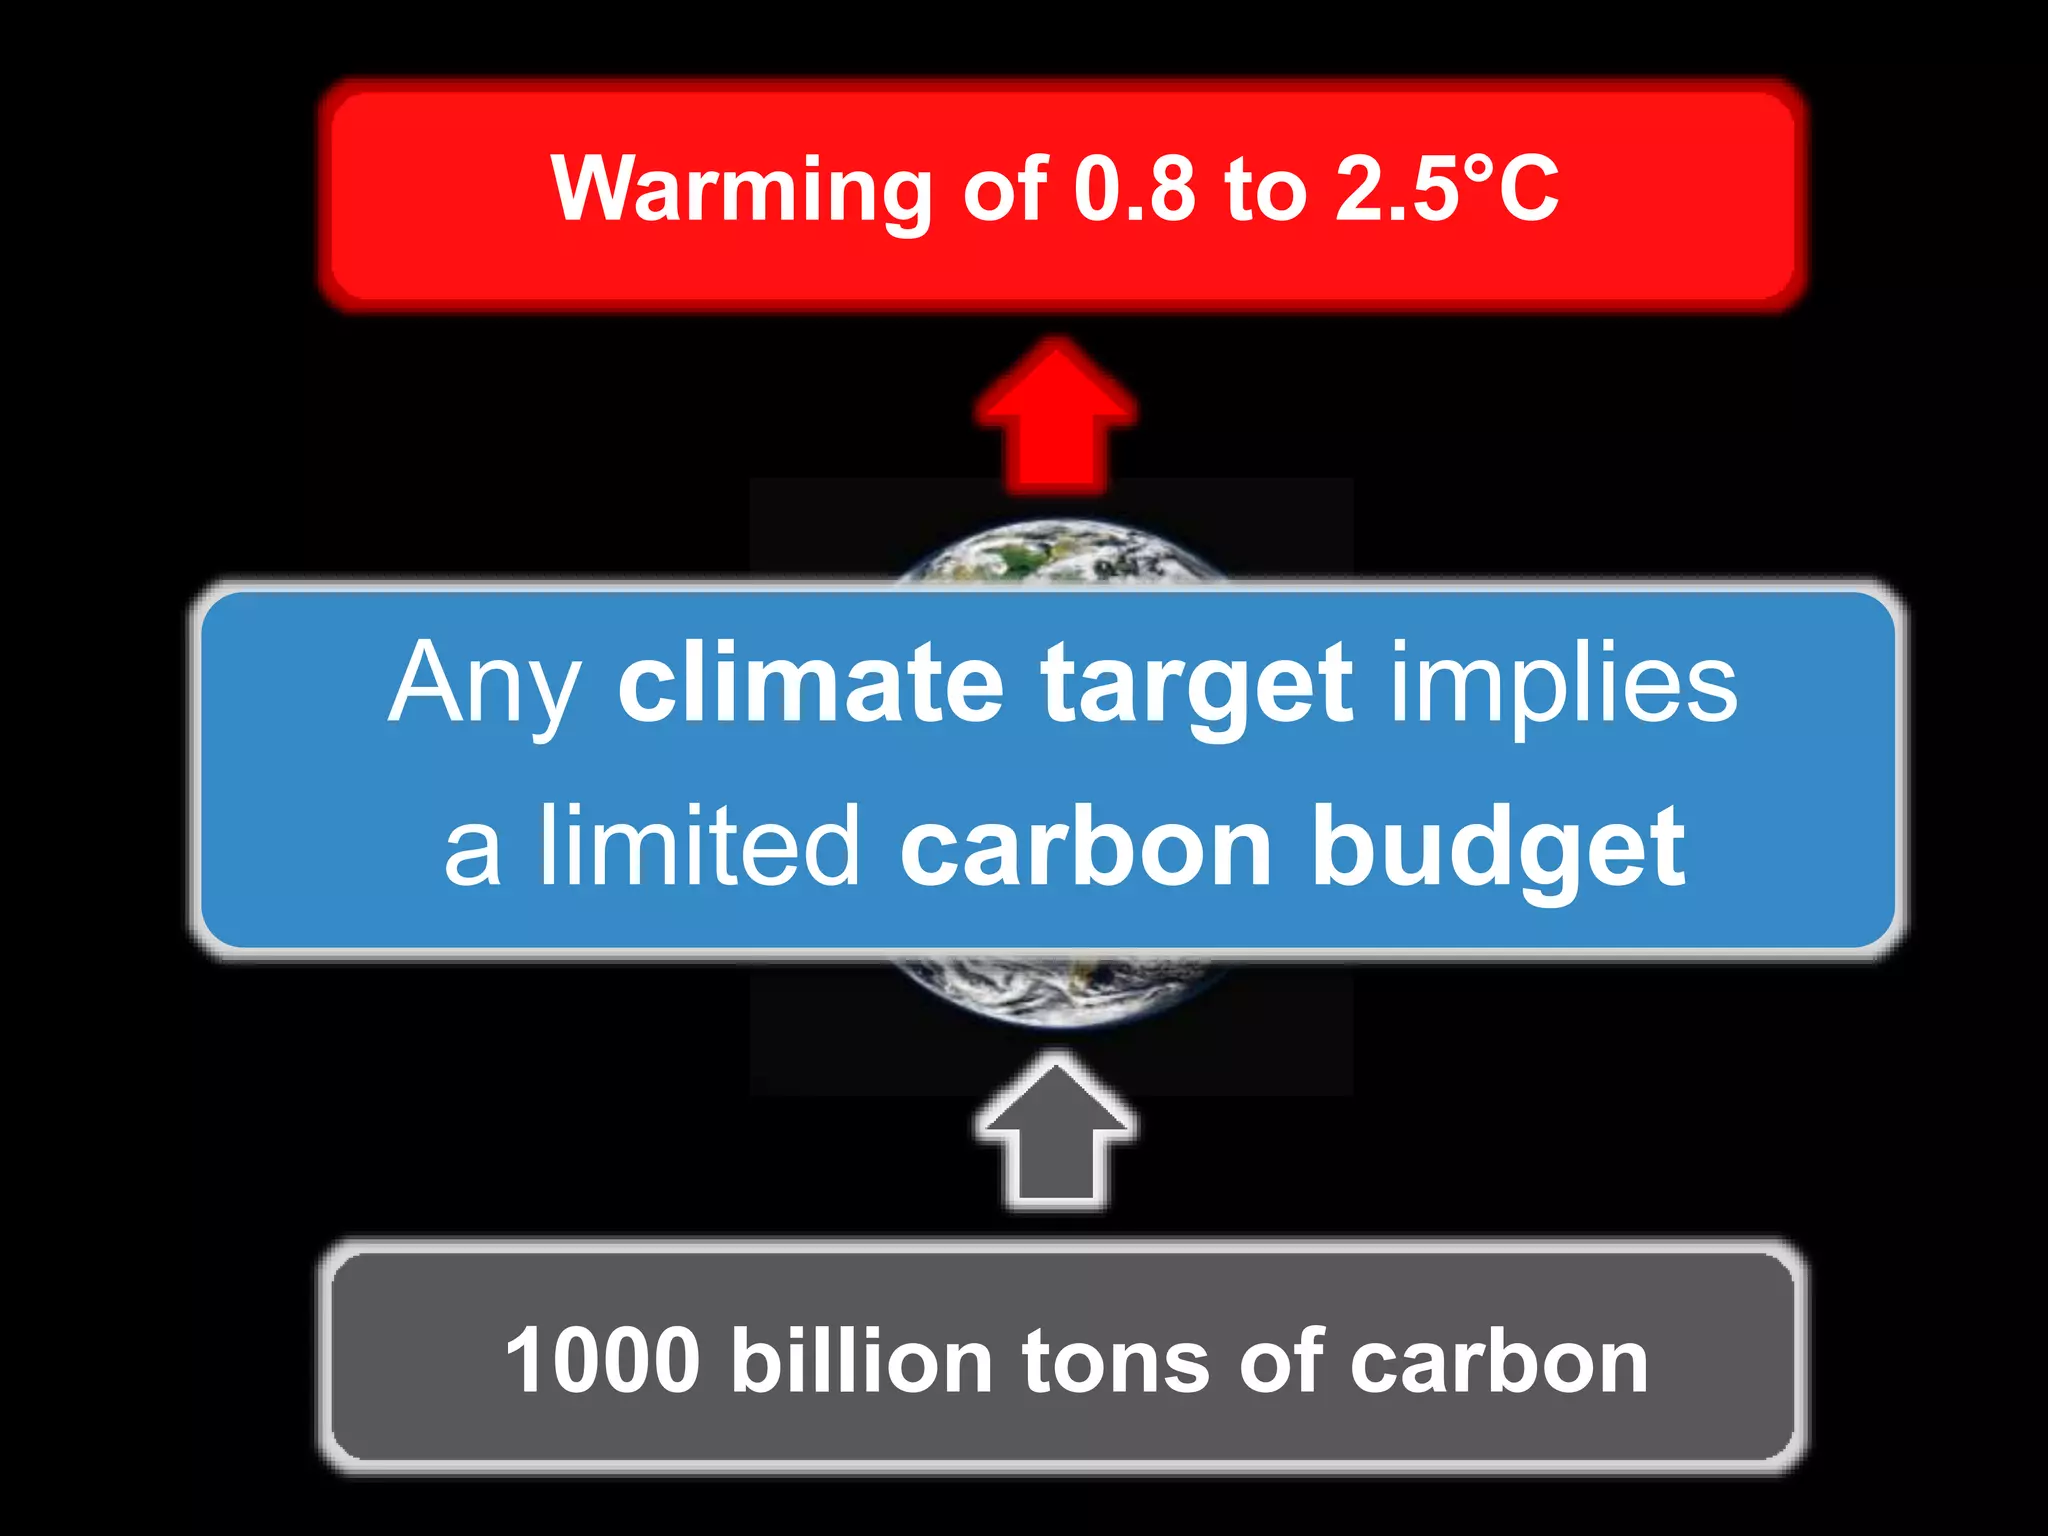
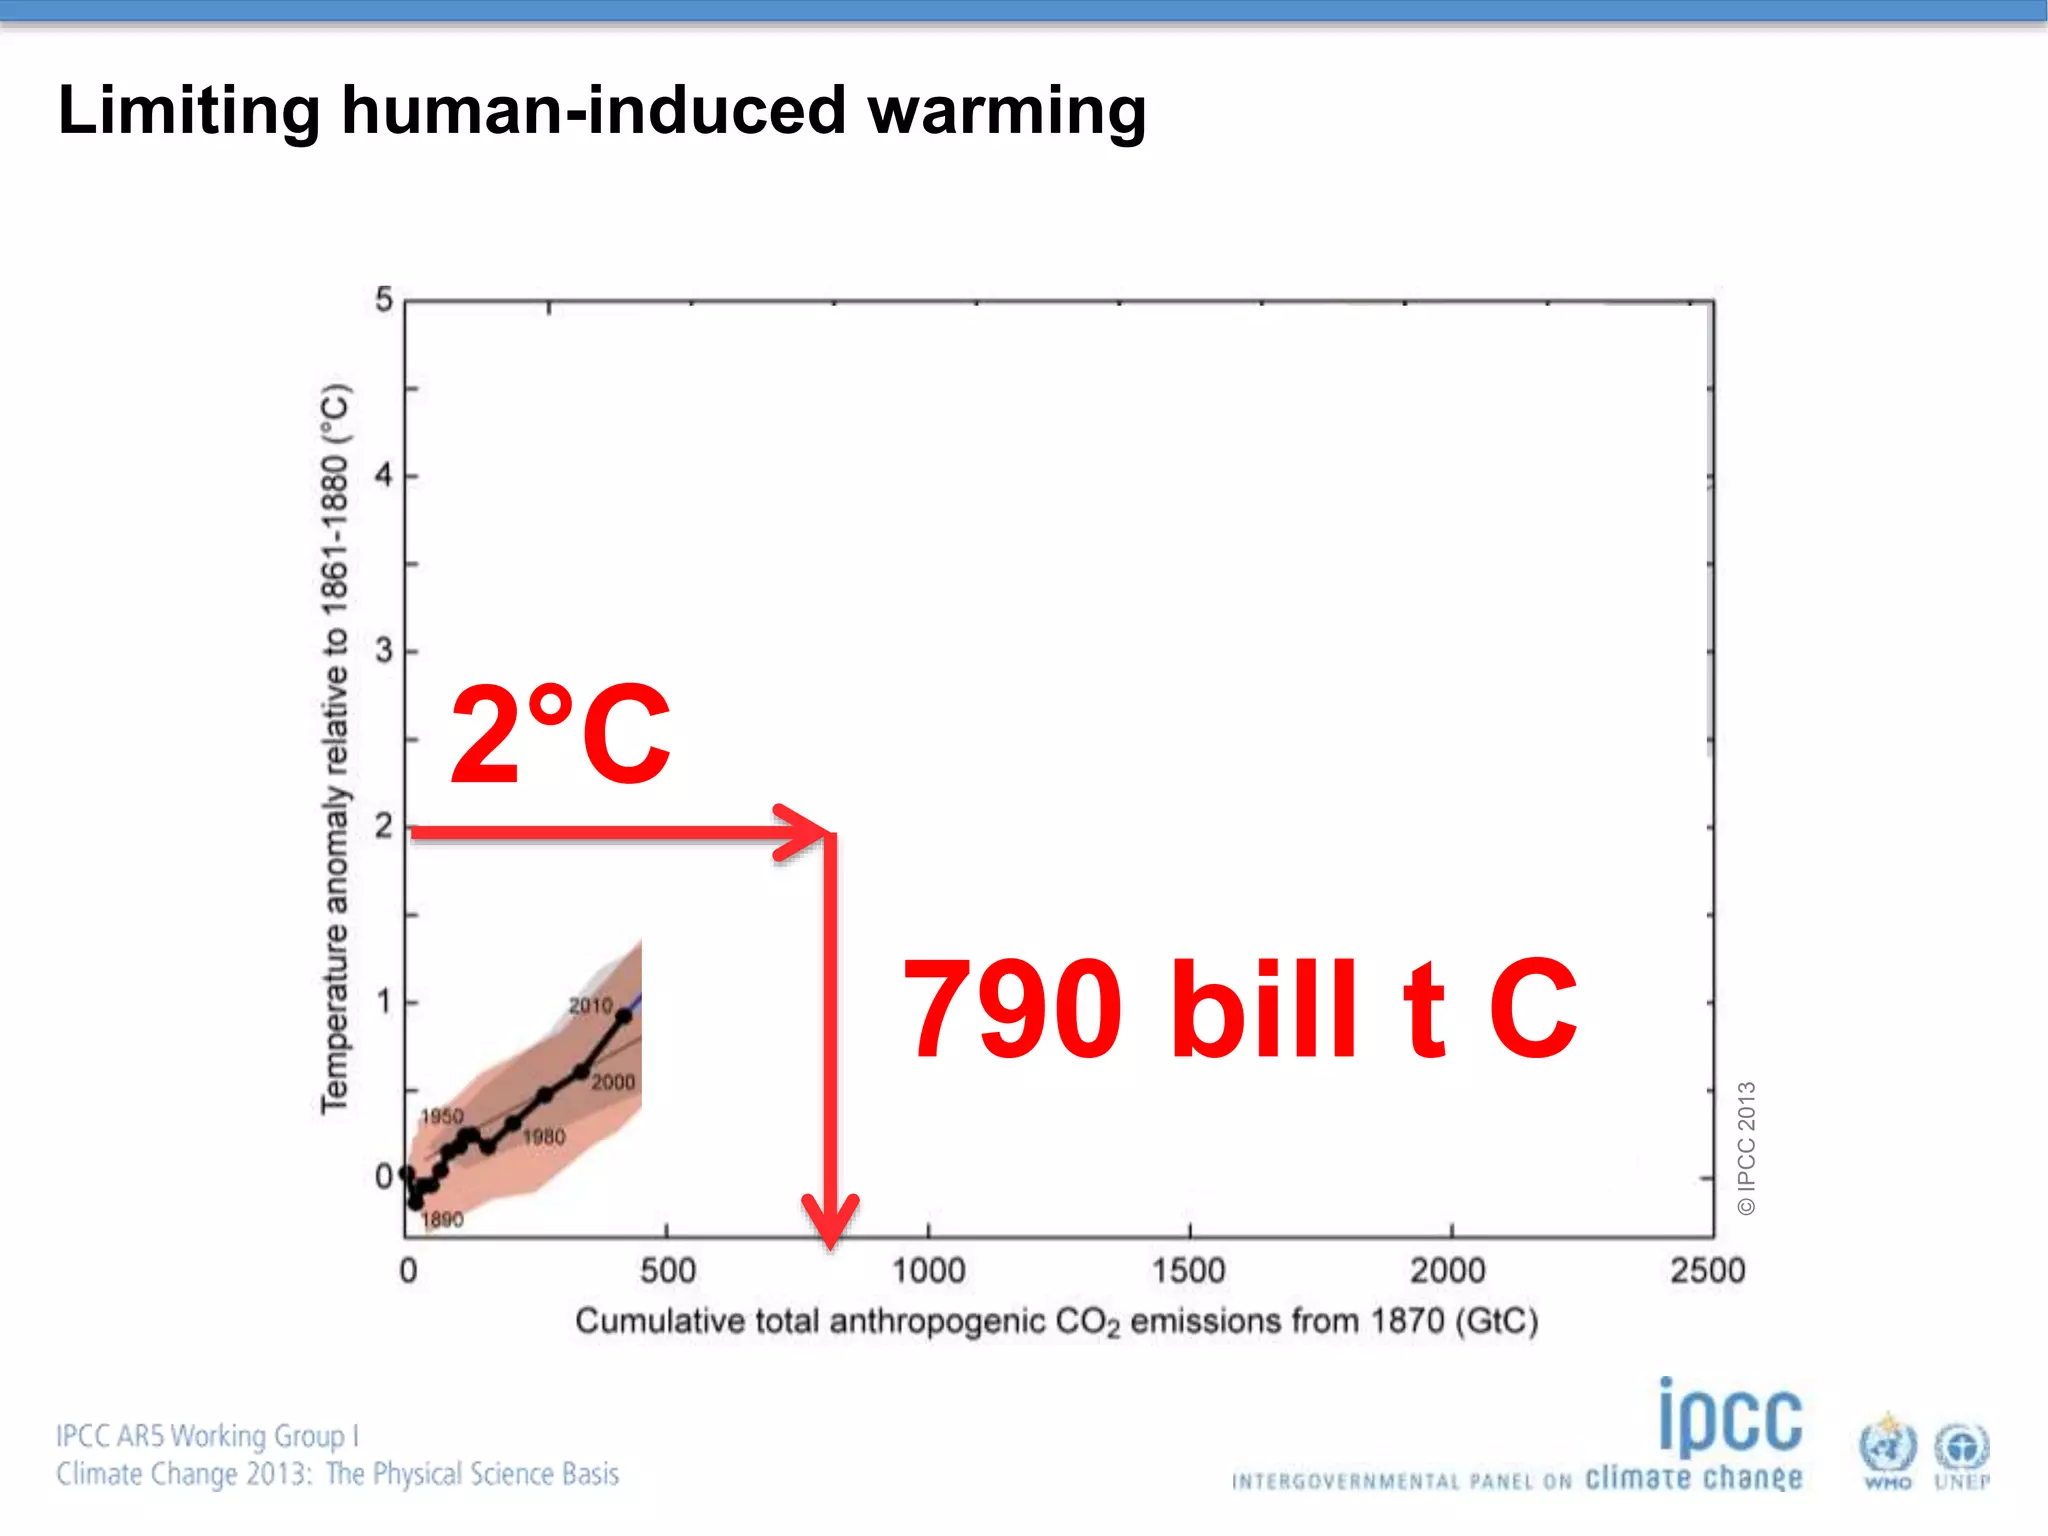
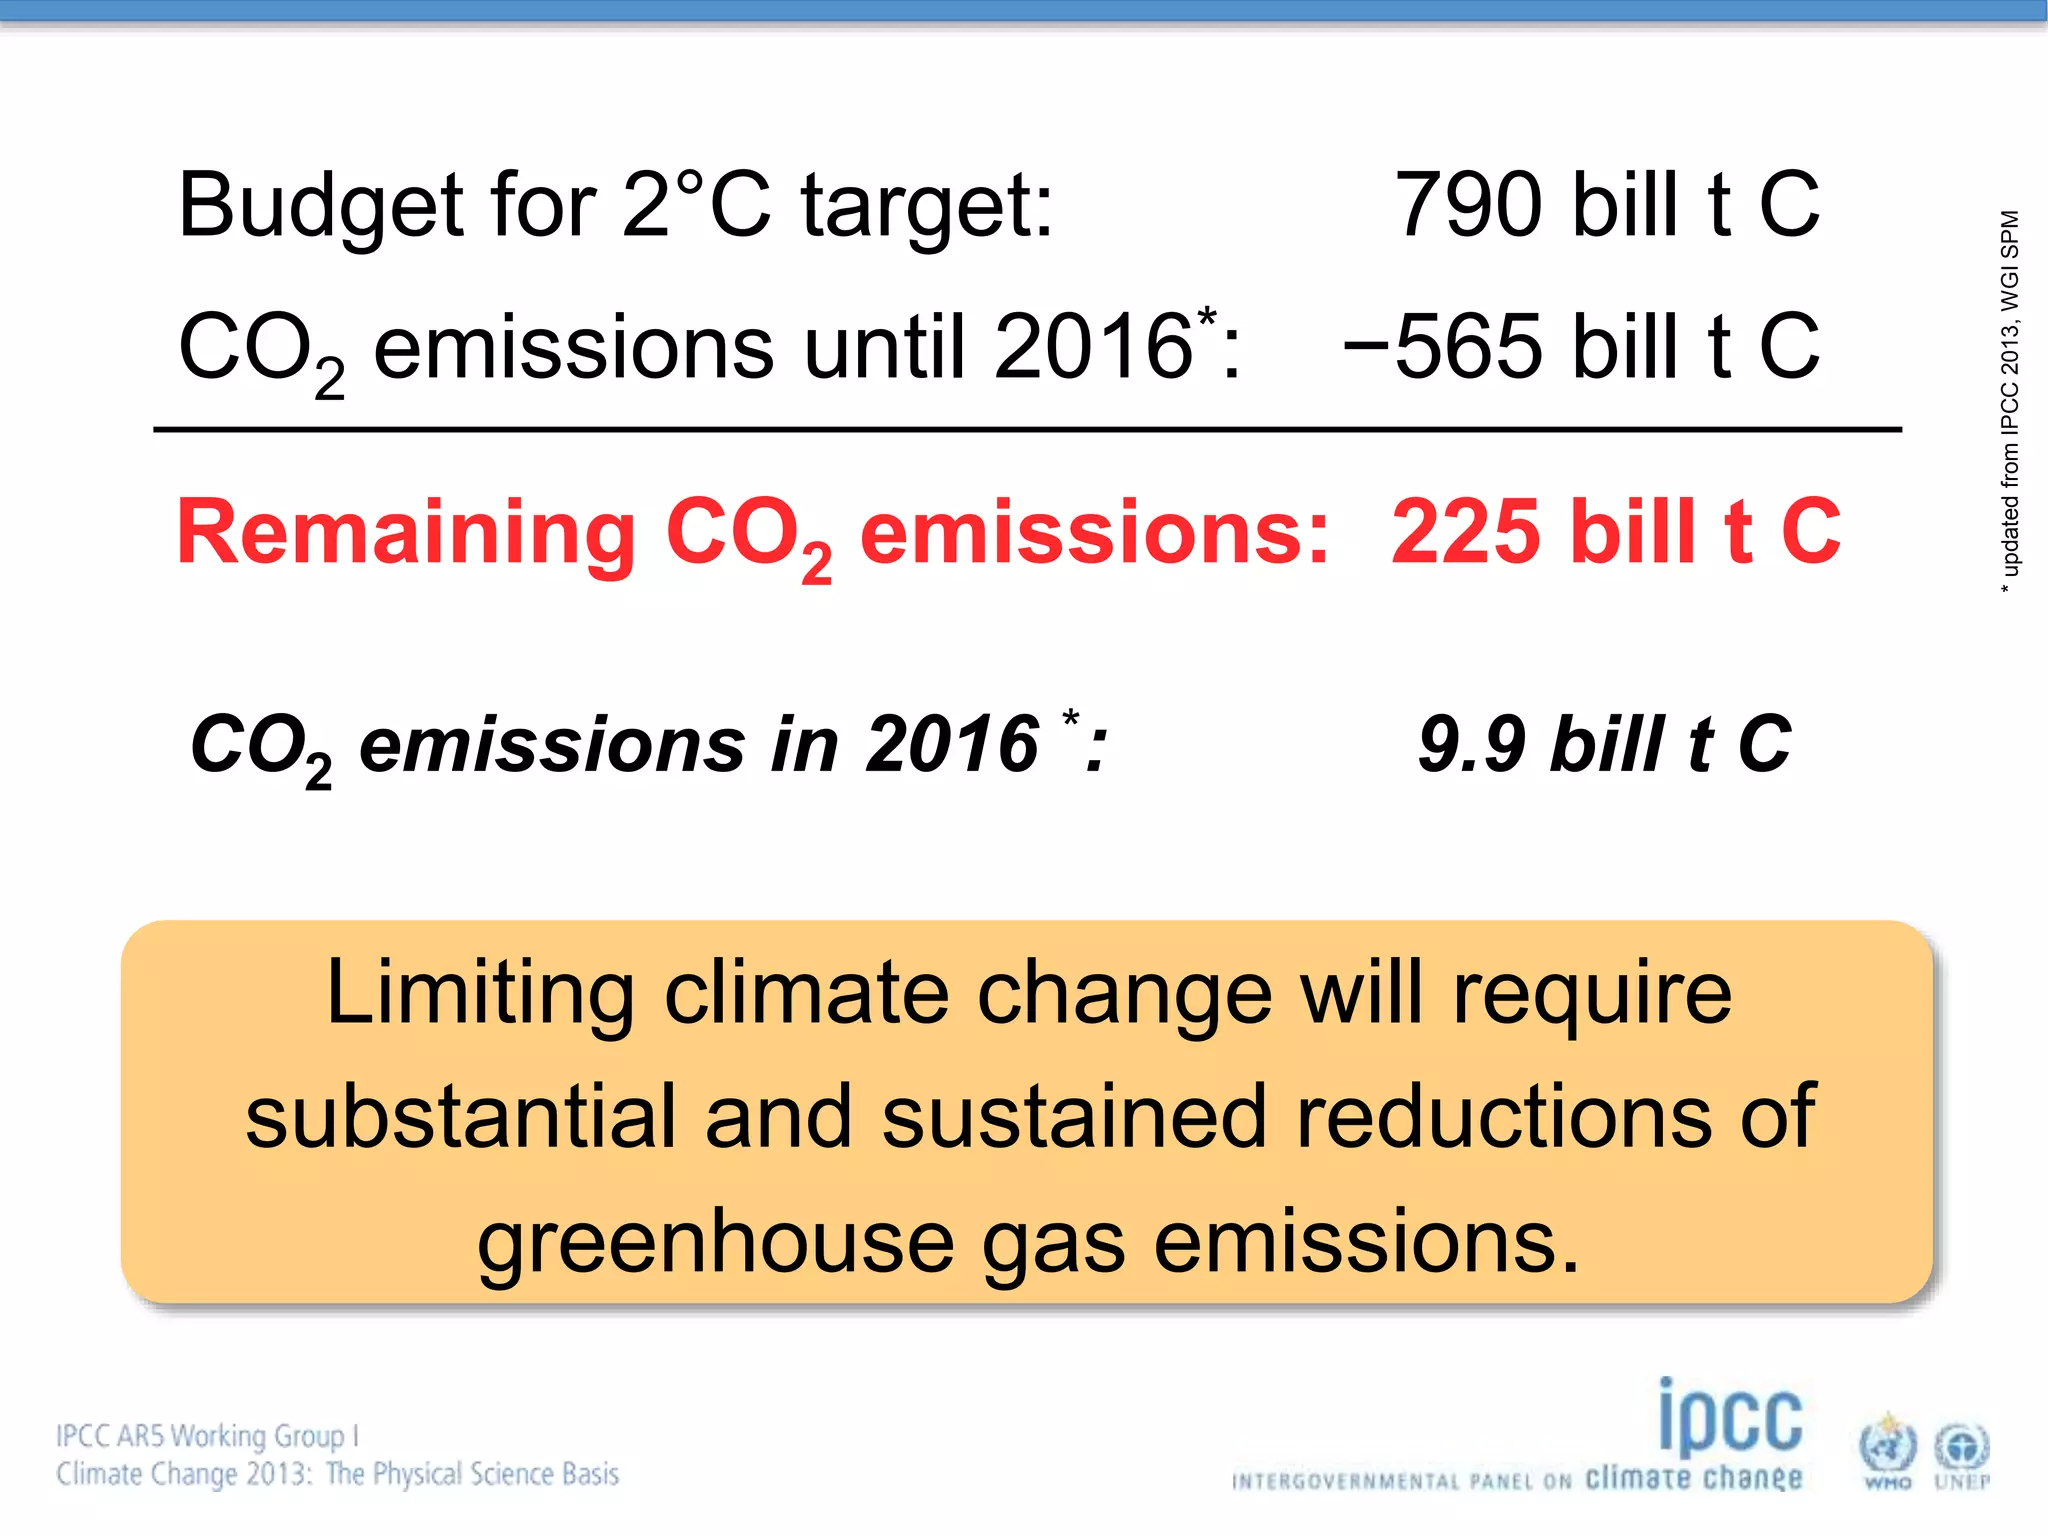
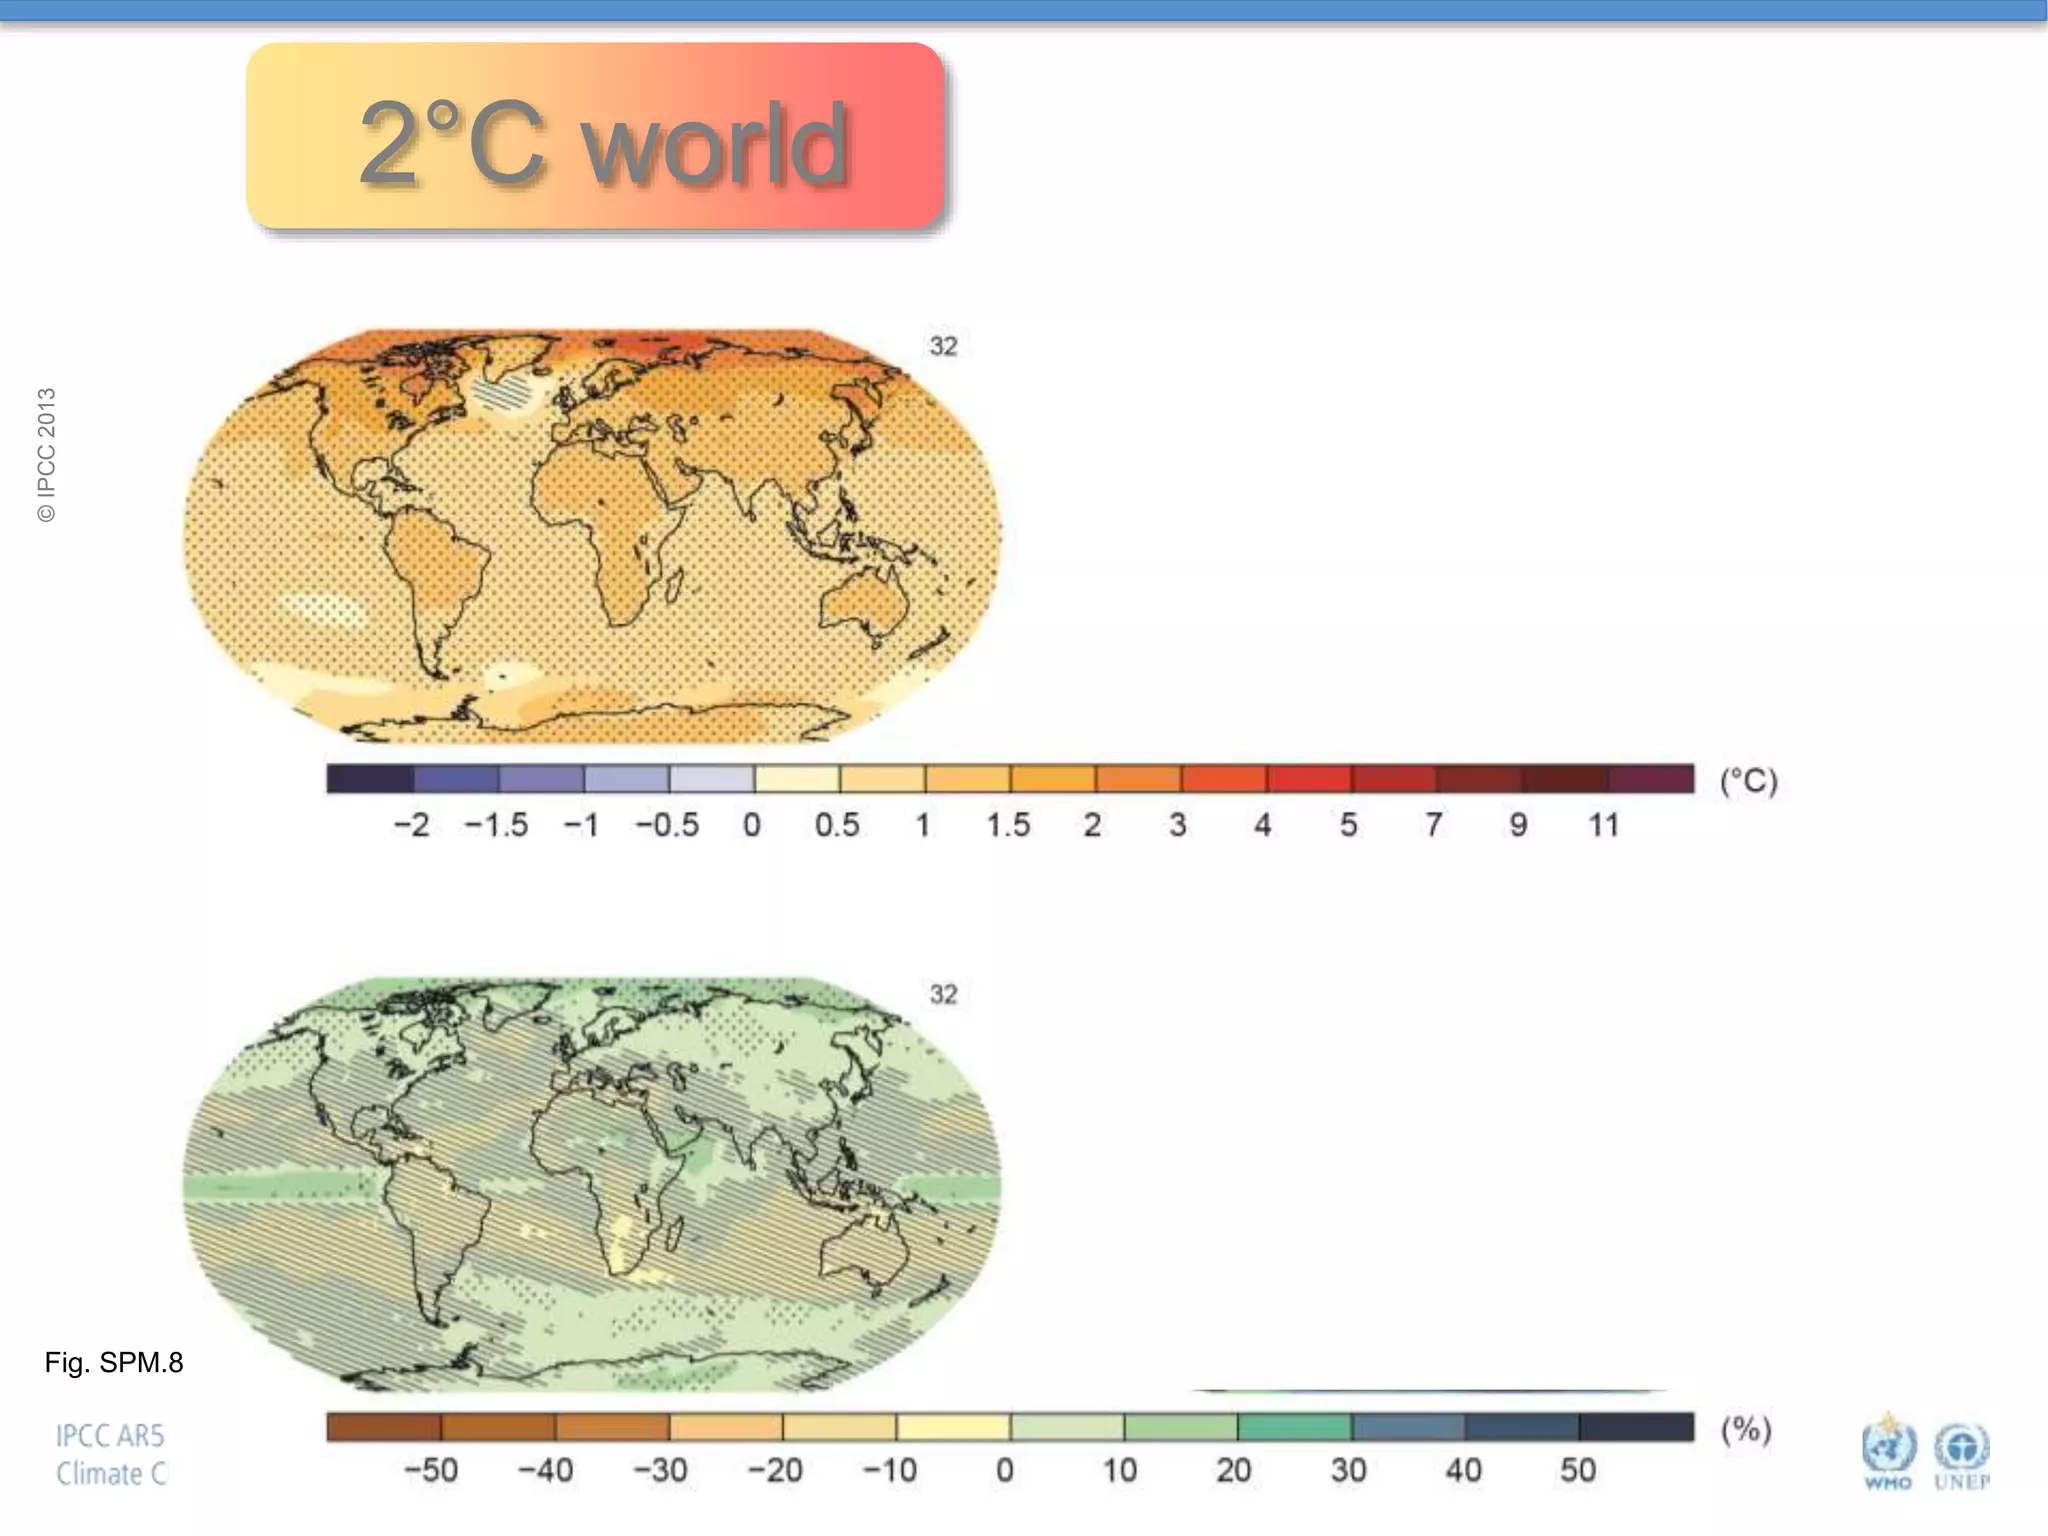
3) Limiting warming to 2°C will require substantial reductions in greenhouse emissions, as the remaining carbon budget for a 2°C target is shrinking due to ongoing emissions.
![Warming in the climate system
is unequivocal, […]
Human influence on the
climate system is clear.
Limiting climate change will require
substantial and sustained reductions of
greenhouse gas emissions.](https://image.slidesharecdn.com/plattner17ar6scopingaddis-170430123257/75/Key-message-on-climate-change-the-physical-science-basis-3-2048.jpg)
![Fig.SPM.1b
Temperature Difference 1901 to 2012 based on trend (°C)
Fig.SPM.2
Precipitation Trend (mm/yr per decade)
© IPCC 2013© IPCC 2013
Warming of the climate system
is unequivocal, […]](https://image.slidesharecdn.com/plattner17ar6scopingaddis-170430123257/75/Key-message-on-climate-change-the-physical-science-basis-5-2048.jpg)