Downloaded 11 times
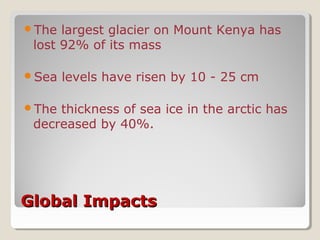
![EffectEffect on apple cultivationon apple cultivation
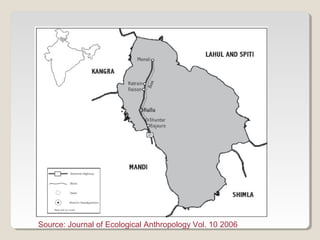
Kullu Valley, Himachal Pradesh
Experienced a number of crop failures in the
last 15 years
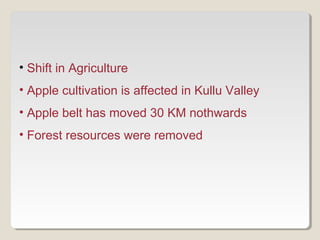
Apple belt has moved 30 kilometers
[northwards] over the last 50 years
Apple growers, says attributed poor
production to reduced snowfall and its
changed timing.
Case study:1 Impact on Agriculture](https://image.slidesharecdn.com/climatechangeissues-130513053308-phpapp01/85/Climate-change-issues-11-320.jpg)
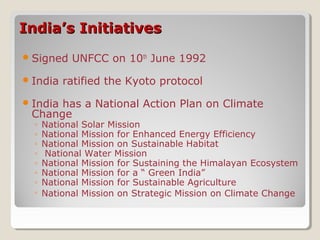


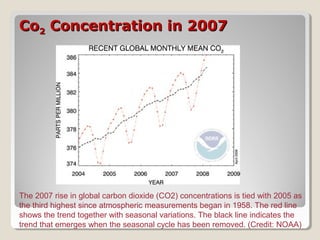
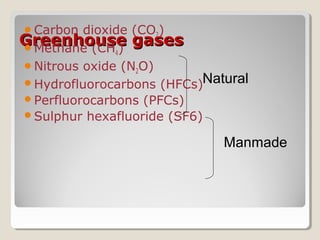
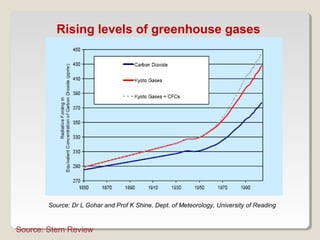
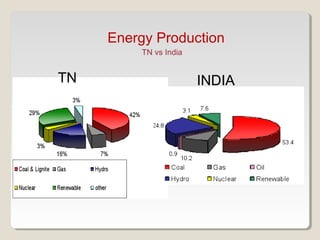
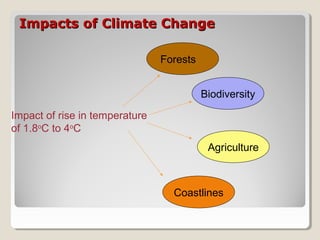
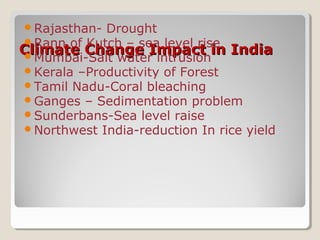
This document discusses climate change issues in India. It provides background on global warming trends and greenhouse gas emissions. It then examines the impacts of climate change through case studies on agriculture in Kullu Valley and threats to the Ganges river. Coastal villages in Orissa have been affected by cyclones and sea level rise. The document also outlines India's climate initiatives and policies around renewable energy and energy efficiency. Per capita carbon dioxide emissions are highest in the US and Europe compared to global averages.


![Climate_Change_&_Its_Impact_PPT[2][2][1][2].pptx](https://cdn.slidesharecdn.com/ss_thumbnails/climatechangeitsimpactppt2212-251010054513-21112abb-thumbnail.jpg?width=640&height=640&fit=bounds)


![Climate change impact on se aagric-070511 [compatibility mode]-3](https://cdn.slidesharecdn.com/ss_thumbnails/climatechange-impactonseaagric-070511compatibilitymode3-130614145407-phpapp01-thumbnail.jpg?width=640&height=640&fit=bounds)


