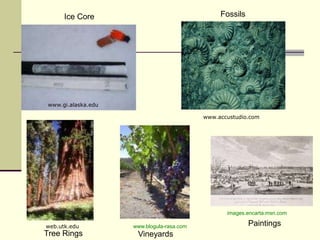
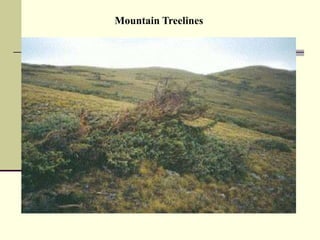
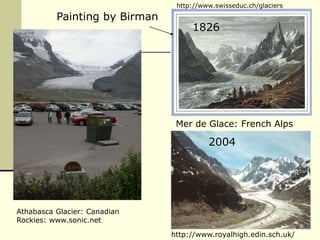
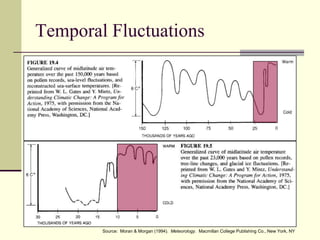
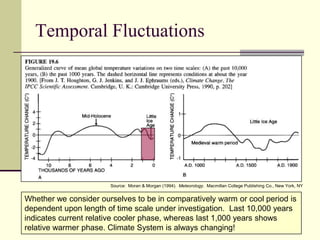
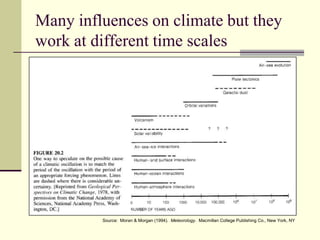
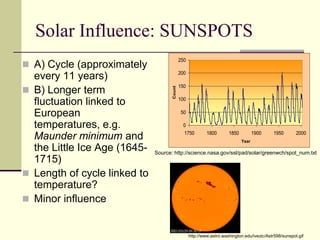
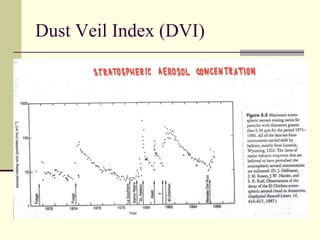
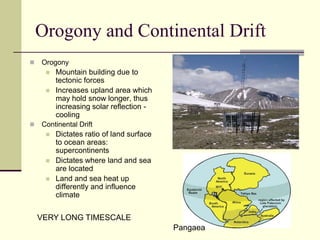
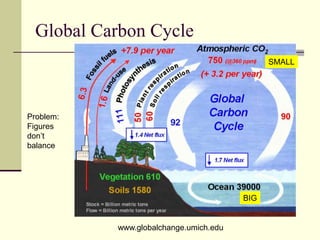
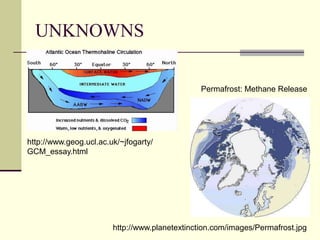
Climate ChangeHype or Reality?http://www.dimplex-resource.co.uk/gifs/energy_the_issues/eti_climateChange.jpg
Global System
Conceptual Global Climate SystemConsider alterations of processes within the systemSpaceEarthAtmosphereConsider energy and mass transfers across system boundaries and processes or events that may alter their magnitude
How do we know that climate is changing?What is the best evidence??
Individual Events CAN NOT be used		As evidence of a trend!!!www.nationwidepaging.co.uk/ boscastle_flooding.jpgwww.kreybaby.comhttp://jrscience.wcp.muohio.edu/photos/hurricane-luis-dmsp.gifwww.stormchasing.com
FossilsIce Corewww.gi.alaska.eduwww.accustudio.comimages.encarta.msn.comPaintingsweb.utk.eduwww.blogula-rasa.comTree RingsVineyards
Mountain Treelines
http://www.swisseduc.ch/glaciersPainting by Birman1826Mer de Glace: French Alps2004Athabasca Glacier: Canadian Rockies: www.sonic.nethttp://www.royalhigh.edin.sch.uk/
Famous GraphGlobal records indicate 12 warmest years in the record have occurred since 1990 (record length 1881-2005)2005, 1998, 2003, 2002, 2004, 2001, 1999, 1995, 1990, 1997, 1991, 2000Newer version in IPCC 2007 reporthttp://cdiac.esd.ornl.gov/trends/temp/lugina/lugina.html
IPCC (Intergovernmental Panel on Climate Change) Verdict“Warming of the climate system is unequivocal, as is now evident from observations of increases in global average air and ocean temperatures, widespread melting of snow and ice, and rising global average sea-level”IPCC (2007) Summary for Policymakers, p5.Notice past changes identified are gradual, not catastrophic storms/hazards etc
Past Temporal Fluctuations
Temporal FluctuationsSource:  Moran & Morgan (1994).  Meteorology.  Macmillan College Publishing Co., New York, NY
Temporal FluctuationsSource:  Moran & Morgan (1994).  Meteorology.  Macmillan College Publishing Co., New York, NYWhether we consider ourselves to be in comparatively warm or cool period is dependent upon length of time scale under investigation.  Last 10,000 years indicates current relative cooler phase, whereas last 1,000 years shows relative warmer phase. Climate System is always changing!
The  Enhanced “Greenhouse Effect”Heat increased due to elimination of advection, i.e. no heat is transported away from the surfaceHeat increased by re-emission of energy by radiatively active gases
Historic Carbon Dioxide LevelsAccepted idea that CO2 levels trigger climate change, positive relationship with temperaturehttp://upload.wikimedia.org/wikipedia/en/c/c7/CO2-Mauna-Loa.png
Carbon Dioxide Levels vs Temperature?Majority View: Sponge Effect?Wavelength selective absorption
Many influences on climate but they work at different time scalesSource:  Moran & Morgan (1994).  Meteorology.  Macmillan College Publishing Co., New York, NY
EXTERNAL FACTORSNatural external forcing agentsGlobal solar energySunspot cyclesIntergalactic dustImpacts on global solar distributionMilankovitch theory
Solar Influence: SUNSPOTSA) Cycle (approximately every 11 years)B) Longer term fluctuation linked to European temperatures, e.g. Maunder minimum and the Little Ice Age (1645-1715)Length of cycle linked to temperature?Minor influenceSource: http://science.nasa.gov/ssl/pad/solar/greenwch/spot_num.txthttp://www.astro.washington.edu/ivezic/Astr598/sunspot.gif
Climatic Aspects and Sunspot Cycle
Sunspot Cycle Length
Long-time scale
Milankovitch HypothesisObliquity of rotation to orbital planeCurrently 23.4º but varies between 22º and 24.5º over a 41,000 year cycleGreater influence felt towards the polesEccentricity of orbit around the sunVaries from almost circular to more elliptical than present over two cycles, 96,000 and 413,000 yearsCurrent annual variation of global solar energy approximately 5% but maximum variation of 30%Precession of equinoxesDefines the season when closest to the sun over a cycle of approximately 22,000 yearsBUT TOTAL RADIATION REMAINS CONSTANT
Milankovitch CyclesCorresponds well with cycles from proxy dataTheory, in terms of variation of global radiation, insufficient to account for changes in global temperaturesFeedback effects must also contribute to climate changeSource: http://www.doc.mmu.ac.uk/aric/gccsg/2-5-2-4.html
Milankovitch CyclesCombined effect is to redistribute energy inputTotal amount of radiation received by Earth in a year stays the same: so global effect?Snow and ice amplify effectsIn hemisphere with lower summer solar input and higher winter solar input – snow does not melt and ice sheets develop – initiates an ICE AGE.Dominance of N. Hemisphere
NATURAL INTERNAL FACTORSNatural Internal Forcing AgentsSolar Radiation forcingVolcanoesEarth evolutionOrogony (Mountain building)Continental DriftIncreasing time scale
VolcanicEruptions                    Only lasts a couple of yearshttp://cas.hamptonu.edu/centerinfo/photo-album/ScienceGraphics/images/volcano.jpg
Dust Veil Index (DVI)
Orogony and Continental DriftOrogonyMountain building due to tectonic forcesIncreases upland area which may hold snow longer, thus increasing solar reflection - coolingContinental DriftDictates ratio of land surface to ocean areas: supercontinentsDictates where land and sea are locatedLand and sea heat up differently and influence climateVERY LONG TIMESCALEPangaea
Continental DriftHigh Latitudes and Altitudes : Snow and Icemeans high albedo and cooling Low Latitudes: Vegetation or Desert (depends on precipitation) – former means cooling through the CO2 effect, later means warming.
HUMAN INTERNAL FACTORSAnthropogenic Internal Forcing AgentsHuman-based activity and land-use change such as urbanisationGrowth in existing natural background levels of greenhouse gases
Humans: Land Use ChangeDeforestationUrbanisationBUT: is this just local?http://www.bbc.co.uk/schools/gcsebitesize/geography/images/santiago.jpg
Major Greenhouse GasesSource: http://www.grida.no/climate/ipcc_tar
Major Greenhouse GasesClassified by activity type
Humans: Greenhouse GasesCurrent CO2 concentration: 380 ppmv – Parts per million volumeBetween 1970 and 2004, emissions have increased by 70%77% of total emissions is CO2But also note methane (CH4)and nitrous oxide (N2O)Forecast concentration, by 2100:500 – 1000 ppmv (wide range indicates economic uncertainty
GWP (Global Warming Potential)Note that methane is 63 times more powerful in the short term but has a relatively shorter atmospheric lifespan, hence only 9 times more powerful over 500 years
				Composite ModelCombination of known factors appear to explain major changes in global climateSome doubt cast upon validity – see Idso, K.E. (2001)  Predicting the past: Its not that difficult at http://www.co2science.org/edit/v4_edit/v4n4edit.htmSource: Gilliland, R.L.  1982.  Solar, volcanic, and CO2 forcing of recent climate changes.  Climatic Change4: 111-131.
The Future?Predictions based on modellingEnergy Balance ModelsGlobal Climate ModelsScenarios of CO2 consumption used: modelling of economics as well as atmosphereAIFI scenario leads to doubling of CO2 by 2050, and 1550 ppm by 2100.Alternative lesser increases used to indicate global action: B1 (600 ppm by 2100), AIT, B2, AIB, A2
Carbon Dioxide vs Temperature?NON-LINEARFatalistic ViewpointThresholds
Global Carbon CycleSMALLProblem:Figures don’t balanceBIGwww.globalchange.umich.edu
More cloudLess cloud?-veLess surface heatingLess convectionSurface heatingReduced albedo+veMeltingLess icePossible Feedback LoopsCloudsIce/Snow
UNKNOWNSPermafrost: Methane Releasehttp://www.geog.ucl.ac.uk/~jfogarty/GCM_essay.htmlhttp://www.planetextinction.com/images/Permafrost.jpg
Problems with GCM’sClouds not incorporated wellSerious deficiencies in treatmentChanges in snow/ice cover badly modelledAlbedo of snow highly significanCoupling of ocean and atmosphereThermal inertia of ocean systemsPolewards transport of energyMore confidence with temperature predictions than rainfall predictions: smooth vs spotty distributionFeedbacks can lead to instability in the model
Future PredictionsIntergovernmental Panel on Climate Change(IPCC)Predictions updated 1990, 1996 and 2001, 2007GlobalCurrent rates of warming around 0.1-0.2 deg C/decadeCurrent mean estimate of 1.8ºC<>4.0ºC by 2100 (depends on scenario)Constant 2000 concentrations: 0.6°C by 2100 (lag)Regional (see map)
Two main climate model typesOne way to avoid economic uncertainty is to predict for 2 *CO2, NOT a dateTransient (time series) – takes time to adjustEquilibrium: 1 * C02  vs 2 * CO2Model allowed to come into equilibriumTake the difference between the two predictions, i.e. + 2 deg C
Future Global change2 times CO2Most warming: Land, N hemisphere: Least certain: mid-latitudesGreen lines represent areas of uncertainty
Regional Detail: Europe: Hadley Centre GCMAnnual PrecipNote relativelypoor grid resolutionAnnual TempWinter PrecipSummer Precip
PREDICTING EFFECTS is not just temperature and precipitation?Most of the warming is focused in currently cold areas(snow and ice feedback) Logically this should reduce temporal and spatial variability of Earth’s climate at the surfaceThis may influence extreme events?
ThunderExtreme Events: StorminessWavesWindIce and SnowRain
Storm Tracks and GW
North Atlantic Cyclones: Western EuropeFITimeseries of the number of storm events recorded at 24 hour intervals.  Timeseries of average intensity (mean pressure gradients)SymFSevereTimeseries of the number of severe lows (max gradient greater than or equal to 45m/250km)Timeseries of mean symmetry indexSource: Amanda Gibson (2006): Unpublished phD Thesis
Hurricanes: Uncertain Increase over N AtlanticFrom 1995 to present, butThere were similar high frequencies in the 1950s. Maybe a cycle: Maybe not?Statistics are inconclusive
Tornadoes:Uncertain DataChanges in reportingand better detectionmakes the data inhomogenous
MountainsComplicated landscape
Glacial Change in East Africa
Polar RegionsSensitive to change, snow is a natural cooling system, protects the groundas an insulator, frozen lakes can be used for transport, hunting etc.
Mediterranean: Desertification
Portsmouth: coastal flooding: Old Portsmouth 1989, but also both more and less rainfall?
So what can we do?Figure 1. Global average temperature change projected from 16 different climate models for the 21st century if atmospheric CO2 levels are held constant at the year 2000 levels.Figure 1. Global average temperature change projected from 16 different climate models for the 21st century if atmospheric CO2 levels are held constant at the year 2000 levels.http://www.worldclimatereport.com/index.php/2006/04/Sceptic website!
Future scenariosSource: IPCC 2007 Report: Mitigation of Climate Change
Conceptual Global Climate SystemShort-wave and long-wave energy balanceSunspot CyclesOrbital CyclesInterstellar Dust  Radiative ForcingAtmospheric ChemistryVolcanic DustGas EmissionsSolar EnergyTerrestrial EnergySolar EnergySurface ConditionsThermodynamic ForcingGlobal Circulation Systems
SUMMARY POINTSClimate change at many time scales: past changes have been caused by many mechanisms superimposed upon one anotherChanges in mean temperature and or precipitation may be seen in the past reconstructions and modelled in the GCMs, but this is not the whole description of climateExtreme events are a real problem! to predict and understand! They are also not good to use as evidence of past or current climate change, and there is much uncertainty here.Many unknowns concerning degree and extent of response – we are interfering with a complex system Surely we should limit our interference as much as possible even though there are scientific and economic uncertainties?
Internet Resourceshttp://www.climnet.org/   A useful site belonging to Climate Action Network Europe, great linkshttp://www.ipcc.ch/  The Intergovernmental Panel on Climate Change: Read the 2007 Scientific Basis reporthttp://www.meto.gov.uk/research/hadleycentre/models/modeldata.html Met OfficeWeb site gives some model data and predictions for the futurehttp://www.realclimate.org/ Climate science from climate scientistshttp://www.co2science.org/scripts/CO2ScienceB2C/Index.jsp Alternative viewpointhttp://www.portsmouthcan.co.uk/ Local action network for climate change mitigation
CHAOSCHAOSCHAOSCHAOSCHAOSCHAOSCHAOSCHAOSCHAOS

Climate change - environmental systems and change.

  • 1.
    Climate ChangeHype orReality?http://www.dimplex-resource.co.uk/gifs/energy_the_issues/eti_climateChange.jpg
  • 2.
  • 3.
    Conceptual Global ClimateSystemConsider alterations of processes within the systemSpaceEarthAtmosphereConsider energy and mass transfers across system boundaries and processes or events that may alter their magnitude
  • 4.
    How do weknow that climate is changing?What is the best evidence??
  • 5.
    Individual Events CANNOT be used As evidence of a trend!!!www.nationwidepaging.co.uk/ boscastle_flooding.jpgwww.kreybaby.comhttp://jrscience.wcp.muohio.edu/photos/hurricane-luis-dmsp.gifwww.stormchasing.com
  • 6.
  • 7.
  • 8.
    http://www.swisseduc.ch/glaciersPainting by Birman1826Merde Glace: French Alps2004Athabasca Glacier: Canadian Rockies: www.sonic.nethttp://www.royalhigh.edin.sch.uk/
  • 9.
    Famous GraphGlobal recordsindicate 12 warmest years in the record have occurred since 1990 (record length 1881-2005)2005, 1998, 2003, 2002, 2004, 2001, 1999, 1995, 1990, 1997, 1991, 2000Newer version in IPCC 2007 reporthttp://cdiac.esd.ornl.gov/trends/temp/lugina/lugina.html
  • 11.
    IPCC (Intergovernmental Panelon Climate Change) Verdict“Warming of the climate system is unequivocal, as is now evident from observations of increases in global average air and ocean temperatures, widespread melting of snow and ice, and rising global average sea-level”IPCC (2007) Summary for Policymakers, p5.Notice past changes identified are gradual, not catastrophic storms/hazards etc
  • 12.
  • 13.
    Temporal FluctuationsSource: Moran & Morgan (1994). Meteorology. Macmillan College Publishing Co., New York, NY
  • 14.
    Temporal FluctuationsSource: Moran & Morgan (1994). Meteorology. Macmillan College Publishing Co., New York, NYWhether we consider ourselves to be in comparatively warm or cool period is dependent upon length of time scale under investigation. Last 10,000 years indicates current relative cooler phase, whereas last 1,000 years shows relative warmer phase. Climate System is always changing!
  • 15.
    The Enhanced“Greenhouse Effect”Heat increased due to elimination of advection, i.e. no heat is transported away from the surfaceHeat increased by re-emission of energy by radiatively active gases
  • 16.
    Historic Carbon DioxideLevelsAccepted idea that CO2 levels trigger climate change, positive relationship with temperaturehttp://upload.wikimedia.org/wikipedia/en/c/c7/CO2-Mauna-Loa.png
  • 17.
    Carbon Dioxide Levelsvs Temperature?Majority View: Sponge Effect?Wavelength selective absorption
  • 18.
    Many influences onclimate but they work at different time scalesSource: Moran & Morgan (1994). Meteorology. Macmillan College Publishing Co., New York, NY
  • 19.
    EXTERNAL FACTORSNatural externalforcing agentsGlobal solar energySunspot cyclesIntergalactic dustImpacts on global solar distributionMilankovitch theory
  • 20.
    Solar Influence: SUNSPOTSA)Cycle (approximately every 11 years)B) Longer term fluctuation linked to European temperatures, e.g. Maunder minimum and the Little Ice Age (1645-1715)Length of cycle linked to temperature?Minor influenceSource: http://science.nasa.gov/ssl/pad/solar/greenwch/spot_num.txthttp://www.astro.washington.edu/ivezic/Astr598/sunspot.gif
  • 21.
  • 22.
  • 23.
  • 24.
    Milankovitch HypothesisObliquity ofrotation to orbital planeCurrently 23.4º but varies between 22º and 24.5º over a 41,000 year cycleGreater influence felt towards the polesEccentricity of orbit around the sunVaries from almost circular to more elliptical than present over two cycles, 96,000 and 413,000 yearsCurrent annual variation of global solar energy approximately 5% but maximum variation of 30%Precession of equinoxesDefines the season when closest to the sun over a cycle of approximately 22,000 yearsBUT TOTAL RADIATION REMAINS CONSTANT
  • 25.
    Milankovitch CyclesCorresponds wellwith cycles from proxy dataTheory, in terms of variation of global radiation, insufficient to account for changes in global temperaturesFeedback effects must also contribute to climate changeSource: http://www.doc.mmu.ac.uk/aric/gccsg/2-5-2-4.html
  • 26.
    Milankovitch CyclesCombined effectis to redistribute energy inputTotal amount of radiation received by Earth in a year stays the same: so global effect?Snow and ice amplify effectsIn hemisphere with lower summer solar input and higher winter solar input – snow does not melt and ice sheets develop – initiates an ICE AGE.Dominance of N. Hemisphere
  • 27.
    NATURAL INTERNAL FACTORSNaturalInternal Forcing AgentsSolar Radiation forcingVolcanoesEarth evolutionOrogony (Mountain building)Continental DriftIncreasing time scale
  • 28.
    VolcanicEruptions Only lasts a couple of yearshttp://cas.hamptonu.edu/centerinfo/photo-album/ScienceGraphics/images/volcano.jpg
  • 29.
  • 30.
    Orogony and ContinentalDriftOrogonyMountain building due to tectonic forcesIncreases upland area which may hold snow longer, thus increasing solar reflection - coolingContinental DriftDictates ratio of land surface to ocean areas: supercontinentsDictates where land and sea are locatedLand and sea heat up differently and influence climateVERY LONG TIMESCALEPangaea
  • 31.
    Continental DriftHigh Latitudesand Altitudes : Snow and Icemeans high albedo and cooling Low Latitudes: Vegetation or Desert (depends on precipitation) – former means cooling through the CO2 effect, later means warming.
  • 32.
    HUMAN INTERNAL FACTORSAnthropogenicInternal Forcing AgentsHuman-based activity and land-use change such as urbanisationGrowth in existing natural background levels of greenhouse gases
  • 33.
    Humans: Land UseChangeDeforestationUrbanisationBUT: is this just local?http://www.bbc.co.uk/schools/gcsebitesize/geography/images/santiago.jpg
  • 34.
    Major Greenhouse GasesSource:http://www.grida.no/climate/ipcc_tar
  • 35.
  • 36.
    Humans: Greenhouse GasesCurrentCO2 concentration: 380 ppmv – Parts per million volumeBetween 1970 and 2004, emissions have increased by 70%77% of total emissions is CO2But also note methane (CH4)and nitrous oxide (N2O)Forecast concentration, by 2100:500 – 1000 ppmv (wide range indicates economic uncertainty
  • 37.
    GWP (Global WarmingPotential)Note that methane is 63 times more powerful in the short term but has a relatively shorter atmospheric lifespan, hence only 9 times more powerful over 500 years
  • 38.
    Composite ModelCombination ofknown factors appear to explain major changes in global climateSome doubt cast upon validity – see Idso, K.E. (2001) Predicting the past: Its not that difficult at http://www.co2science.org/edit/v4_edit/v4n4edit.htmSource: Gilliland, R.L.  1982.  Solar, volcanic, and CO2 forcing of recent climate changes.  Climatic Change4: 111-131.
  • 39.
    The Future?Predictions basedon modellingEnergy Balance ModelsGlobal Climate ModelsScenarios of CO2 consumption used: modelling of economics as well as atmosphereAIFI scenario leads to doubling of CO2 by 2050, and 1550 ppm by 2100.Alternative lesser increases used to indicate global action: B1 (600 ppm by 2100), AIT, B2, AIB, A2
  • 40.
    Carbon Dioxide vsTemperature?NON-LINEARFatalistic ViewpointThresholds
  • 41.
    Global Carbon CycleSMALLProblem:Figuresdon’t balanceBIGwww.globalchange.umich.edu
  • 42.
    More cloudLess cloud?-veLesssurface heatingLess convectionSurface heatingReduced albedo+veMeltingLess icePossible Feedback LoopsCloudsIce/Snow
  • 43.
  • 44.
    Problems with GCM’sCloudsnot incorporated wellSerious deficiencies in treatmentChanges in snow/ice cover badly modelledAlbedo of snow highly significanCoupling of ocean and atmosphereThermal inertia of ocean systemsPolewards transport of energyMore confidence with temperature predictions than rainfall predictions: smooth vs spotty distributionFeedbacks can lead to instability in the model
  • 45.
    Future PredictionsIntergovernmental Panelon Climate Change(IPCC)Predictions updated 1990, 1996 and 2001, 2007GlobalCurrent rates of warming around 0.1-0.2 deg C/decadeCurrent mean estimate of 1.8ºC<>4.0ºC by 2100 (depends on scenario)Constant 2000 concentrations: 0.6°C by 2100 (lag)Regional (see map)
  • 46.
    Two main climatemodel typesOne way to avoid economic uncertainty is to predict for 2 *CO2, NOT a dateTransient (time series) – takes time to adjustEquilibrium: 1 * C02 vs 2 * CO2Model allowed to come into equilibriumTake the difference between the two predictions, i.e. + 2 deg C
  • 47.
    Future Global change2times CO2Most warming: Land, N hemisphere: Least certain: mid-latitudesGreen lines represent areas of uncertainty
  • 48.
    Regional Detail: Europe:Hadley Centre GCMAnnual PrecipNote relativelypoor grid resolutionAnnual TempWinter PrecipSummer Precip
  • 49.
    PREDICTING EFFECTS isnot just temperature and precipitation?Most of the warming is focused in currently cold areas(snow and ice feedback) Logically this should reduce temporal and spatial variability of Earth’s climate at the surfaceThis may influence extreme events?
  • 50.
  • 51.
  • 52.
    North Atlantic Cyclones:Western EuropeFITimeseries of the number of storm events recorded at 24 hour intervals. Timeseries of average intensity (mean pressure gradients)SymFSevereTimeseries of the number of severe lows (max gradient greater than or equal to 45m/250km)Timeseries of mean symmetry indexSource: Amanda Gibson (2006): Unpublished phD Thesis
  • 53.
    Hurricanes: Uncertain Increaseover N AtlanticFrom 1995 to present, butThere were similar high frequencies in the 1950s. Maybe a cycle: Maybe not?Statistics are inconclusive
  • 54.
    Tornadoes:Uncertain DataChanges inreportingand better detectionmakes the data inhomogenous
  • 55.
  • 56.
  • 57.
    Polar RegionsSensitive tochange, snow is a natural cooling system, protects the groundas an insulator, frozen lakes can be used for transport, hunting etc.
  • 58.
  • 59.
    Portsmouth: coastal flooding:Old Portsmouth 1989, but also both more and less rainfall?
  • 60.
    So what canwe do?Figure 1. Global average temperature change projected from 16 different climate models for the 21st century if atmospheric CO2 levels are held constant at the year 2000 levels.Figure 1. Global average temperature change projected from 16 different climate models for the 21st century if atmospheric CO2 levels are held constant at the year 2000 levels.http://www.worldclimatereport.com/index.php/2006/04/Sceptic website!
  • 61.
    Future scenariosSource: IPCC2007 Report: Mitigation of Climate Change
  • 62.
    Conceptual Global ClimateSystemShort-wave and long-wave energy balanceSunspot CyclesOrbital CyclesInterstellar Dust Radiative ForcingAtmospheric ChemistryVolcanic DustGas EmissionsSolar EnergyTerrestrial EnergySolar EnergySurface ConditionsThermodynamic ForcingGlobal Circulation Systems
  • 63.
    SUMMARY POINTSClimate changeat many time scales: past changes have been caused by many mechanisms superimposed upon one anotherChanges in mean temperature and or precipitation may be seen in the past reconstructions and modelled in the GCMs, but this is not the whole description of climateExtreme events are a real problem! to predict and understand! They are also not good to use as evidence of past or current climate change, and there is much uncertainty here.Many unknowns concerning degree and extent of response – we are interfering with a complex system Surely we should limit our interference as much as possible even though there are scientific and economic uncertainties?
  • 64.
    Internet Resourceshttp://www.climnet.org/ A useful site belonging to Climate Action Network Europe, great linkshttp://www.ipcc.ch/ The Intergovernmental Panel on Climate Change: Read the 2007 Scientific Basis reporthttp://www.meto.gov.uk/research/hadleycentre/models/modeldata.html Met OfficeWeb site gives some model data and predictions for the futurehttp://www.realclimate.org/ Climate science from climate scientistshttp://www.co2science.org/scripts/CO2ScienceB2C/Index.jsp Alternative viewpointhttp://www.portsmouthcan.co.uk/ Local action network for climate change mitigation
  • 65.