
Download as PDF, PPTX


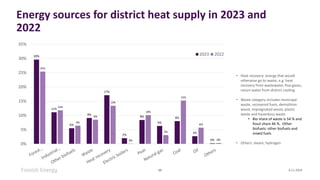


In 2023, Finland's district heating saw a significant shift towards non-combustion-based production, which increased by 40% compared to 2022, driven largely by heat pump and electric boiler usage. Amidst recovering fuel supplies and a geographical variety of energy sources, the overall district heat consumption was 33.2 TWh, reflecting a slight decrease in temperature-corrected heat consumption from the previous year. CO2 emissions from district heat production dropped by 22%, showcasing a move towards more sustainable energy practices.


