Download to read offline


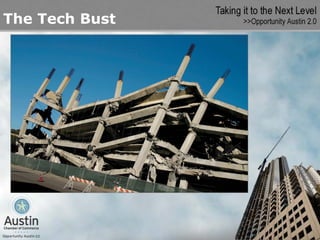
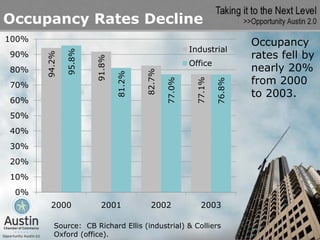
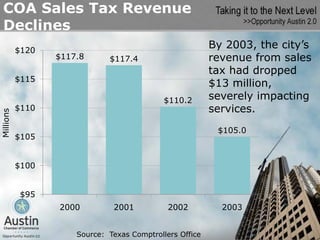
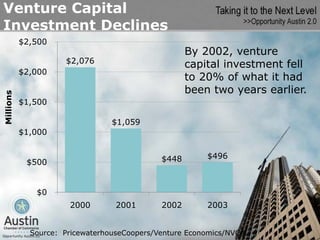
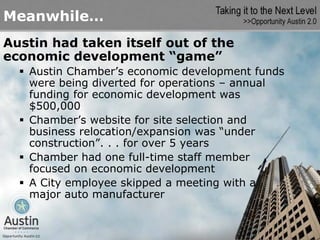


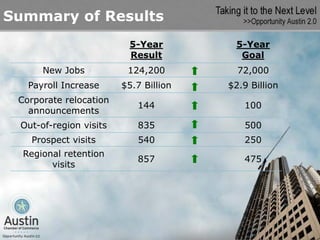
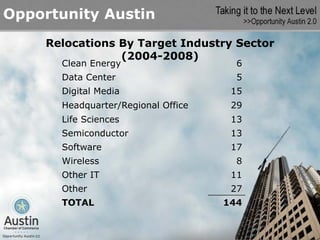
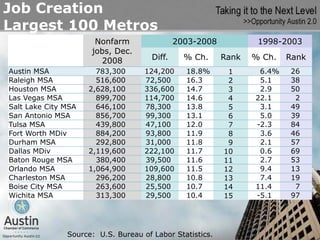
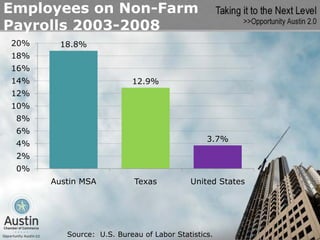
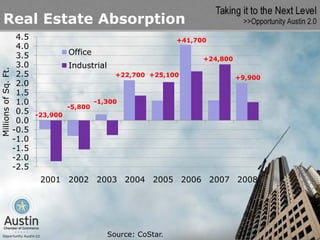
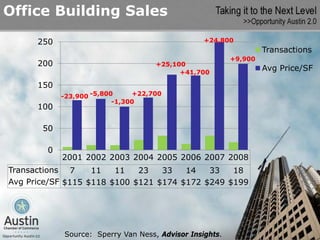
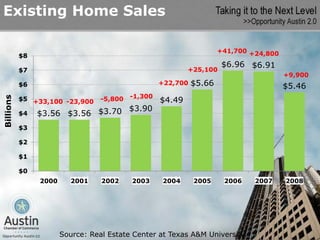

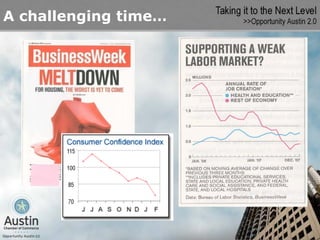
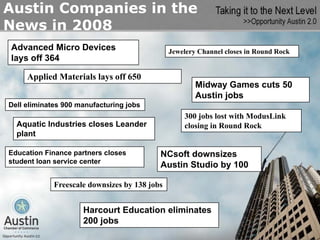
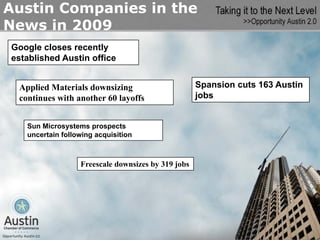
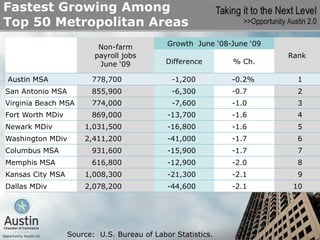
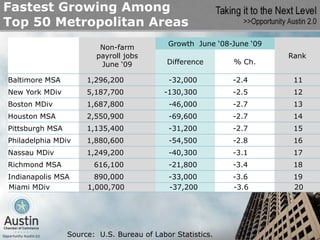
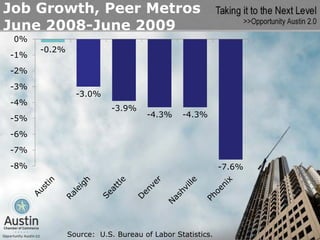


The document summarizes the economic impact of the tech bust in Austin, Texas from 2000-2003. It notes that occupancy rates for industrial and office space fell nearly 20% in this period. The city's sales tax revenue declined by $13 million, impacting city services. Venture capital investment dropped to 20% of 2000 levels by 2002. Meanwhile, Austin had reduced its economic development funding and staffing. The document outlines the goals and results of the Opportunity Austin economic development plan from 2004-2008, noting it exceeded job and payroll increase targets. Real estate absorption and prices rebounded after 2003. However, the economic downturn is also discussed, with many companies in Austin downsizing operations in 2008-2009.