More Related Content

PDF

PDF

PDF
lispmeetup#63 Common Lispでゼロから作るDeep Learning 
PDF

PPTX

PDF
CVPR2019読み会 (Rethinking the Evaluation of Video Summaries) 
PDF
UE4ディープラーニングってやつでなんとかして!環境構築編(Python3+TensorFlow) 
PDF
Reasoning with neural tensor networks for knowledge base completion What's hot

PDF
Transformer 動向調査 in 画像認識(修正版) 
PDF

PDF

PDF

PDF
Automatic Mixed Precision の紹介 
PDF
深層学習フレームワークにおけるIntel CPU/富岳向け最適化法 
PDF
SSII2018TS: 3D物体検出とロボットビジョンへの応用 
PPTX

PDF
DeepPose: Human Pose Estimation via Deep Neural Networks 
PPTX
え!? Power BI の画面からデータ更新なんてできるの!? 
PPTX
超初心者向けハンズオン講座 「ゼロから始めるQGIS」 
PDF

PDF
知っておくべきCephのIOアクセラレーション技術とその活用方法 - OpenStack最新情報セミナー 2015年9月 
PDF
【チュートリアル】コンピュータビジョンによる動画認識 
PDF
文献紹介:Rethinking Data Augmentation for Image Super-resolution: A Comprehensive... 
PPTX

PDF

PDF
PDF
【論文読み会】Universal Language Model Fine-tuning for Text Classification 
PPTX
Similar to Classification

PDF

PDF

PDF

PDF

PDF

PDF

PDF

PDF

PDF

PDF

PDF

PDF

PDF

PPTX

PDF

PDF
Building detection with decision fusion 
PDF

PDF

PDF

PDF
地理空間とOSGeoとPostGISとを簡単に紹介してみます More from NakamuraShinsaku

PDF

PDF

PDF
Japan Booth, Small Sat Conference 2019 
PDF

PDF
Fieldnaut neworleans201712.pptx 
PDF
Practical GIS Data Integration System 
PDF

PDF

PDF
Classification
- 1.
- 2.
Copyright 2017. JapanSpace Systems. All Rights Reserved.
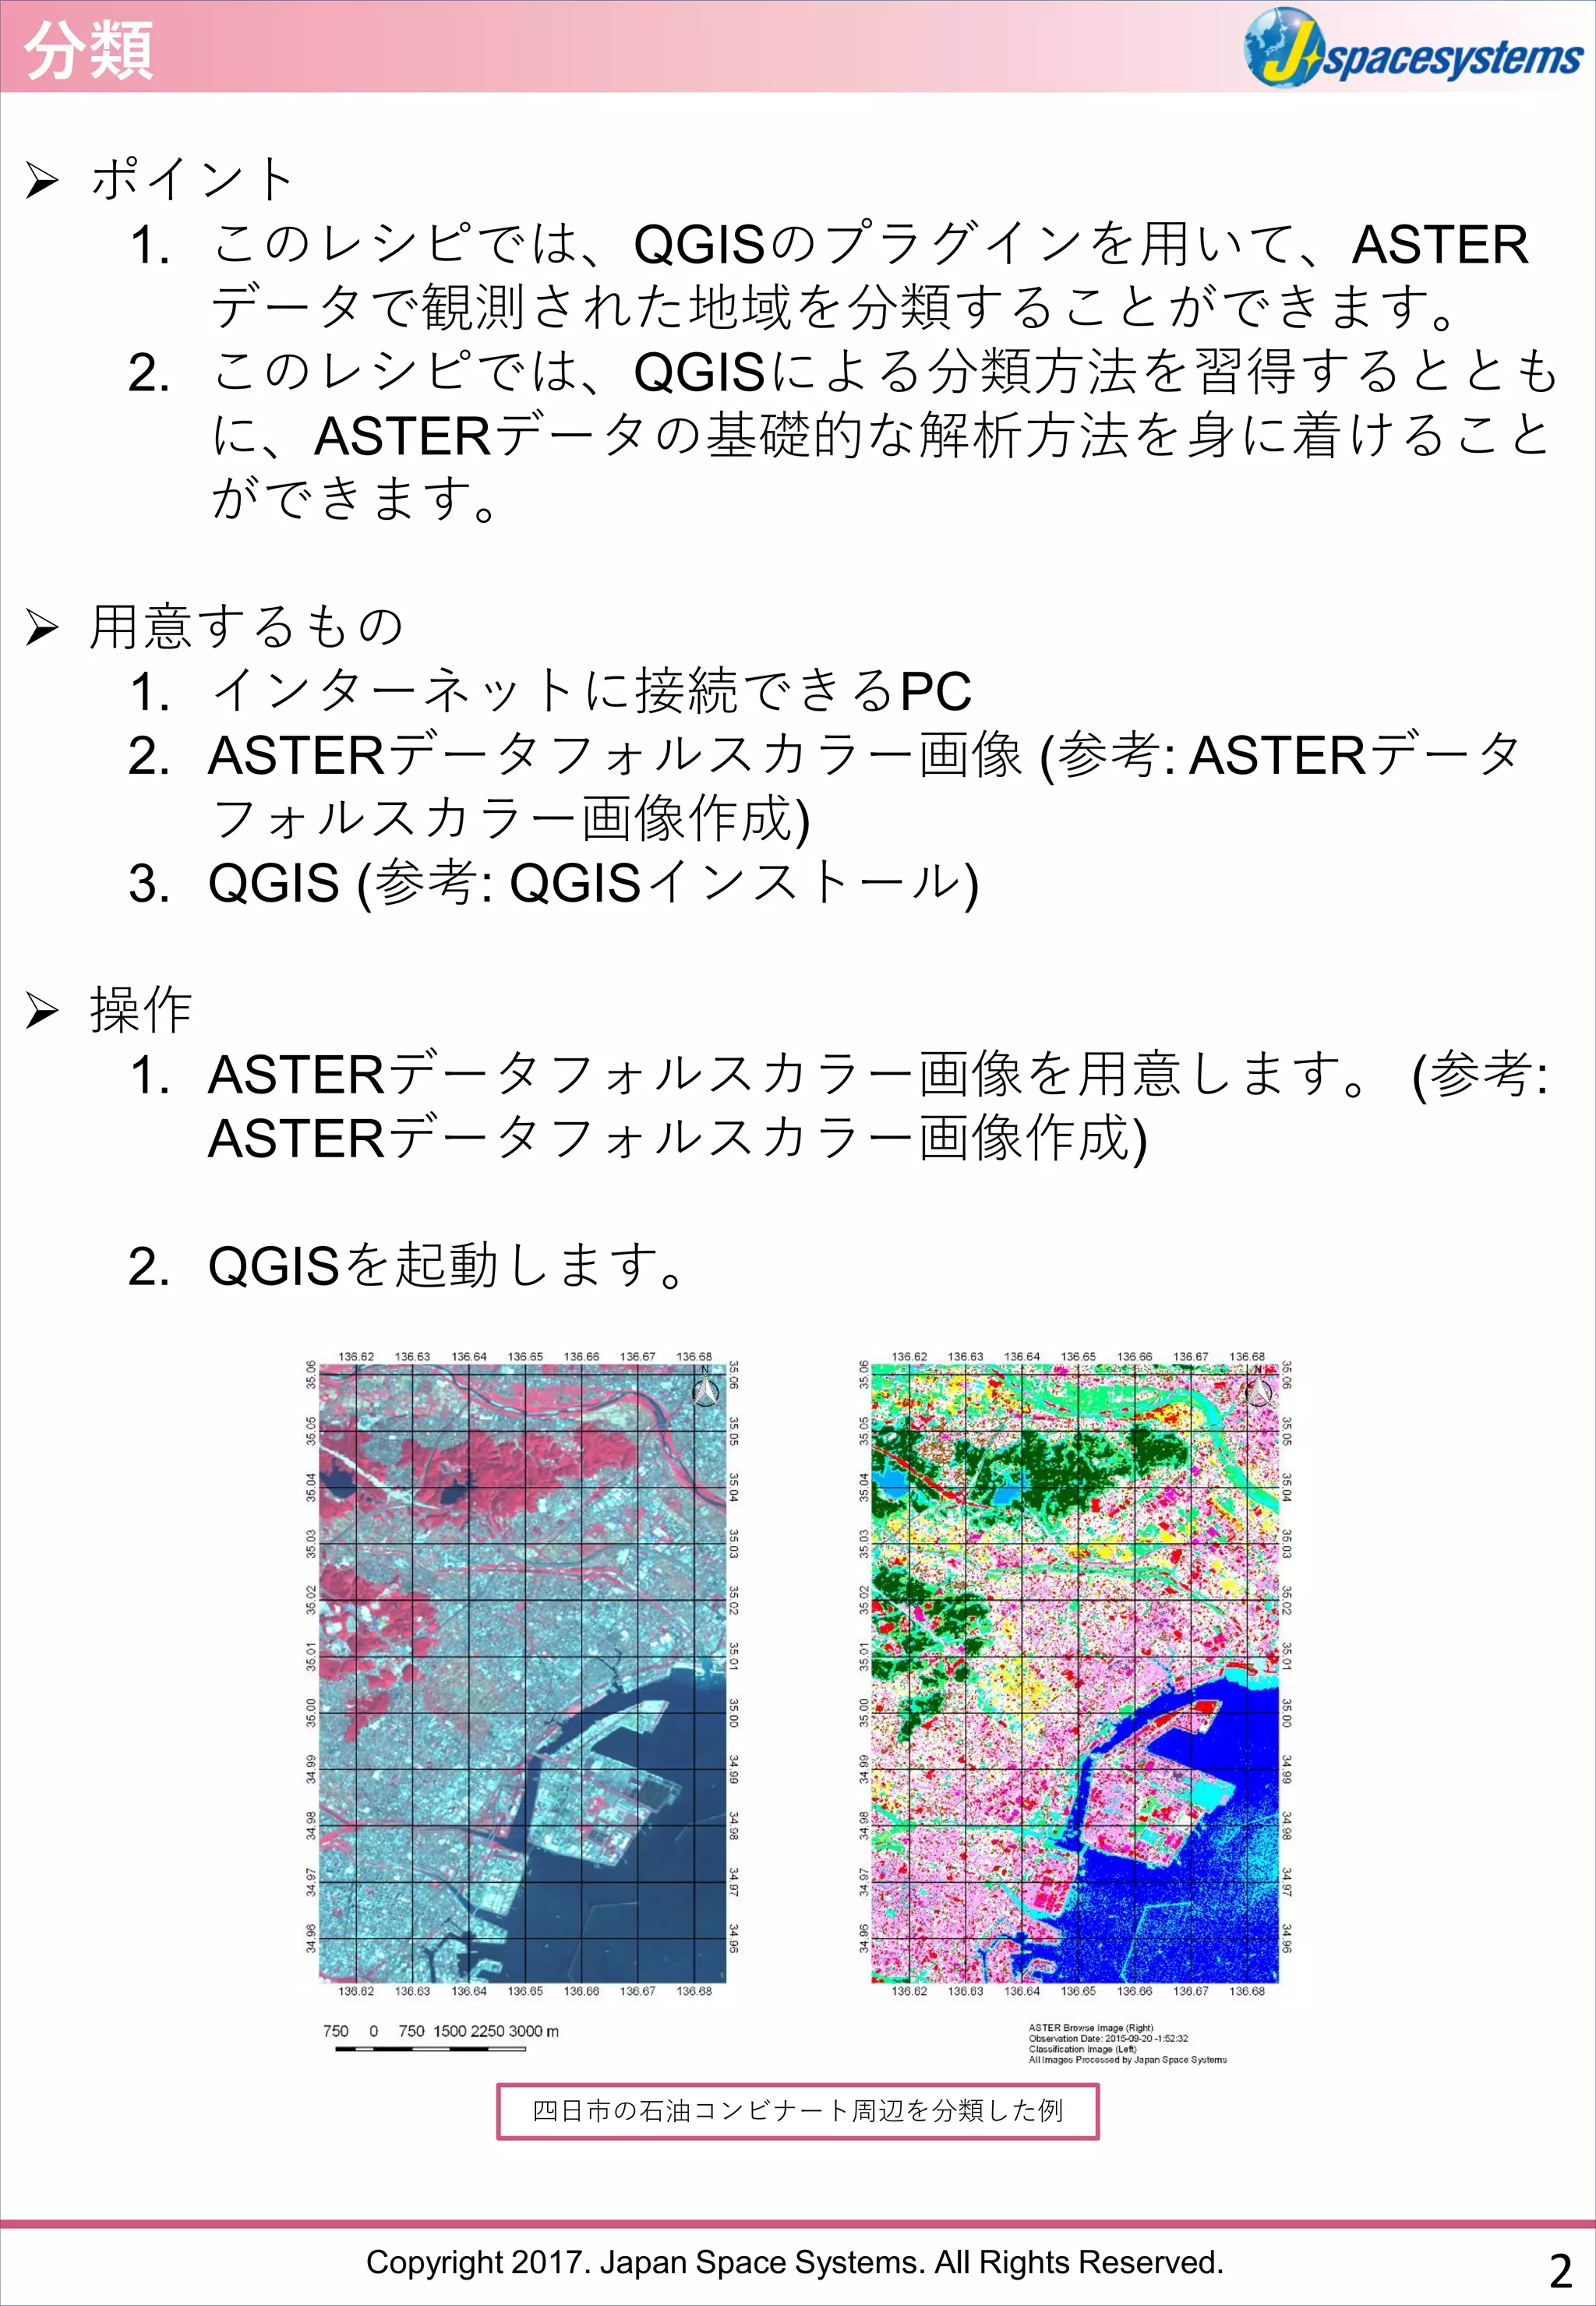
分類
➢ ポイント
1. このレシピでは、QGISのプラグインを用いて、ASTER
データで観測された地域を分類することができます。
2. このレシピでは、QGISによる分類方法を習得するととも
に、ASTERデータの基礎的な解析方法を身に着けること
ができます。
➢ 用意するもの
1. インターネットに接続できるPC
2. ASTERデータフォルスカラー画像 (参考: ASTERデータ
フォルスカラー画像作成)
3. QGIS (参考: QGISインストール)
➢ 操作
1. ASTERデータフォルスカラー画像を用意します。 (参考:
ASTERデータフォルスカラー画像作成)
2. QGISを起動します。
2
四日市の石油コンビナート周辺を分類した例
- 3.
Copyright 2017. JapanSpace Systems. All Rights Reserved.
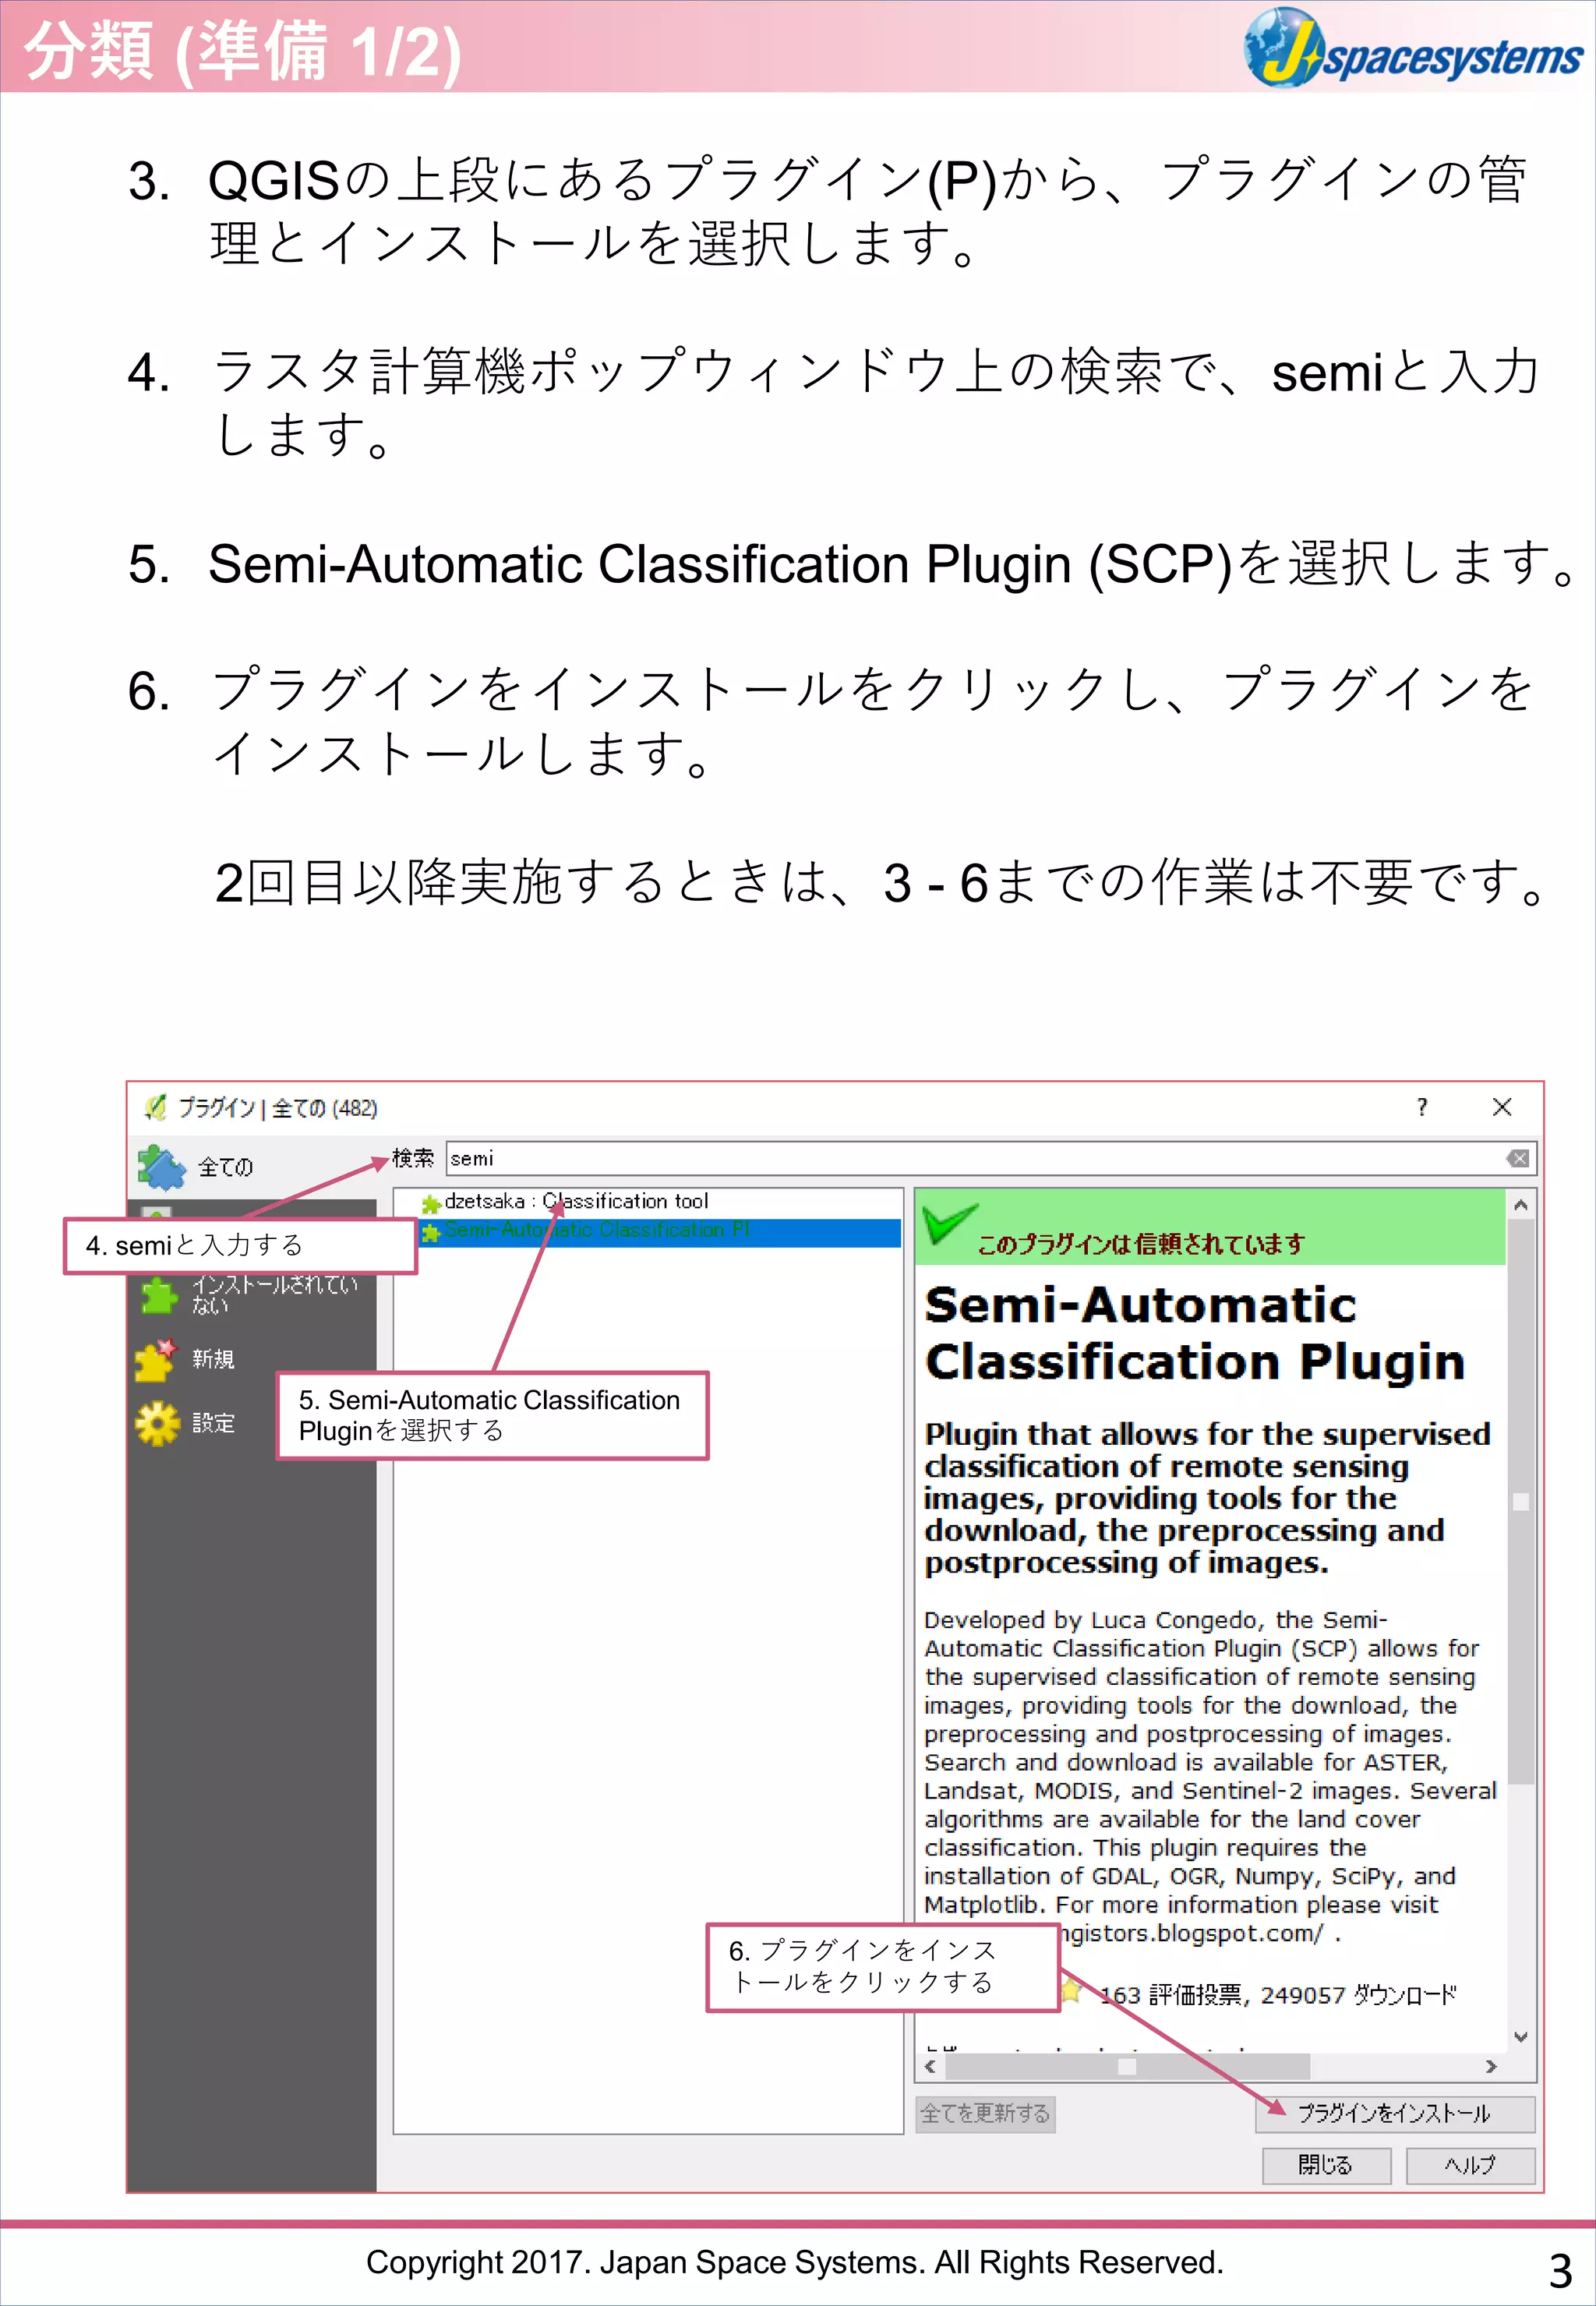
3. QGISの上段にあるプラグイン(P)から、プラグインの管
理とインストールを選択します。
4. ラスタ計算機ポップウィンドウ上の検索で、semiと入力
します。
5. Semi-Automatic Classification Plugin (SCP)を選択します。
6. プラグインをインストールをクリックし、プラグインを
インストールします。
2回目以降実施するときは、3 - 6までの作業は不要です。
5. Semi-Automatic Classification
Pluginを選択する
4. semiと入力する
6. プラグインをインス
トールをクリックする
分類 (準備 1/2)
3
- 4.
Copyright 2017. JapanSpace Systems. All Rights Reserved.
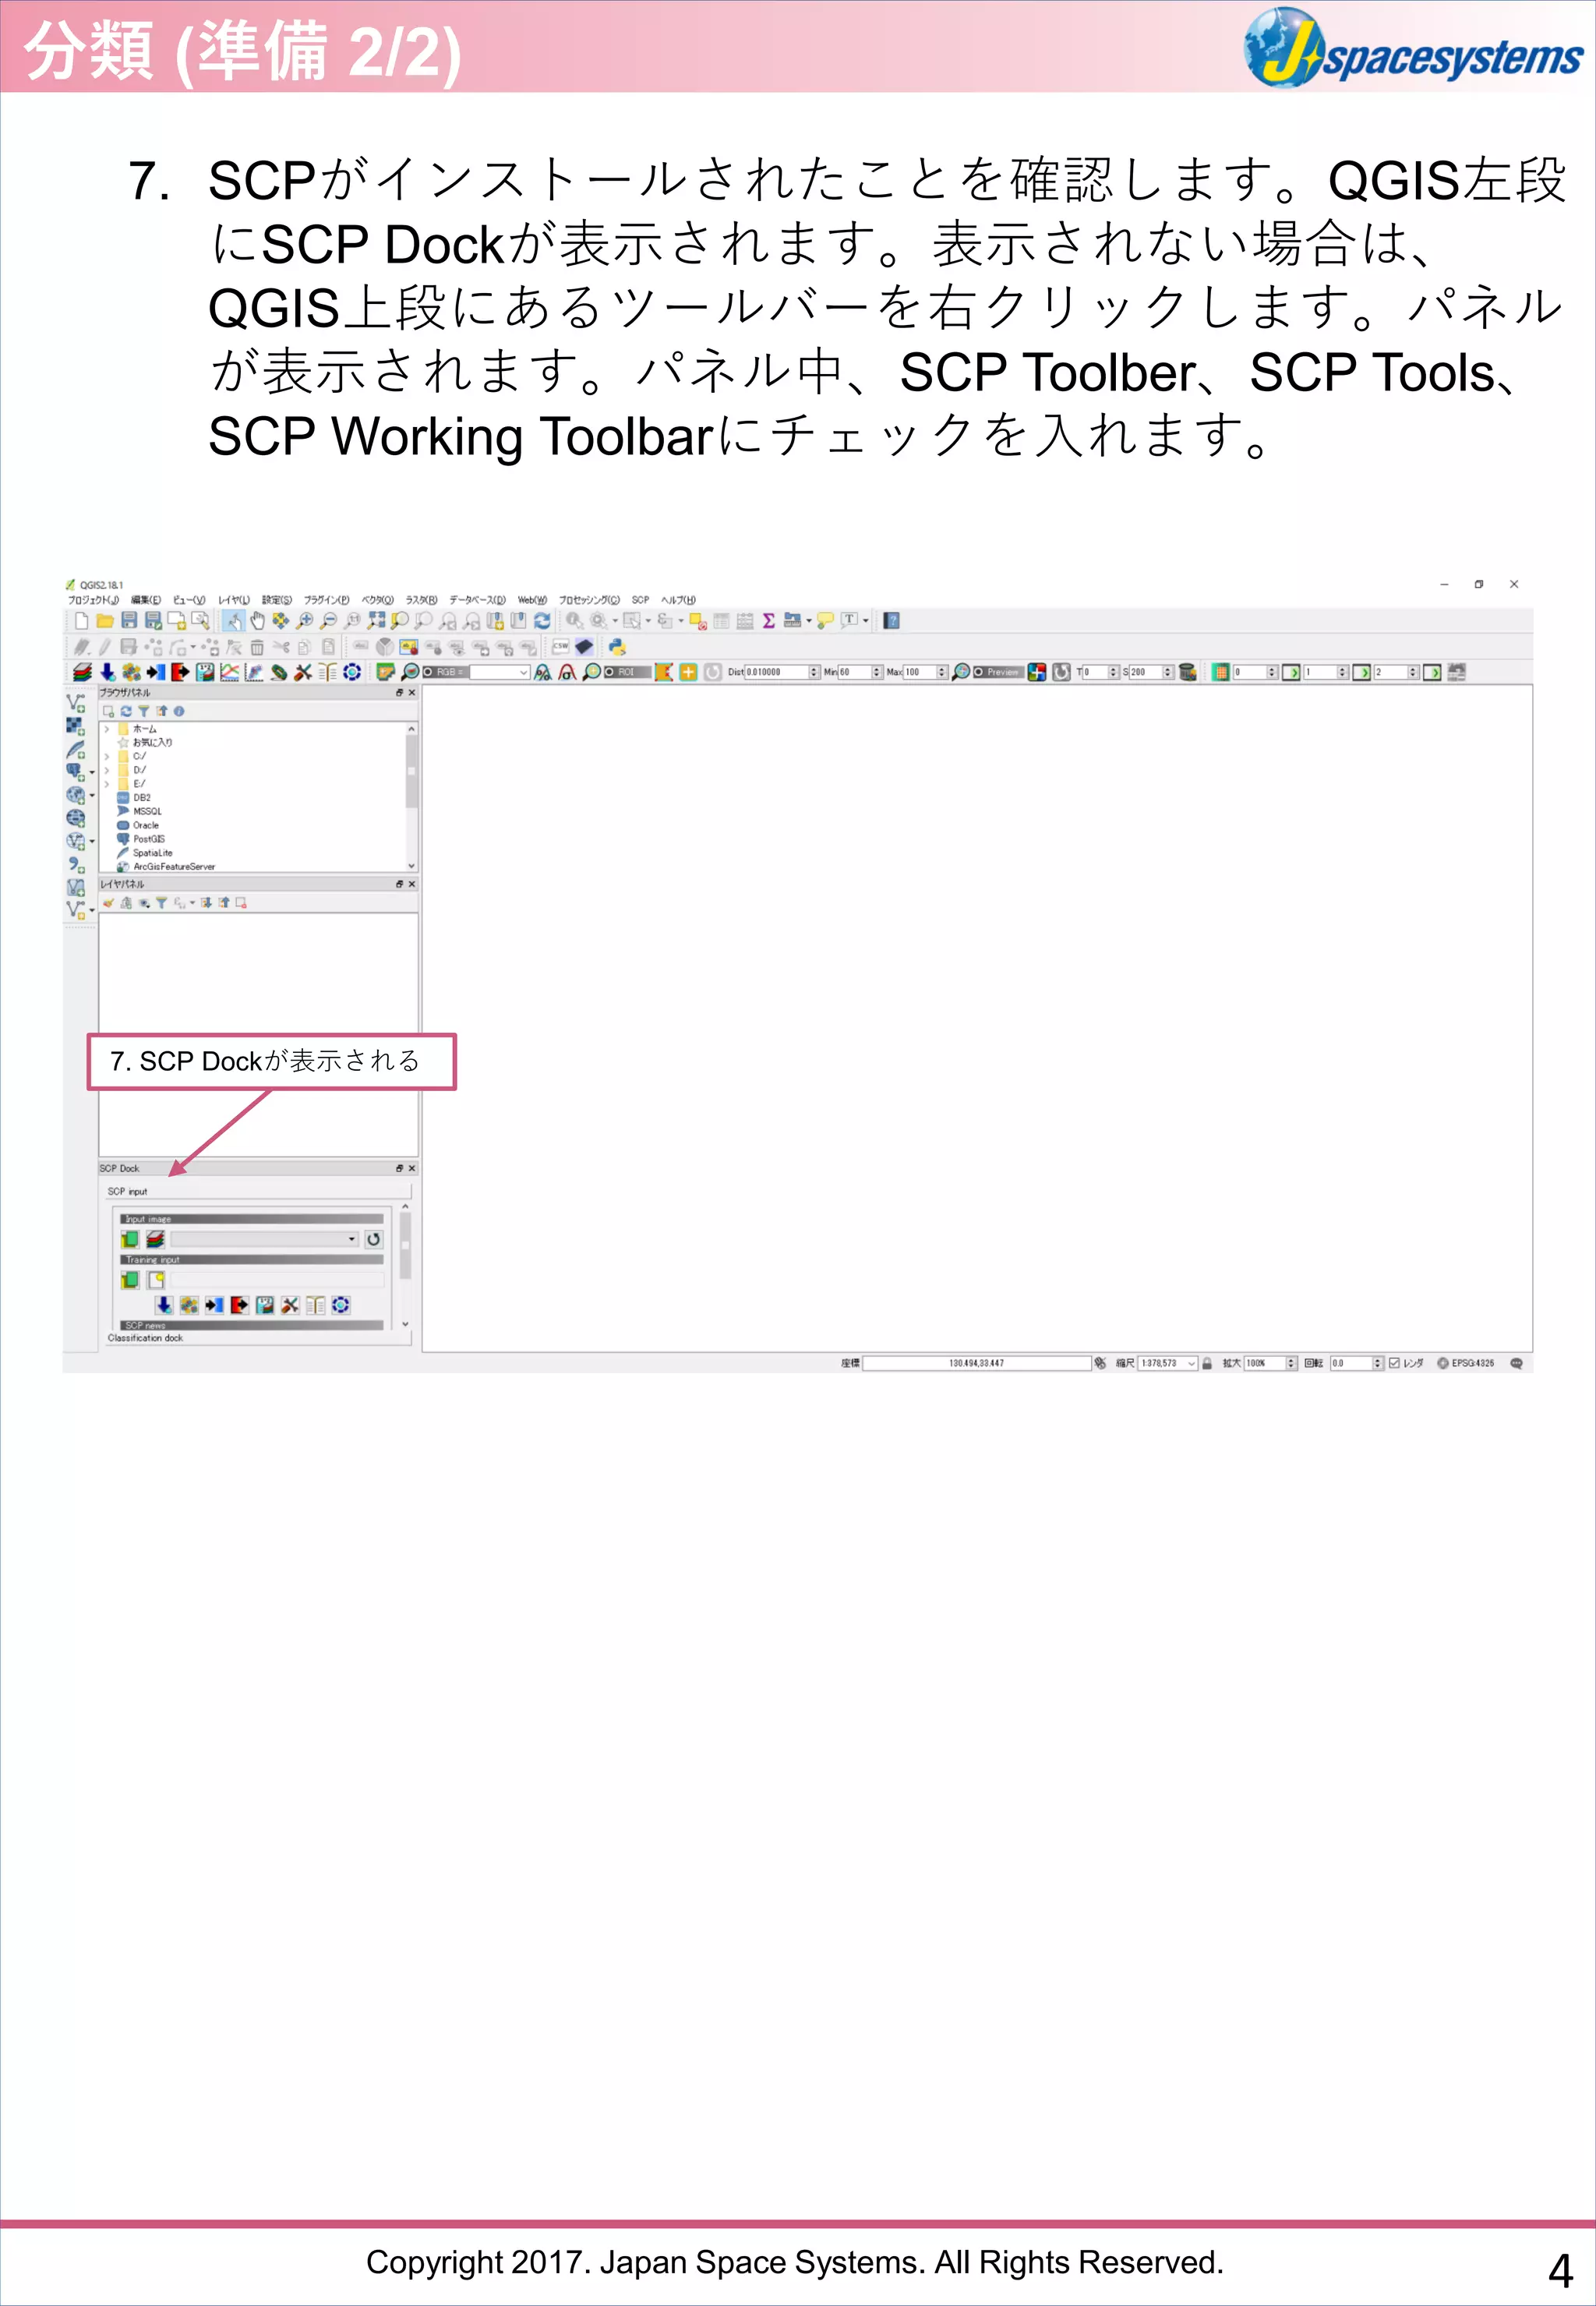
7. SCPがインストールされたことを確認します。QGIS左段
にSCP Dockが表示されます。表示されない場合は、
QGIS上段にあるツールバーを右クリックします。パネル
が表示されます。パネル中、SCP Toolber、SCP Tools、
SCP Working Toolbarにチェックを入れます。
7. SCP Dockが表示される
分類 (準備 2/2)
4
- 5.
Copyright 2017. JapanSpace Systems. All Rights Reserved.
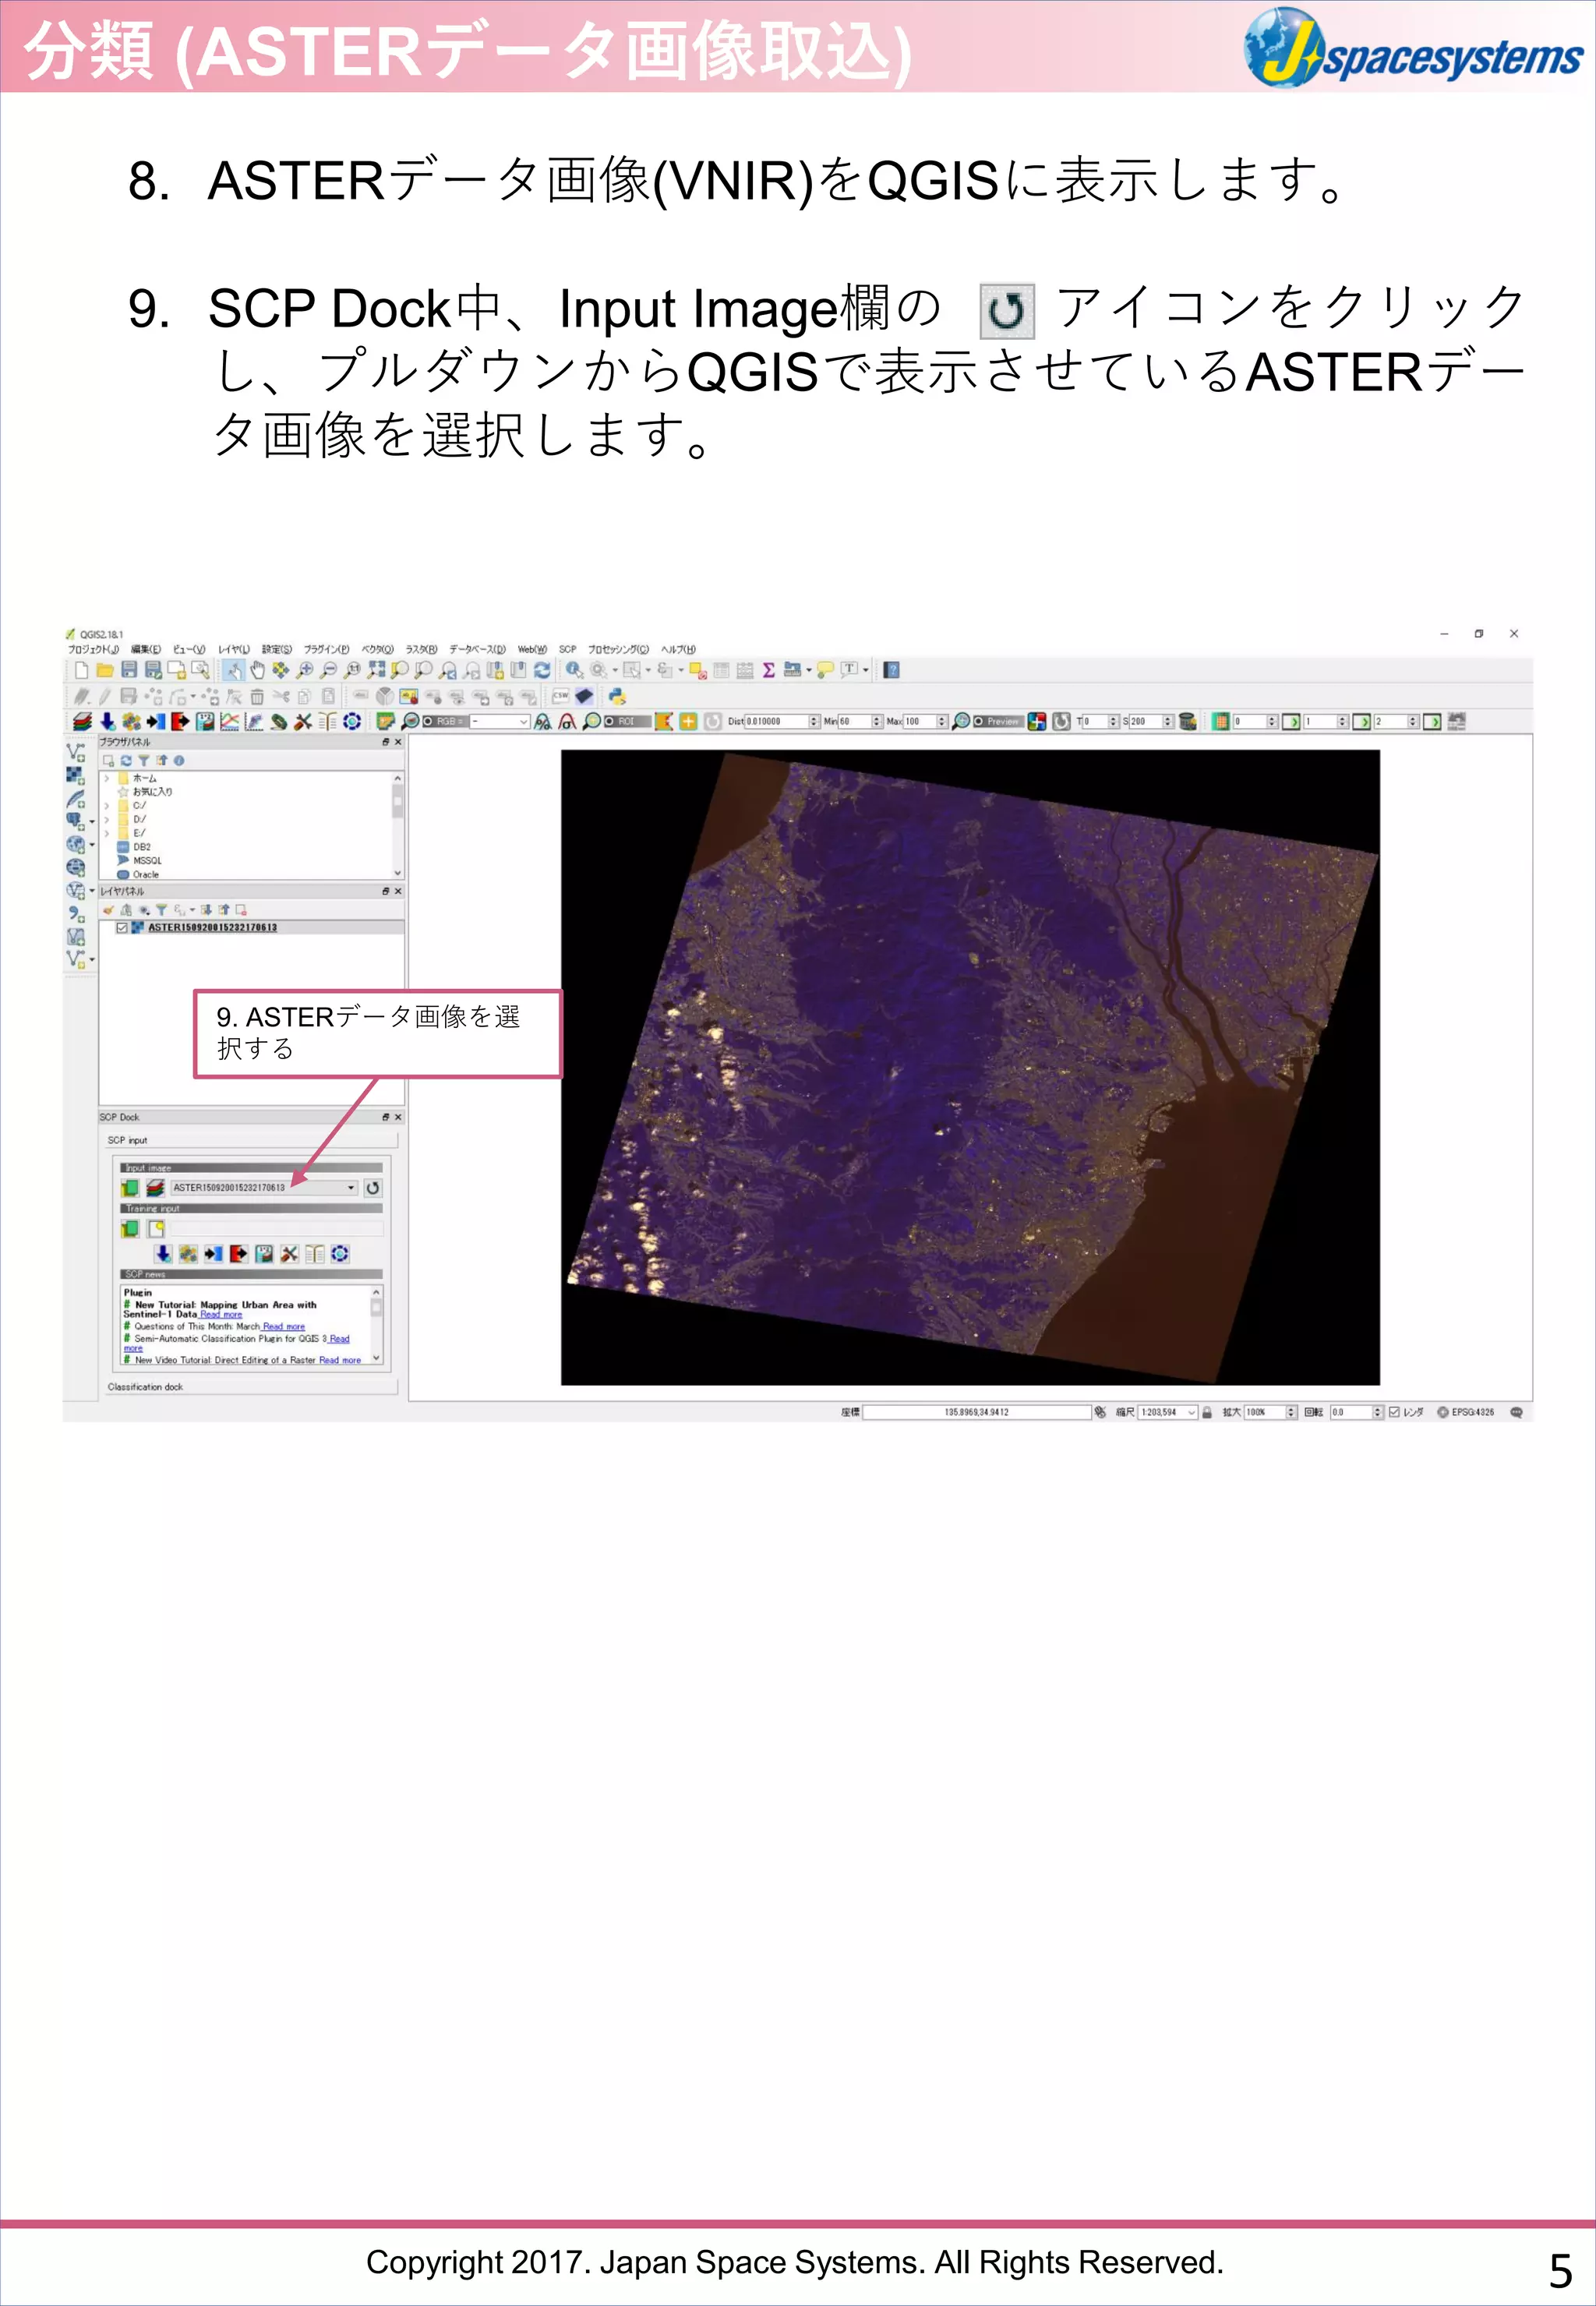
8. ASTERデータ画像(VNIR)をQGISに表示します。
9. SCP Dock中、Input Image欄の アイコンをクリック
し、プルダウンからQGISで表示させているASTERデー
タ画像を選択します。
9. ASTERデータ画像を選
択する
分類 (ASTERデータ画像取込)
5
- 6.
Copyright 2017. JapanSpace Systems. All Rights Reserved.
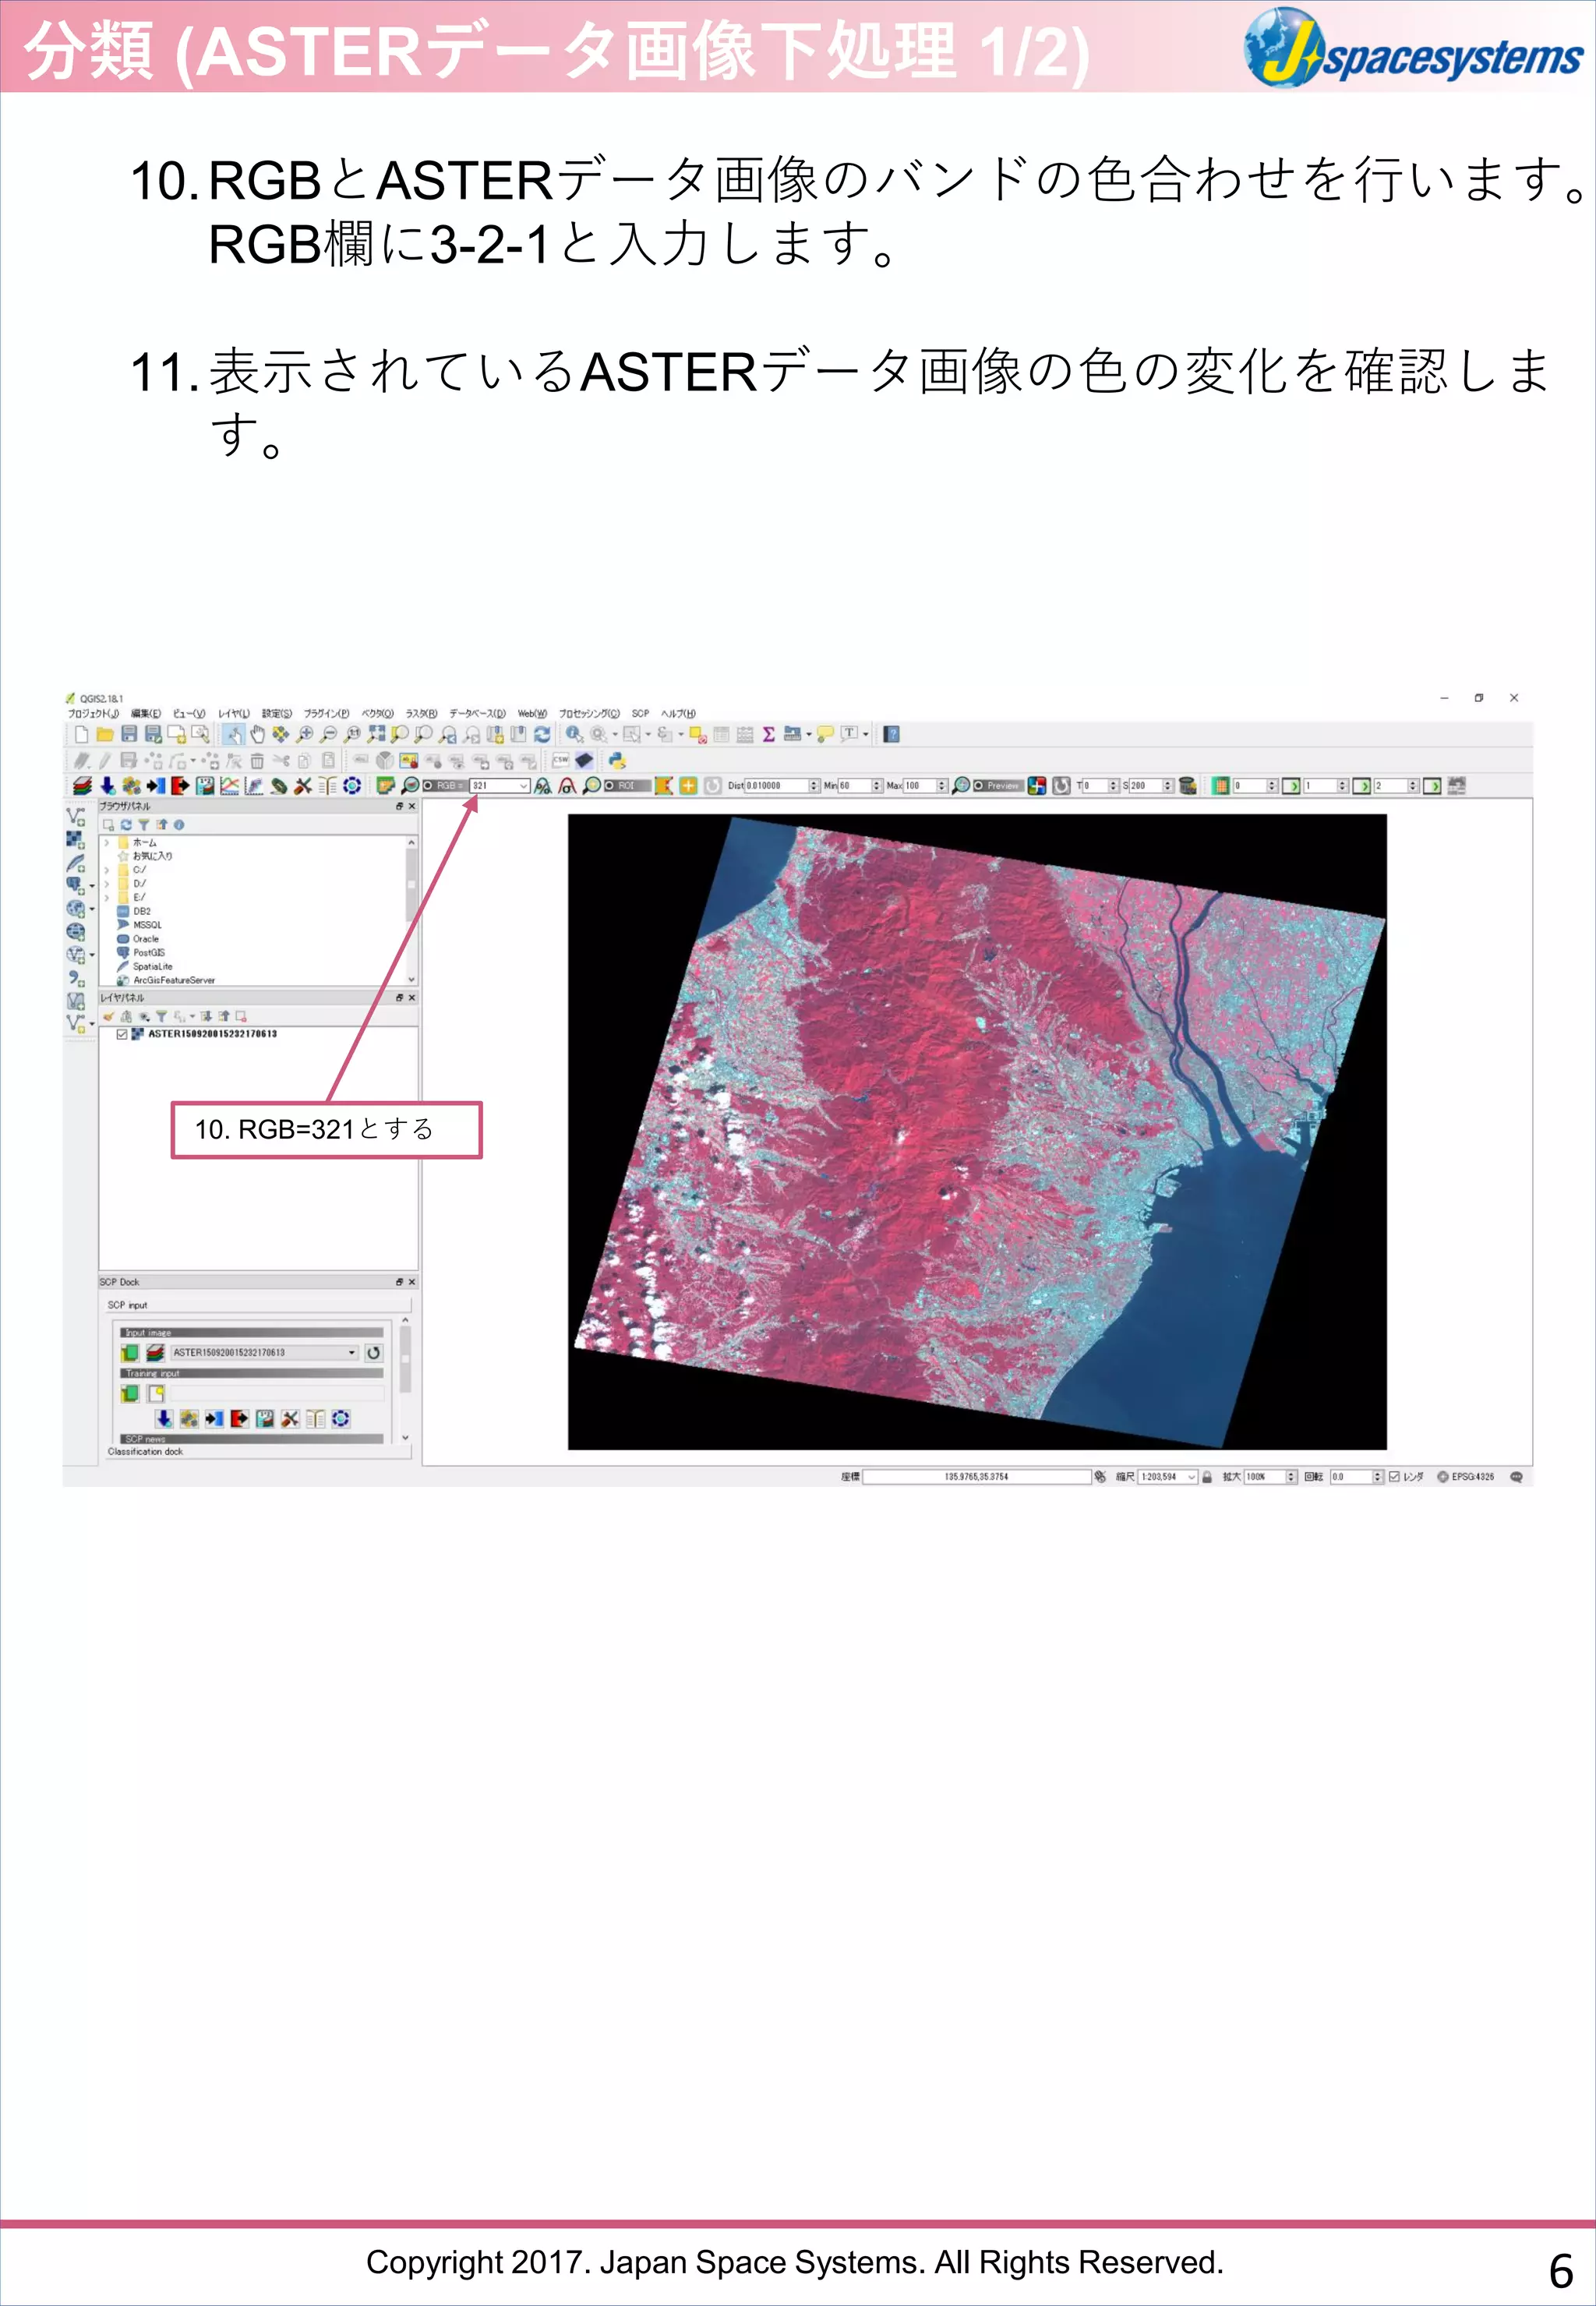
10.RGBとASTERデータ画像のバンドの色合わせを行います。
RGB欄に3-2-1と入力します。
11.表示されているASTERデータ画像の色の変化を確認しま
す。
10. RGB=321とする
分類 (ASTERデータ画像下処理 1/2)
6
- 7.
Copyright 2017. JapanSpace Systems. All Rights Reserved.
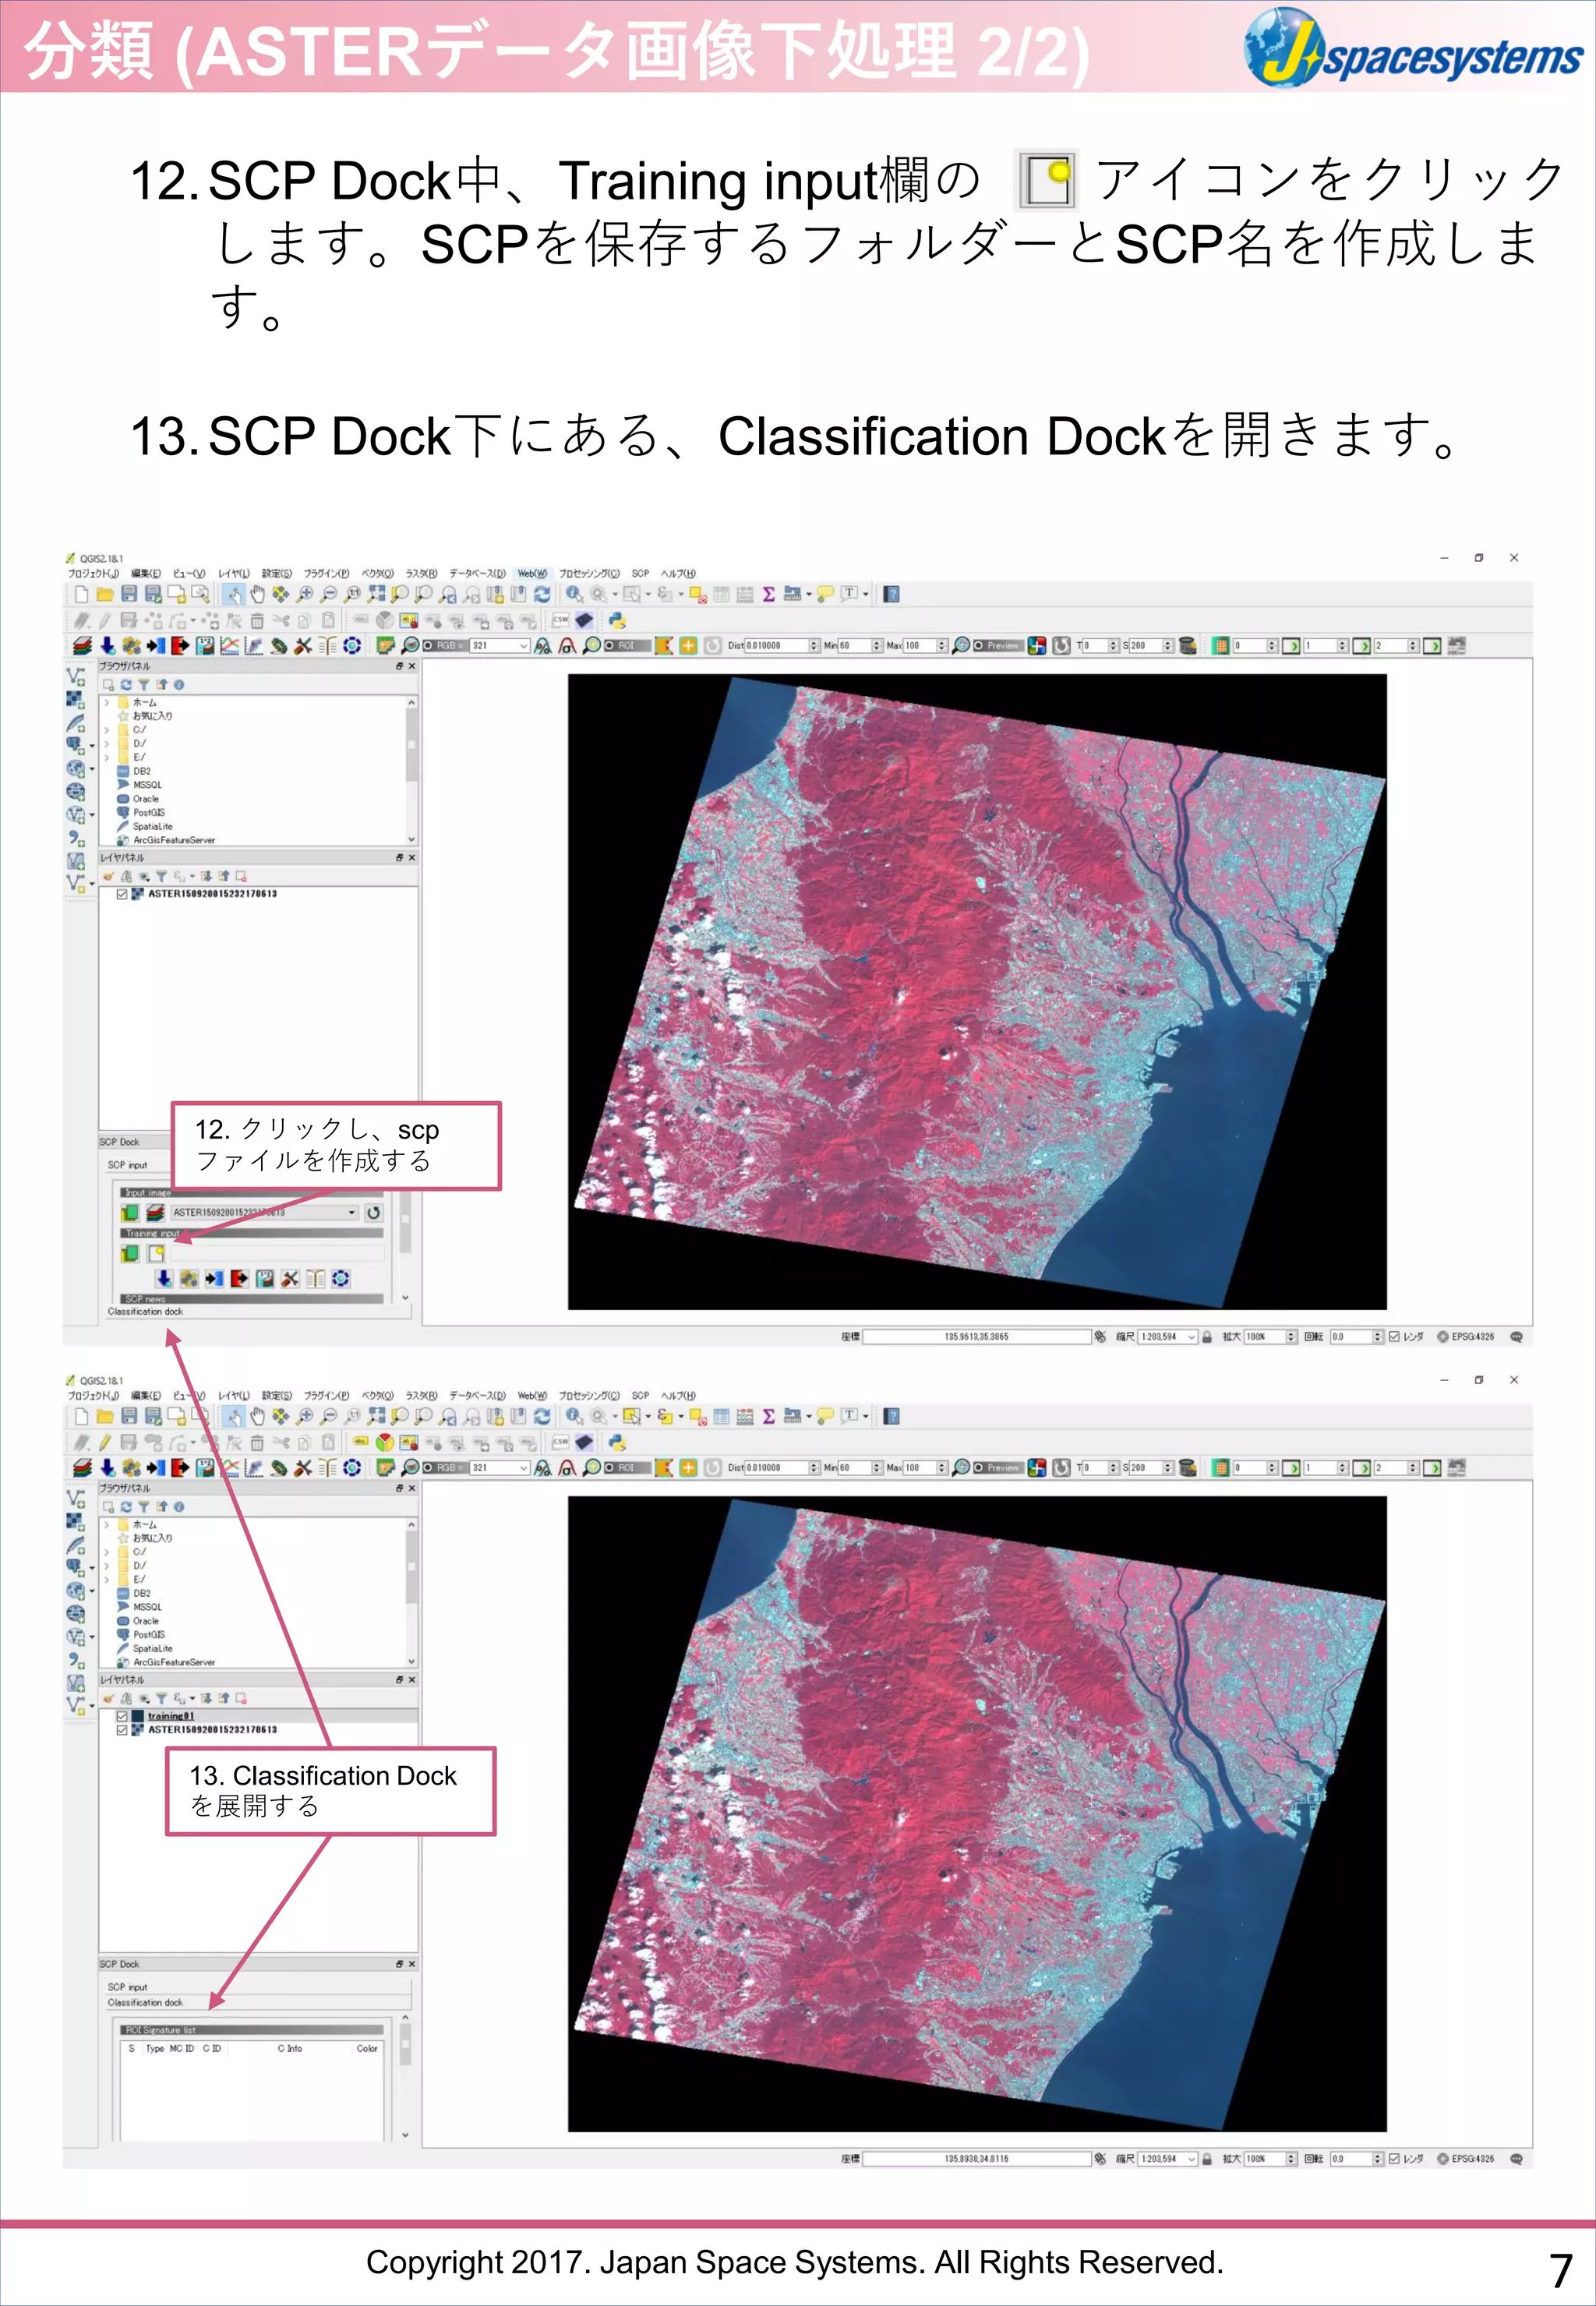
12.SCP Dock中、Training input欄の アイコンをクリック
します。SCPを保存するフォルダーとSCP名を作成しま
す。
13.SCP Dock下にある、Classification Dockを開きます。
12. クリックし、scp
ファイルを作成する
分類 (ASTERデータ画像下処理 2/2)
13. Classification Dock
を展開する
7
- 8.
Copyright 2017. JapanSpace Systems. All Rights Reserved.
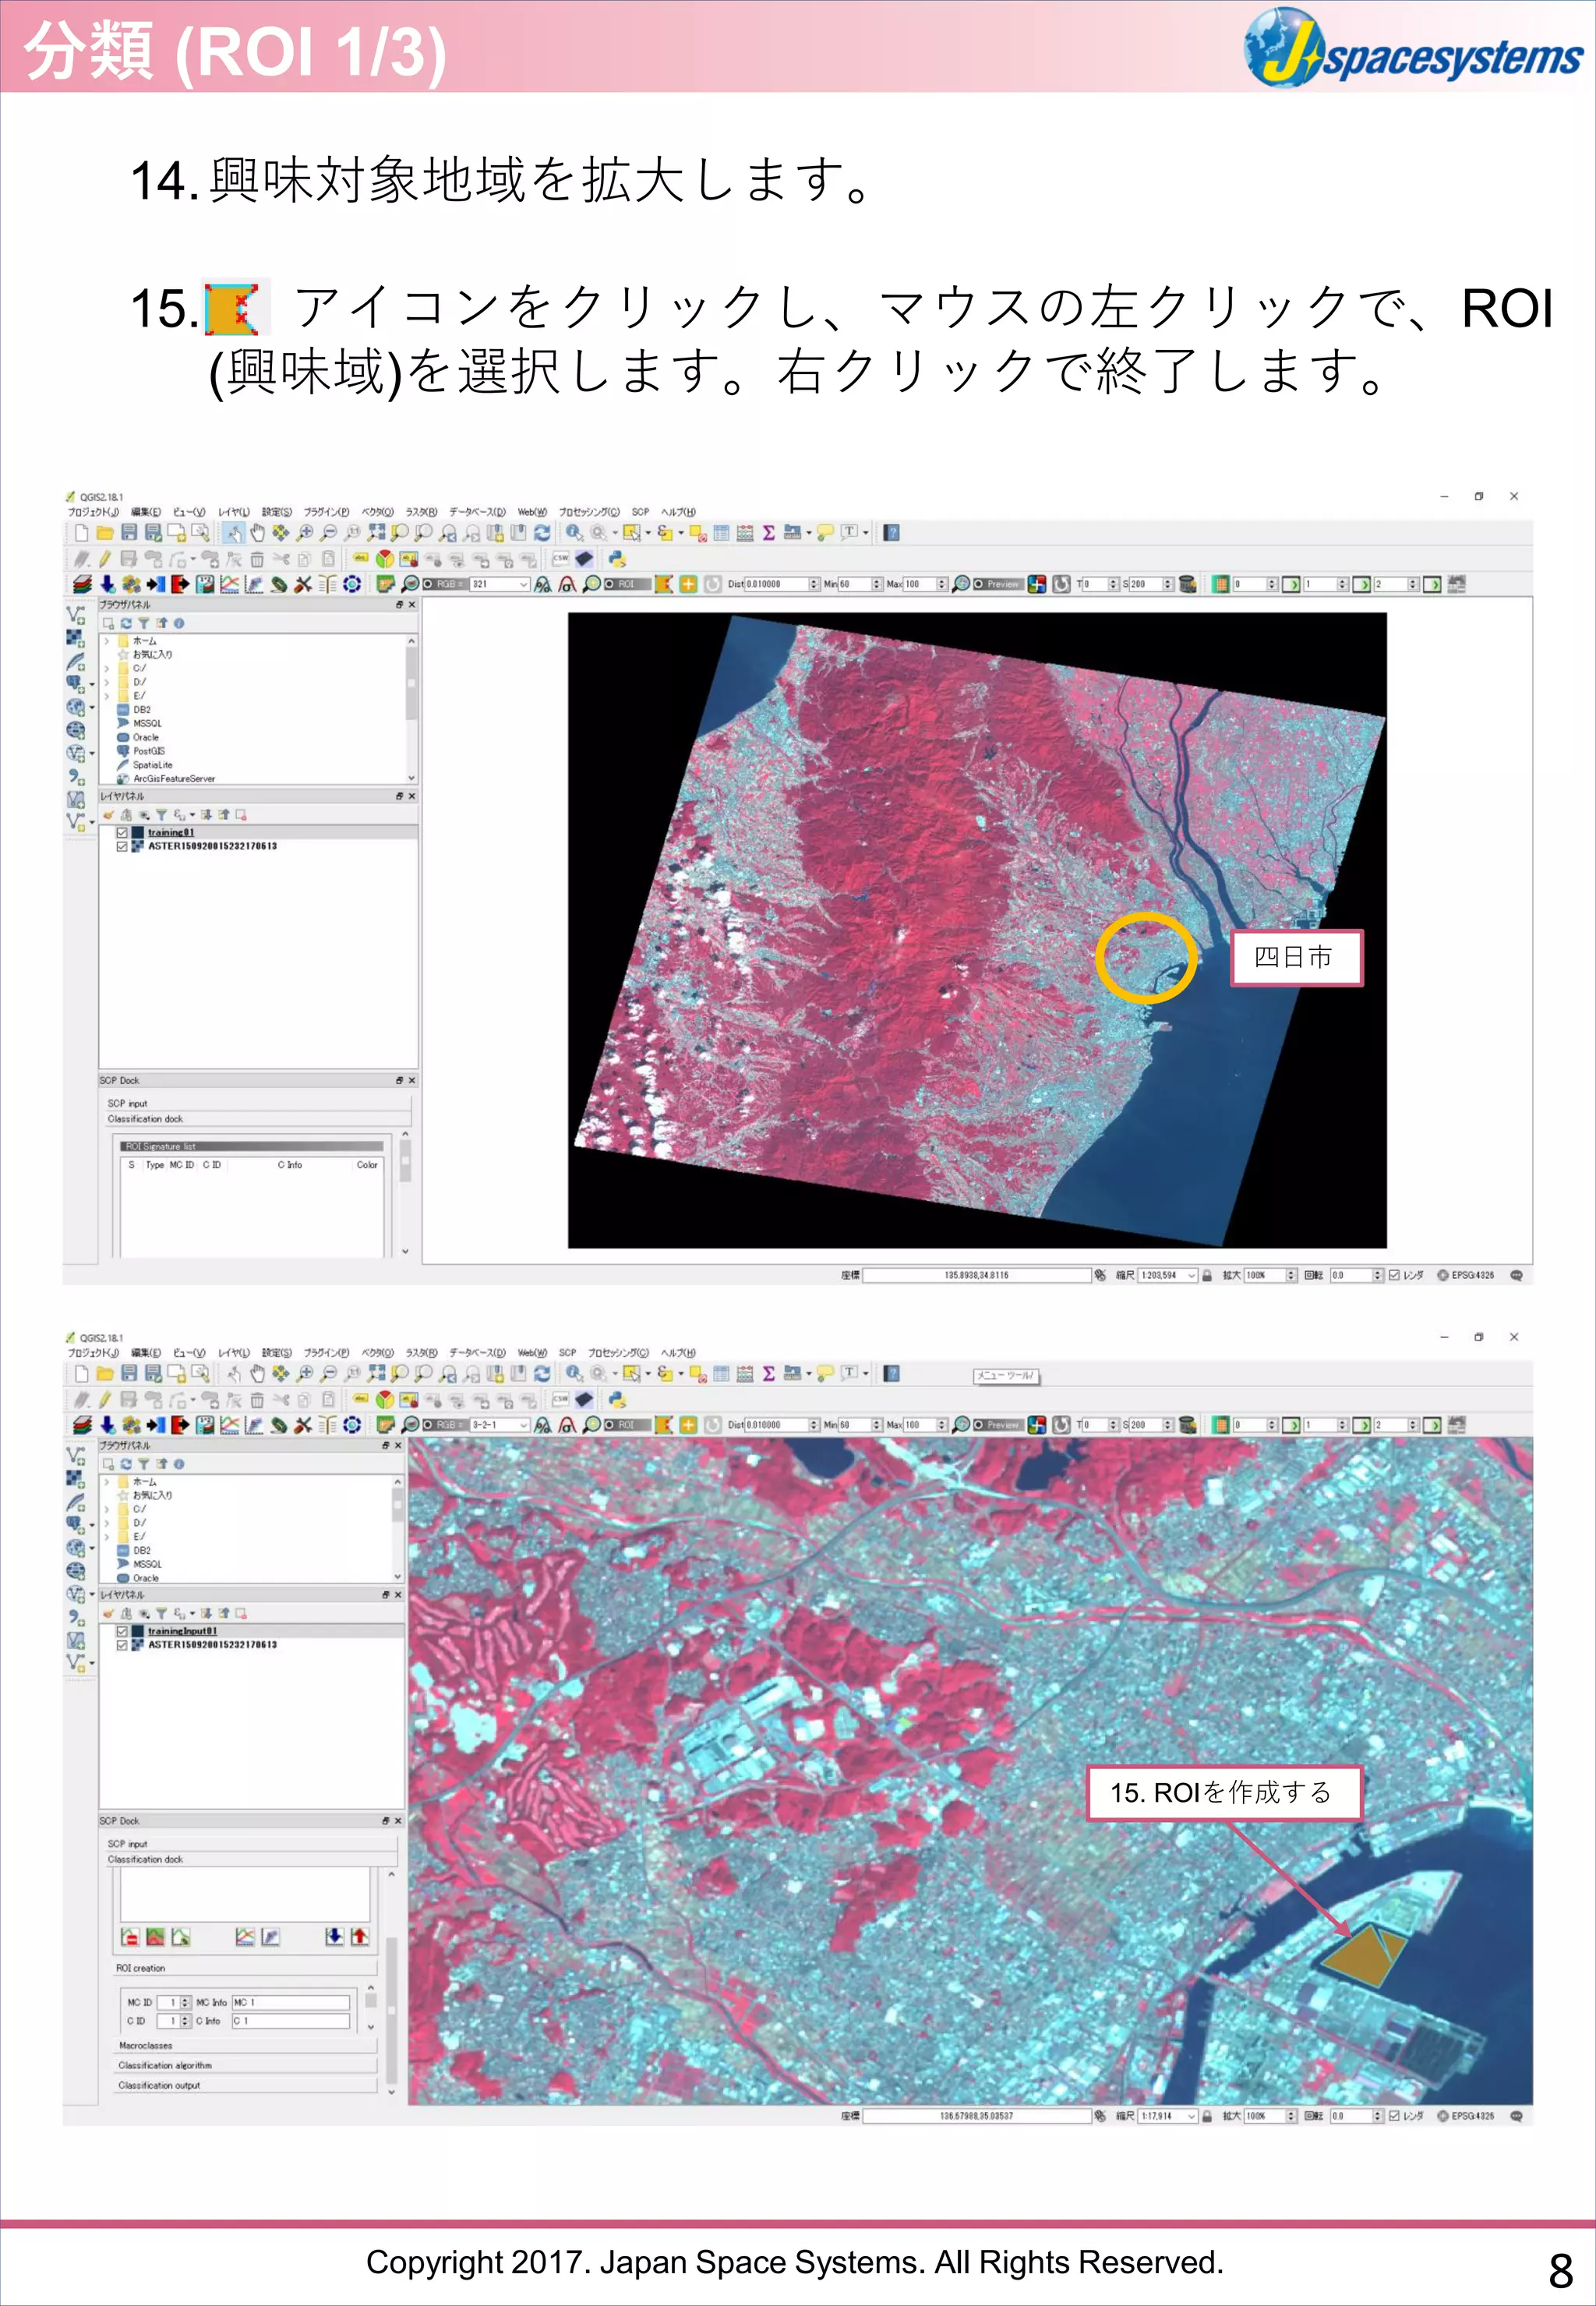
14.興味対象地域を拡大します。
15. アイコンをクリックし、マウスの左クリックで、ROI
(興味域)を選択します。右クリックで終了します。
12. クリックし、
shapefile名を作成する
分類 (ROI 1/3)
15. ROIを作成する
四日市
8
- 9.
Copyright 2017. JapanSpace Systems. All Rights Reserved.
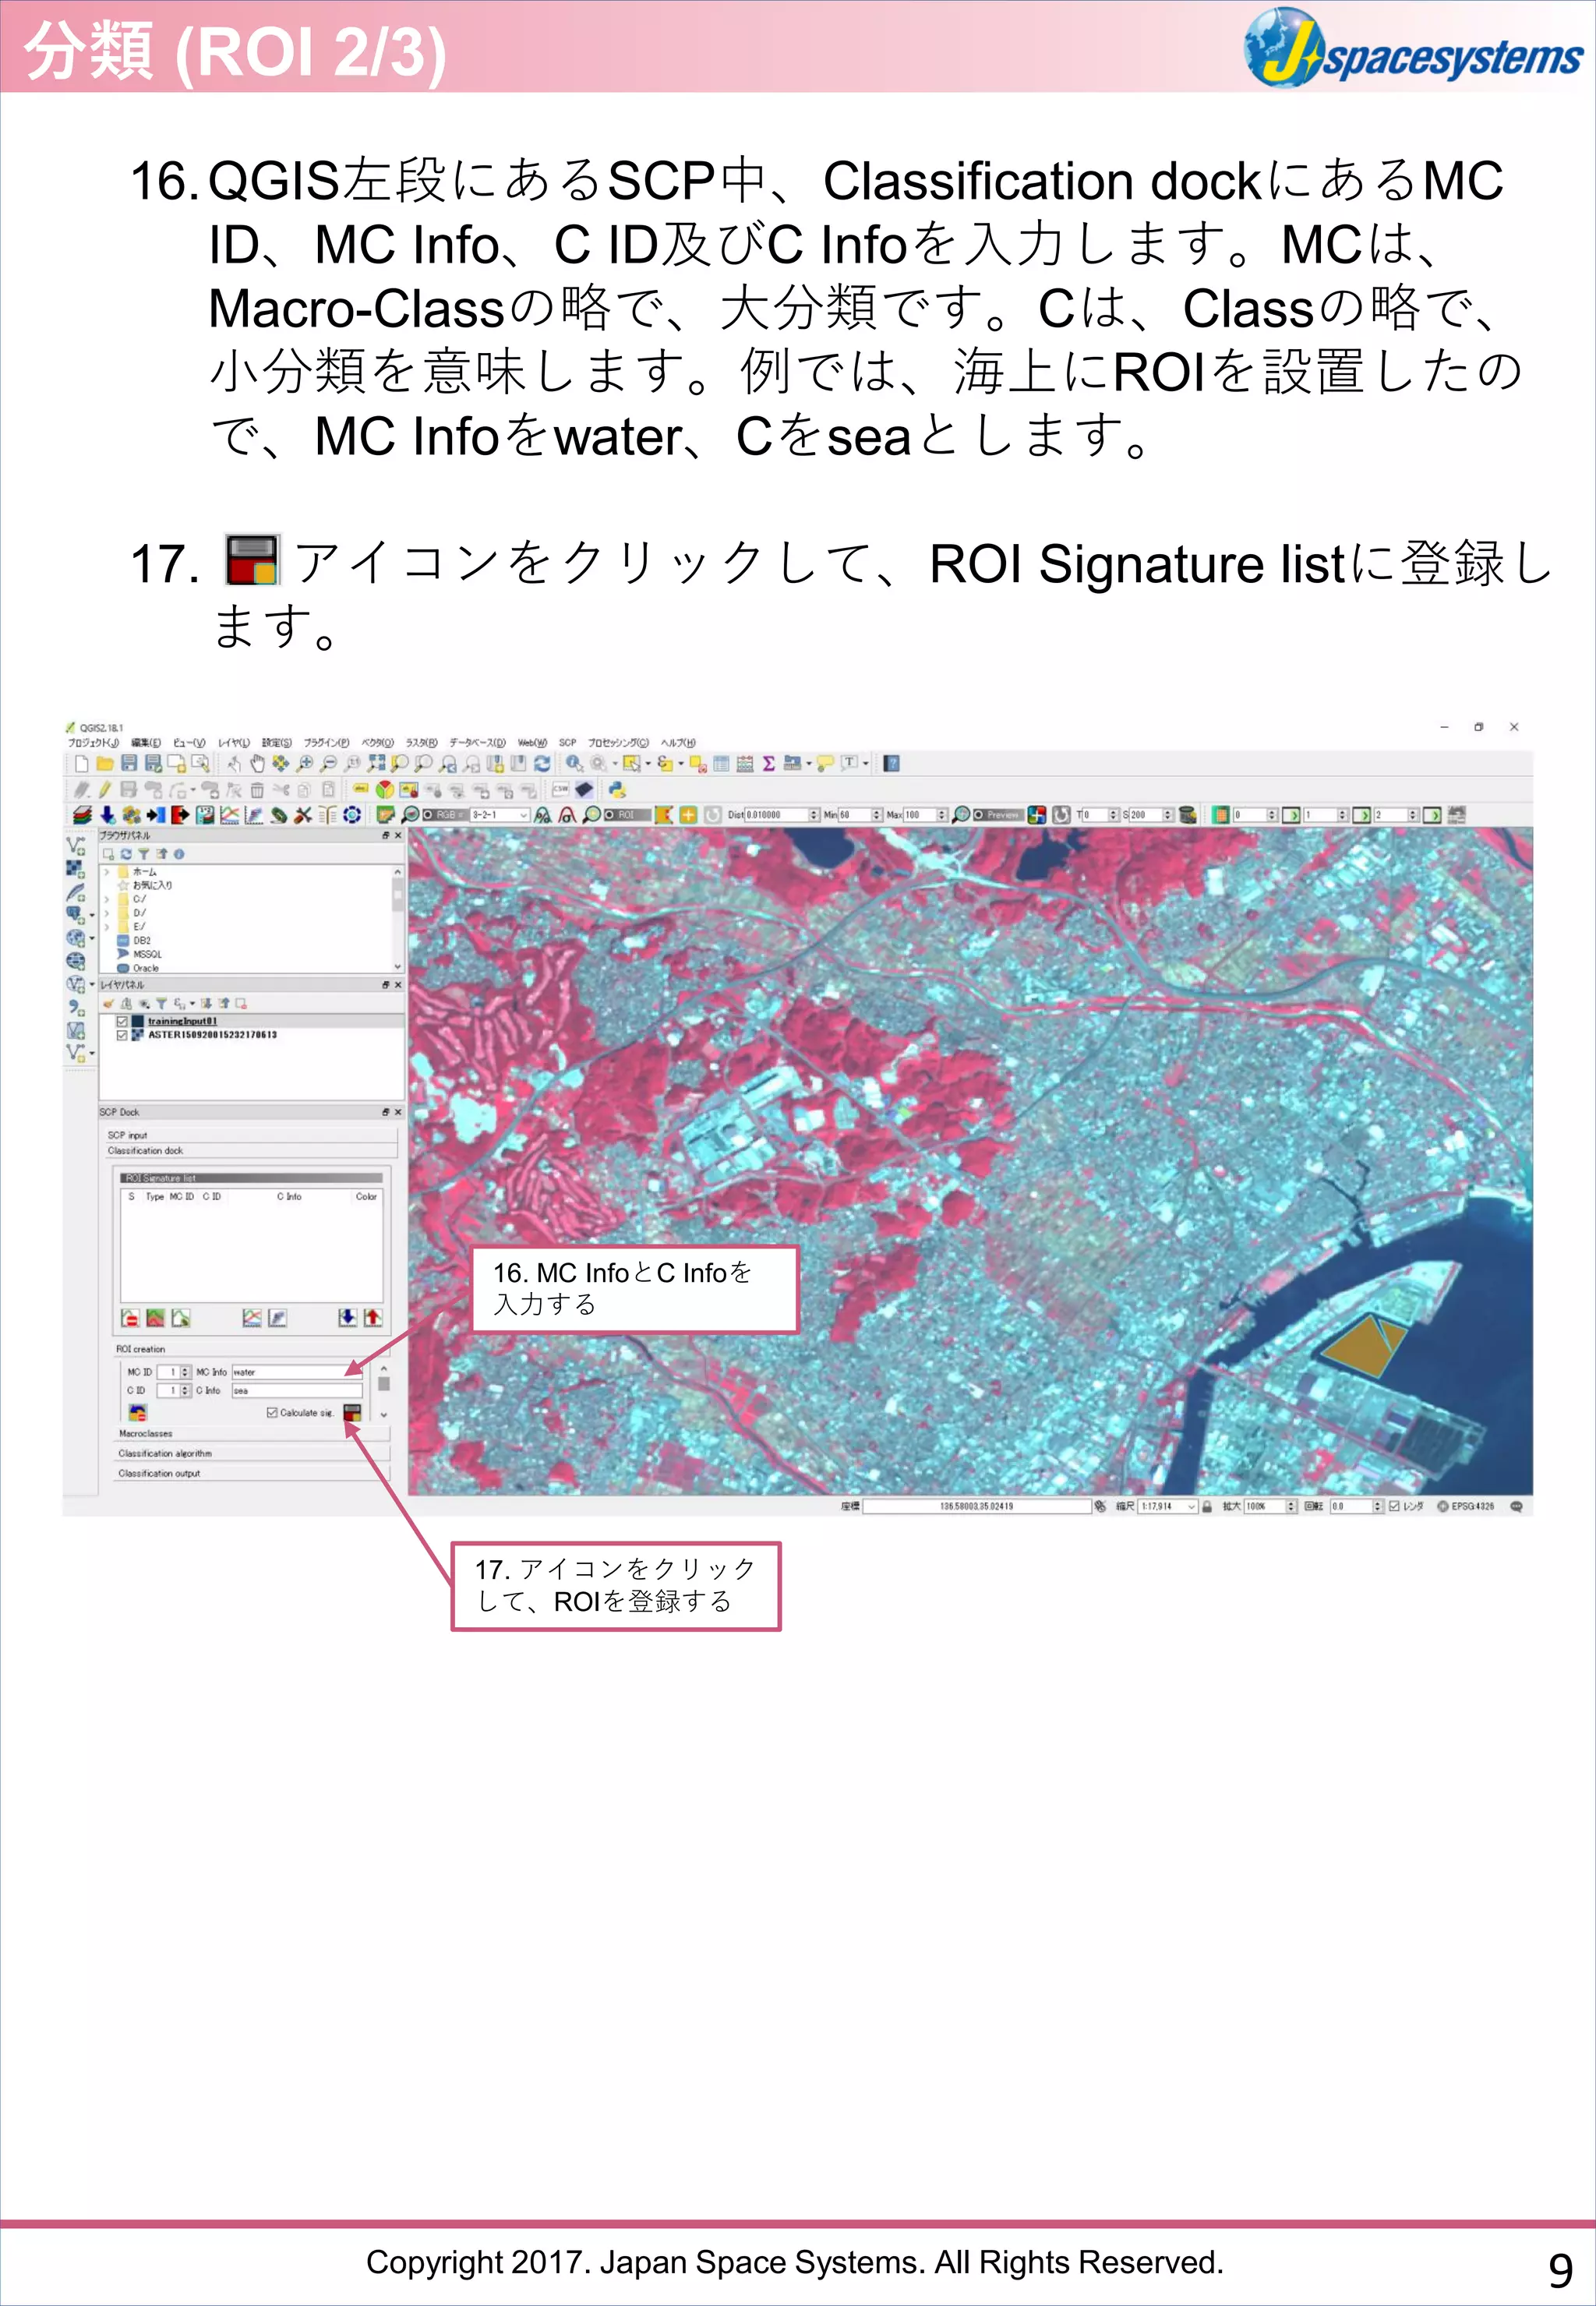
16.QGIS左段にあるSCP中、Classification dockにあるMC
ID、MC Info、C ID及びC Infoを入力します。MCは、
Macro-Classの略で、大分類です。Cは、Classの略で、
小分類を意味します。例では、海上にROIを設置したの
で、MC Infoをwater、Cをseaとします。
17. アイコンをクリックして、ROI Signature listに登録し
ます。
16. MC InfoとC Infoを
入力する
分類 (ROI 2/3)
17. アイコンをクリック
して、ROIを登録する
9
- 10.
Copyright 2017. JapanSpace Systems. All Rights Reserved.
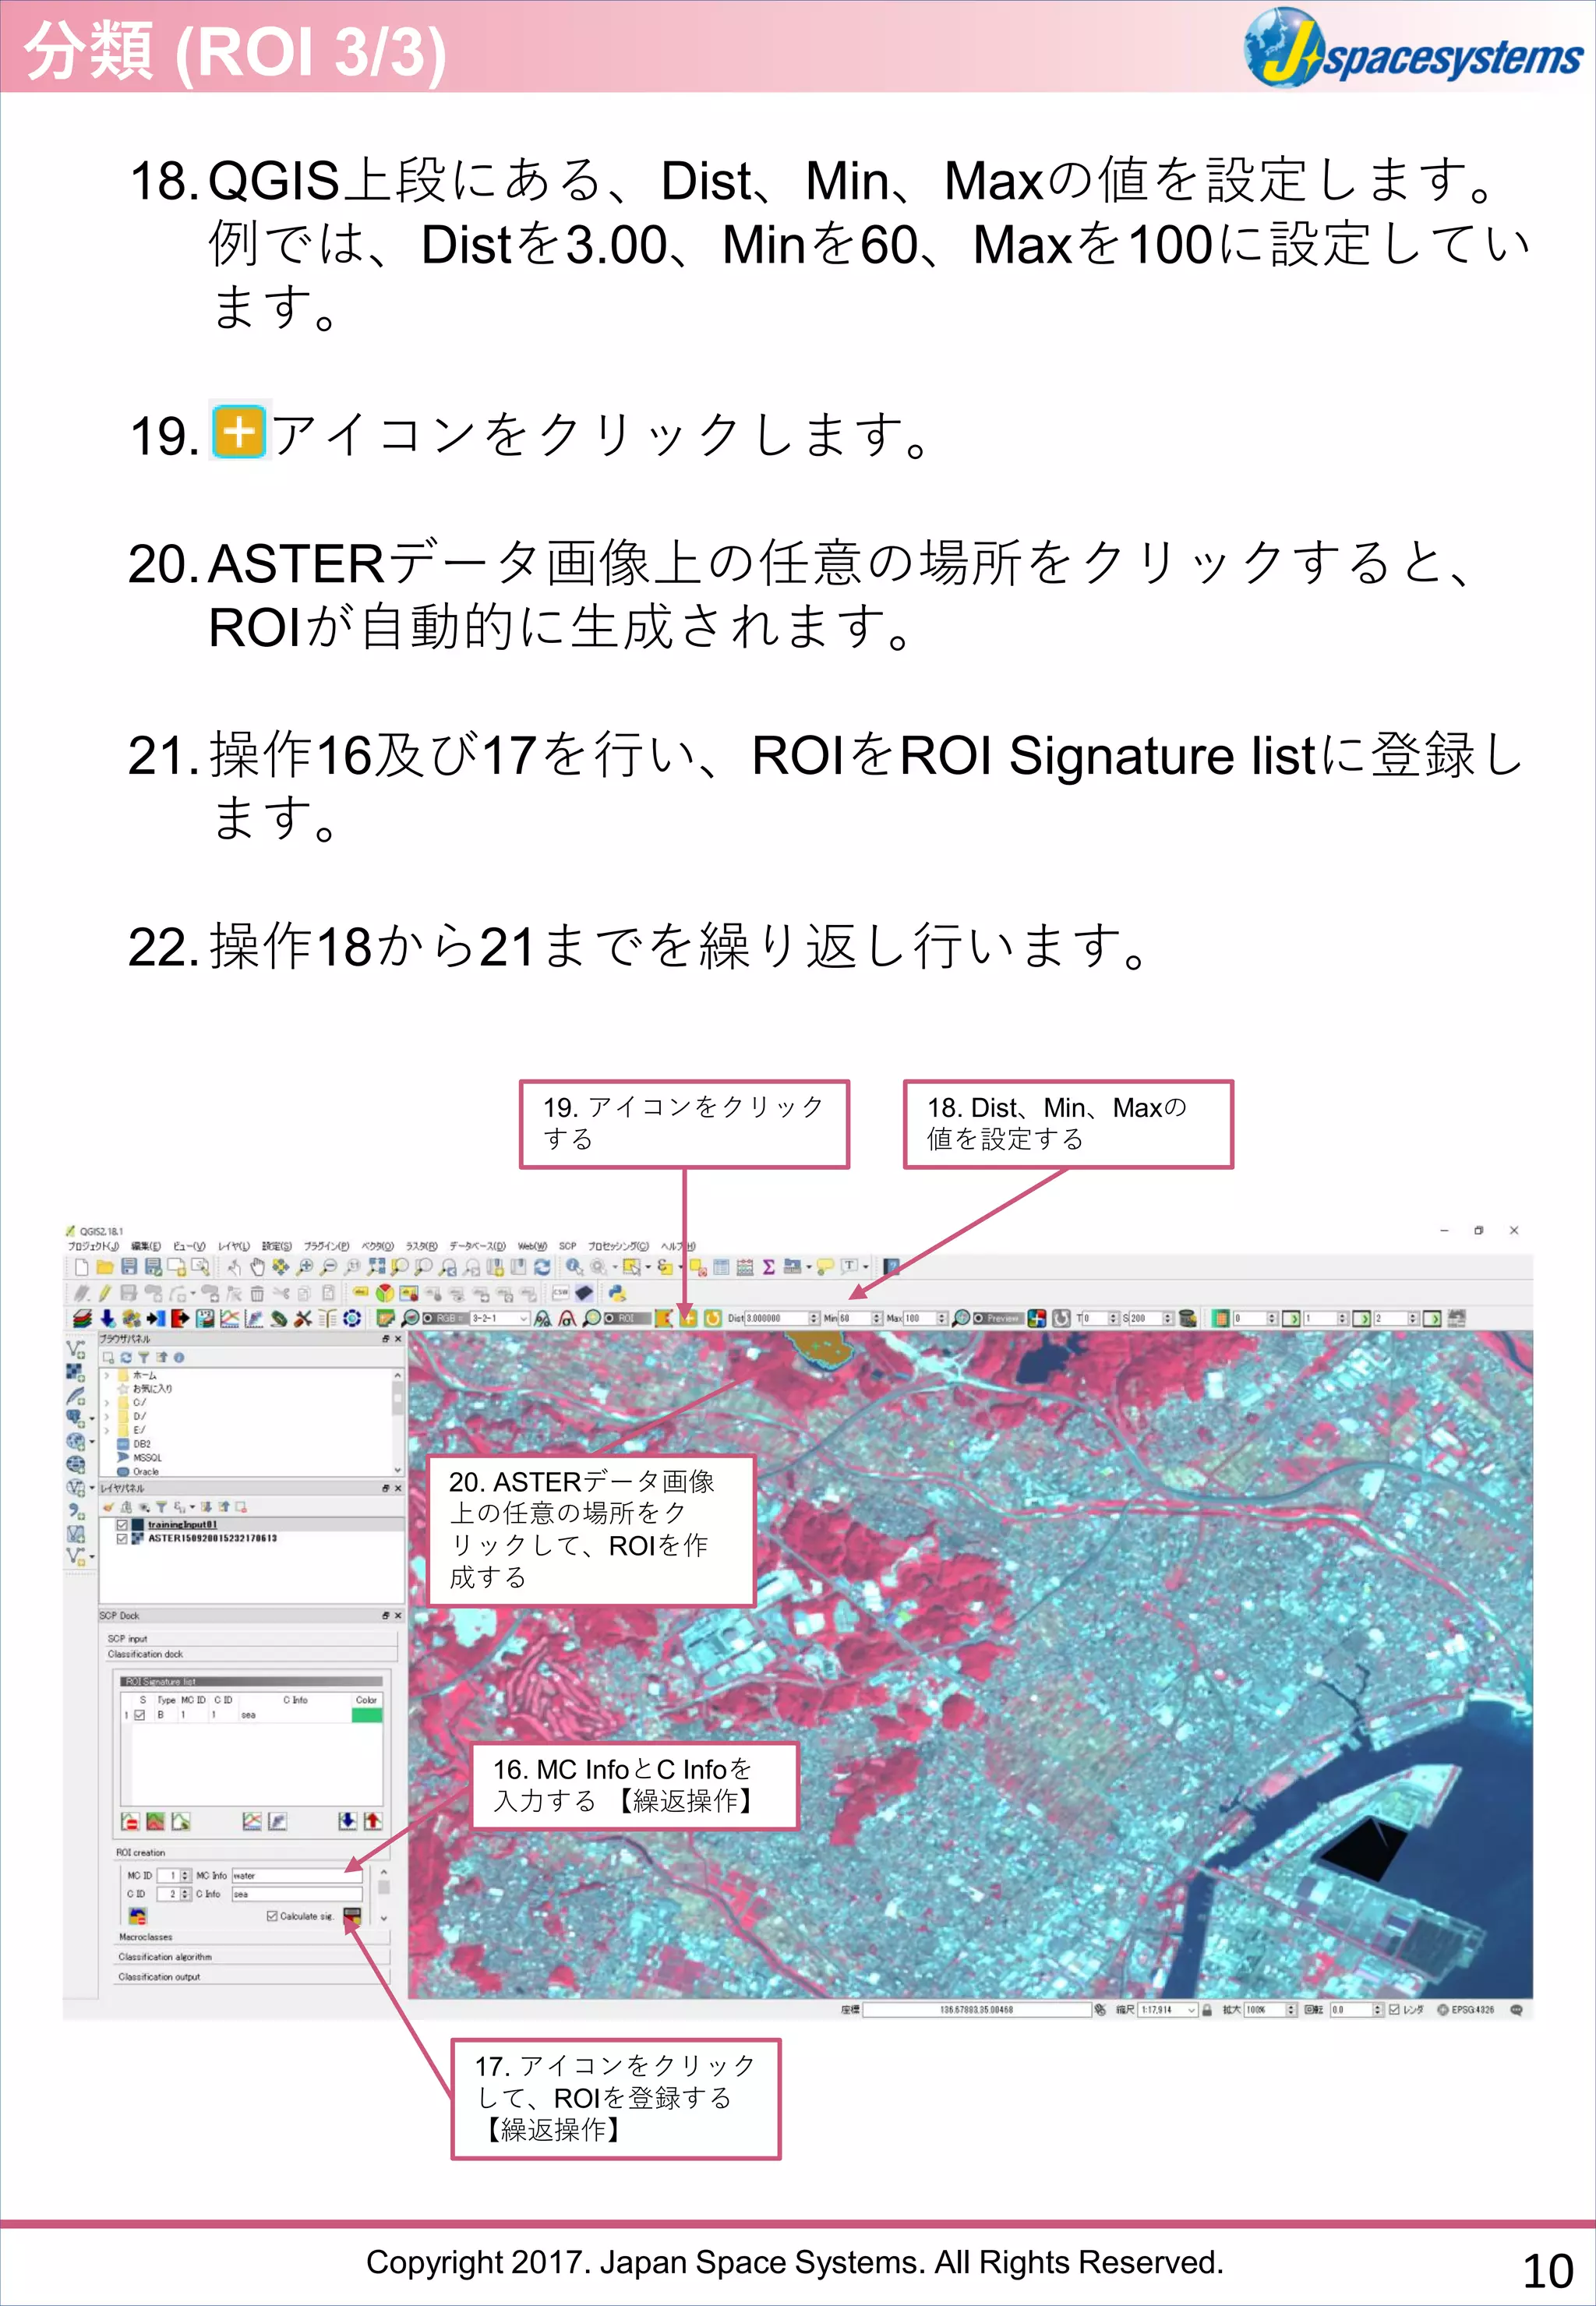
18.QGIS上段にある、Dist、Min、Maxの値を設定します。
例では、Distを3.00、Minを60、Maxを100に設定してい
ます。
19. アイコンをクリックします。
20.ASTERデータ画像上の任意の場所をクリックすると、
ROIが自動的に生成されます。
21.操作16及び17を行い、ROIをROI Signature listに登録し
ます。
22.操作18から21までを繰り返し行います。
18. Dist、Min、Maxの
値を設定する
分類 (ROI 3/3)
19. アイコンをクリック
する
20. ASTERデータ画像
上の任意の場所をク
リックして、ROIを作
成する
16. MC InfoとC Infoを
入力する 【繰返操作】
17. アイコンをクリック
して、ROIを登録する
【繰返操作】
10
- 11.
Copyright 2017. JapanSpace Systems. All Rights Reserved.
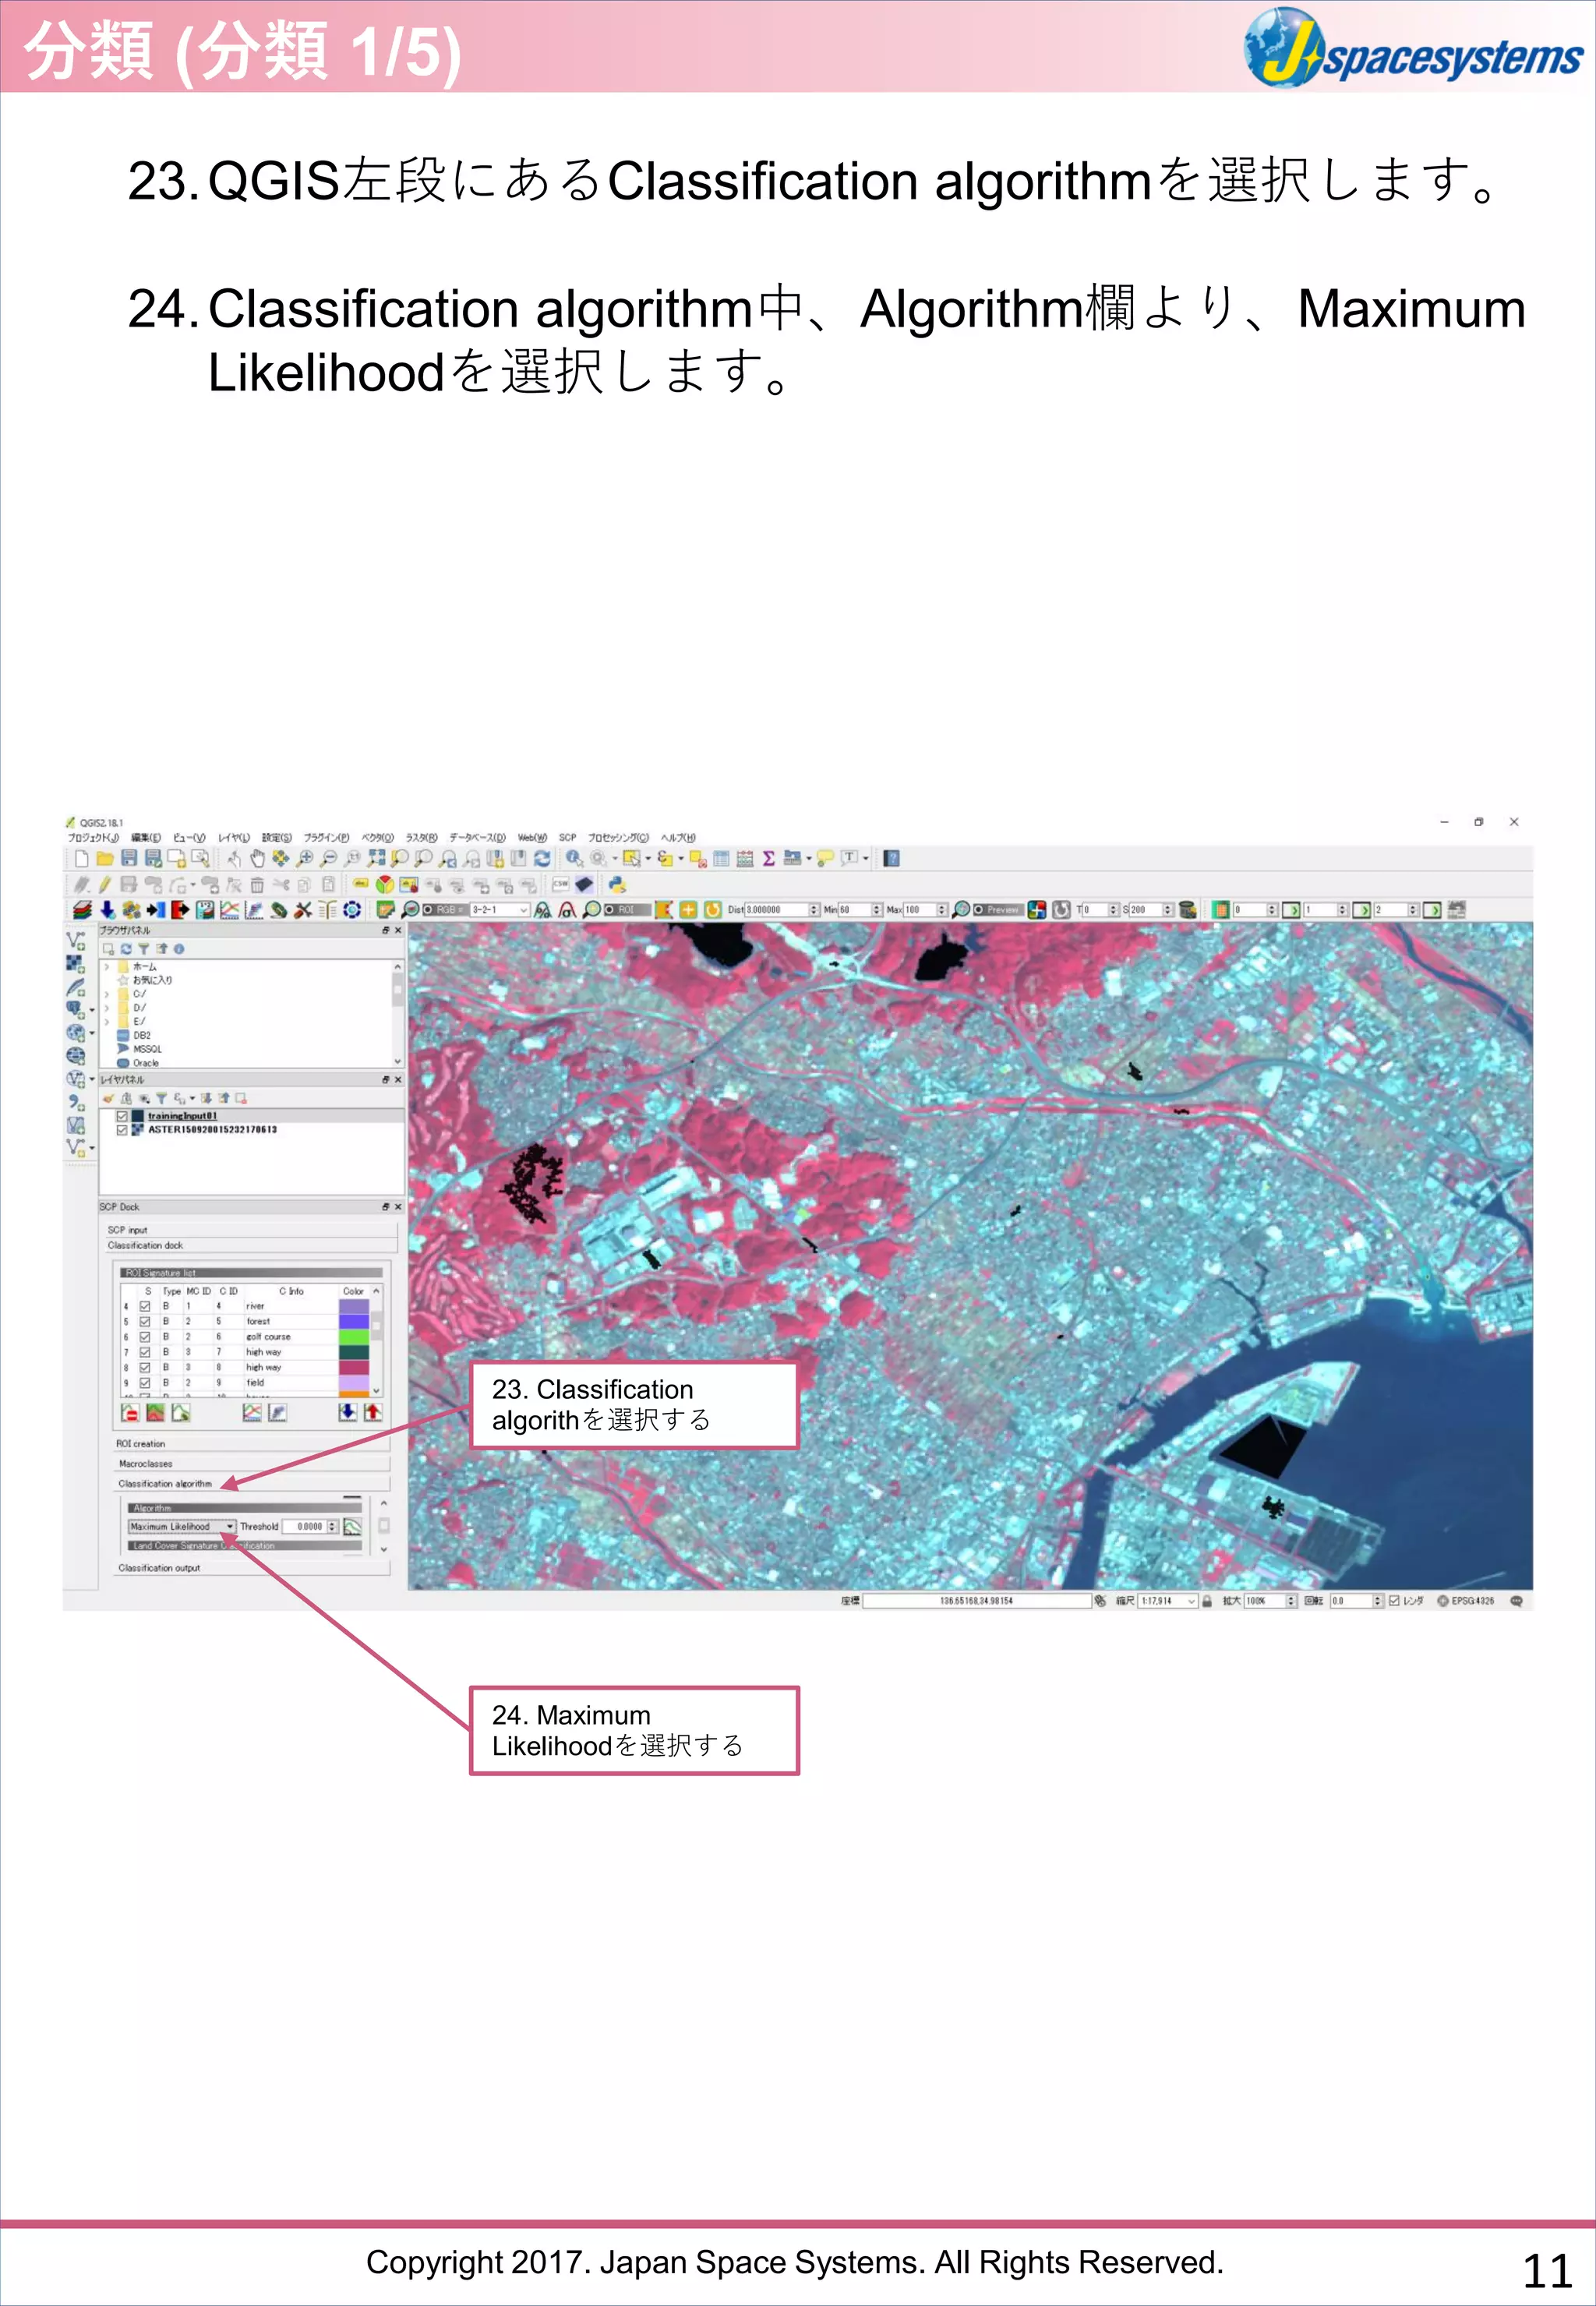
23.QGIS左段にあるClassification algorithmを選択します。
24.Classification algorithm中、Algorithm欄より、Maximum
Likelihoodを選択します。
23. Classification
algorithを選択する
分類 (分類 1/5)
24. Maximum
Likelihoodを選択する
11
- 12.
Copyright 2017. JapanSpace Systems. All Rights Reserved.
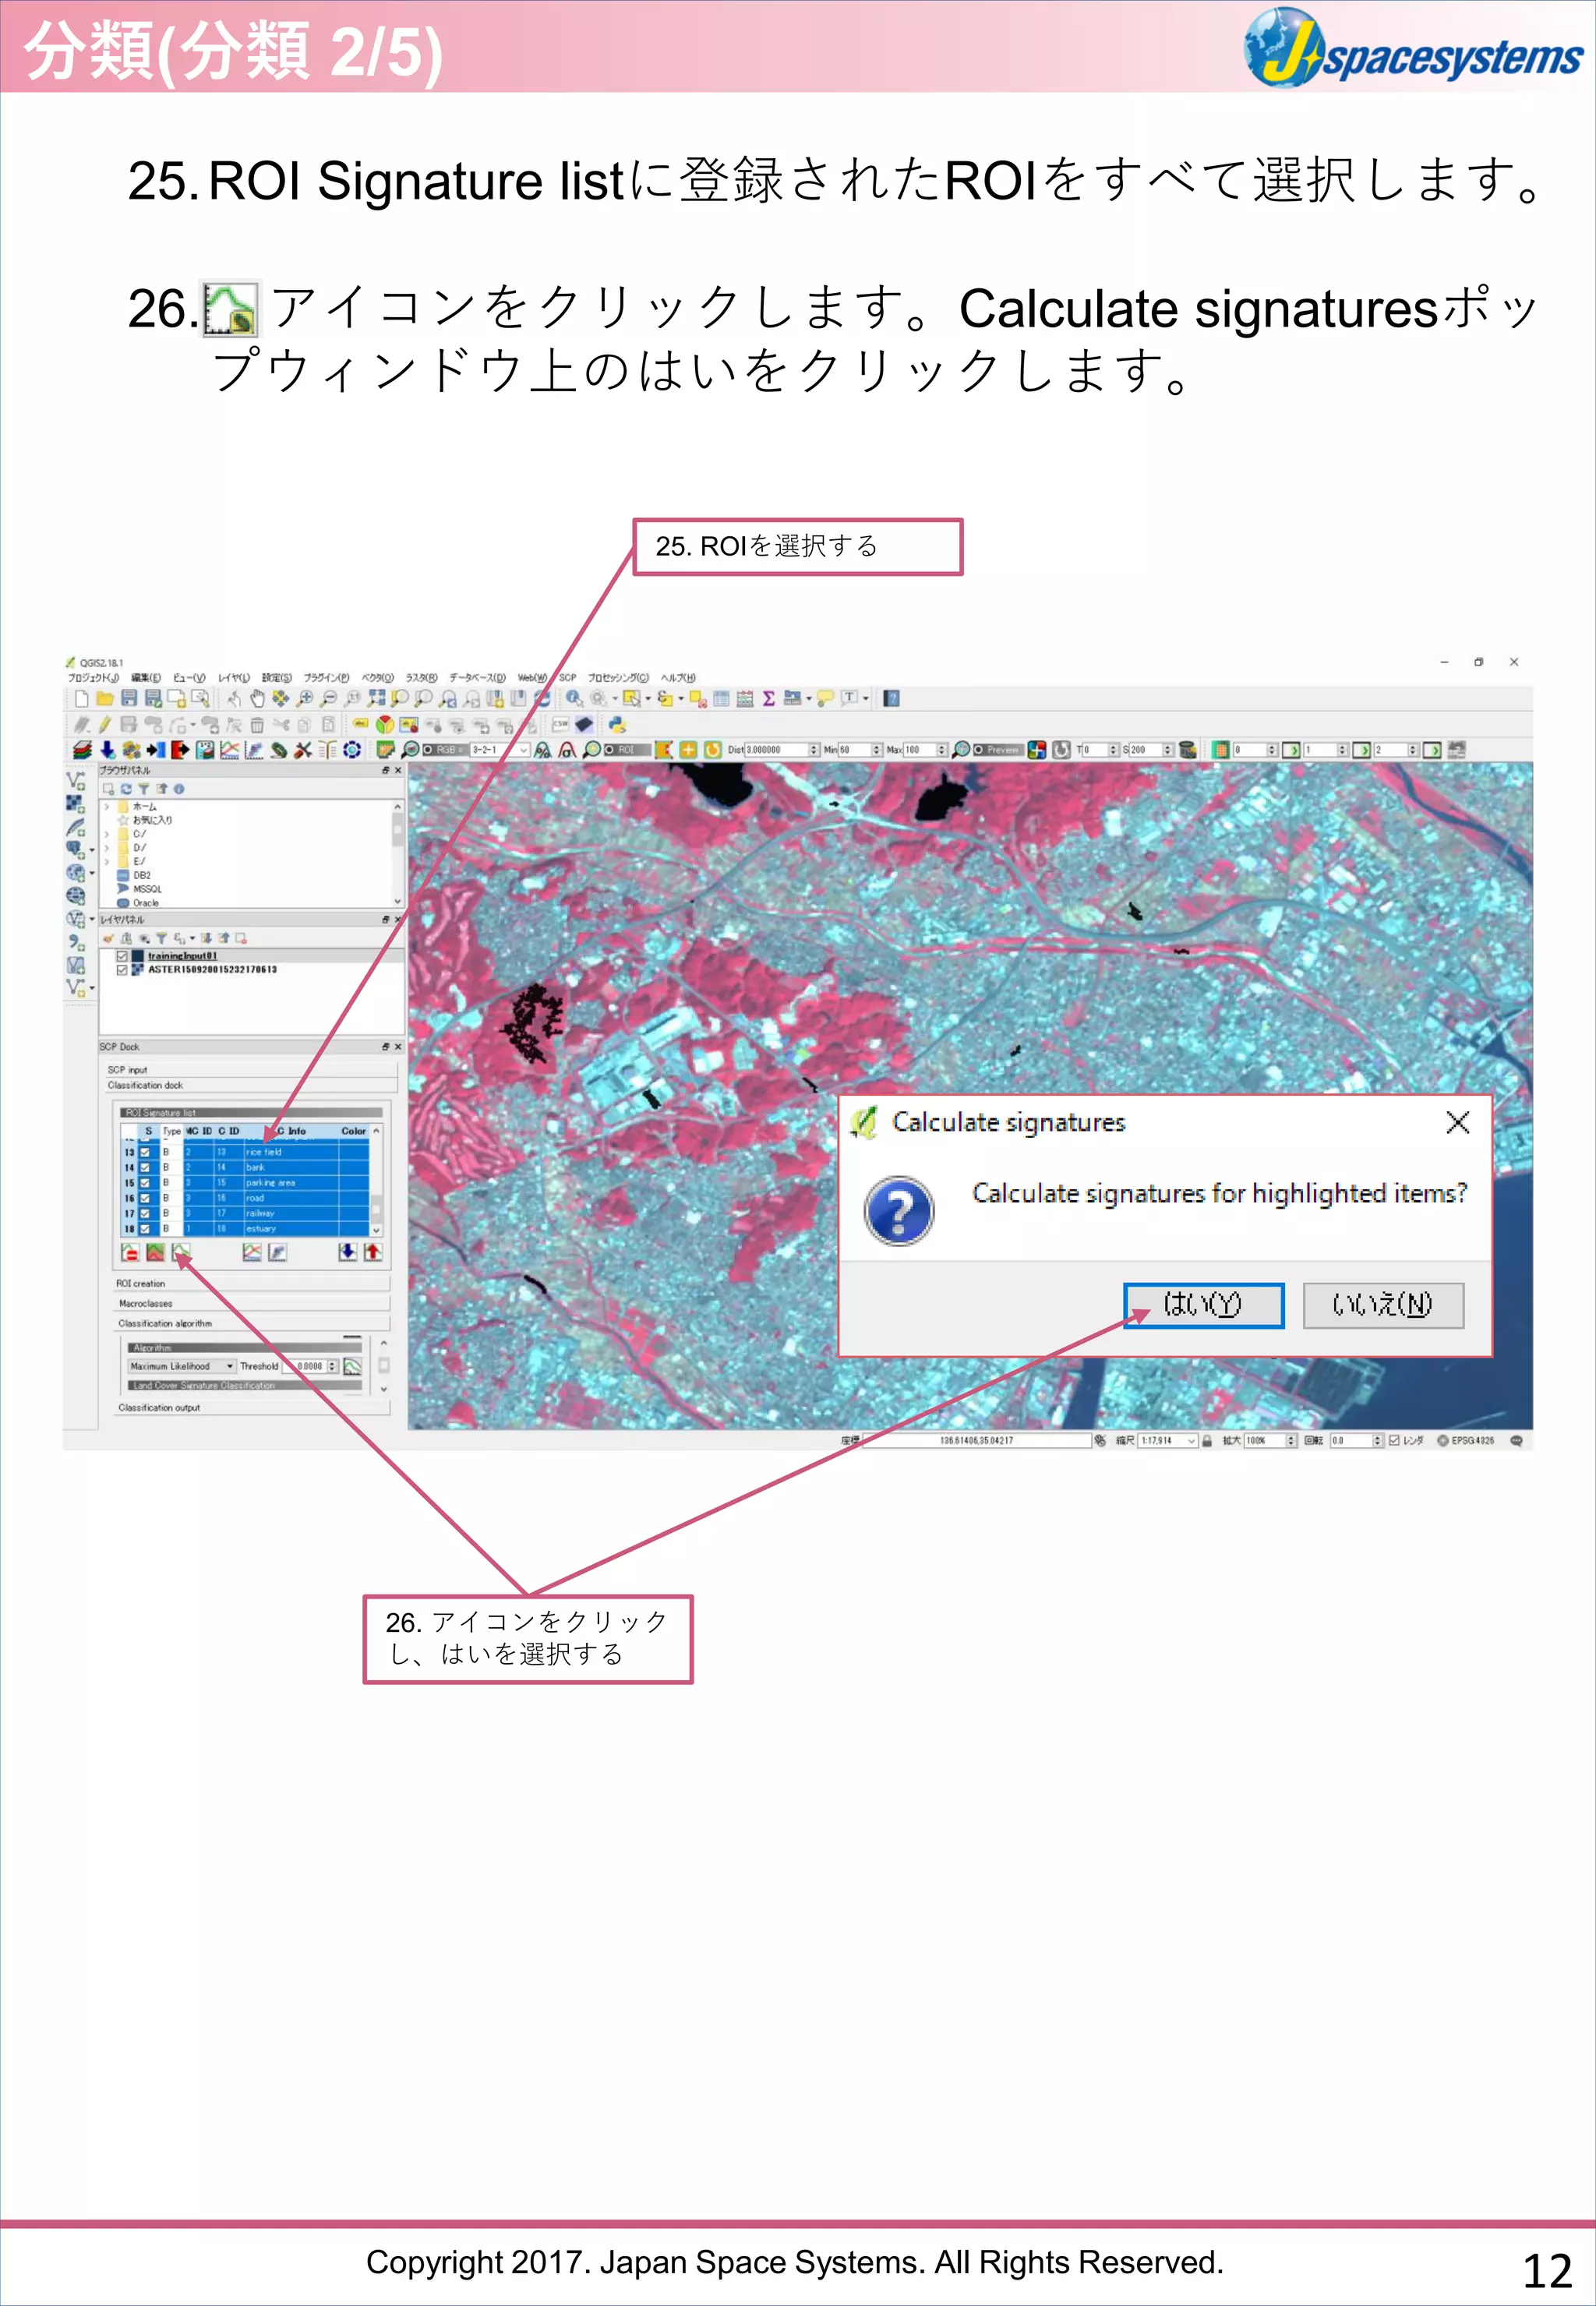
25.ROI Signature listに登録されたROIをすべて選択します。
26. アイコンをクリックします。Calculate signaturesポッ
プウィンドウ上のはいをクリックします。
25. ROIを選択する
分類(分類 2/5)
26. アイコンをクリック
し、はいを選択する
12
- 13.
Copyright 2017. JapanSpace Systems. All Rights Reserved.
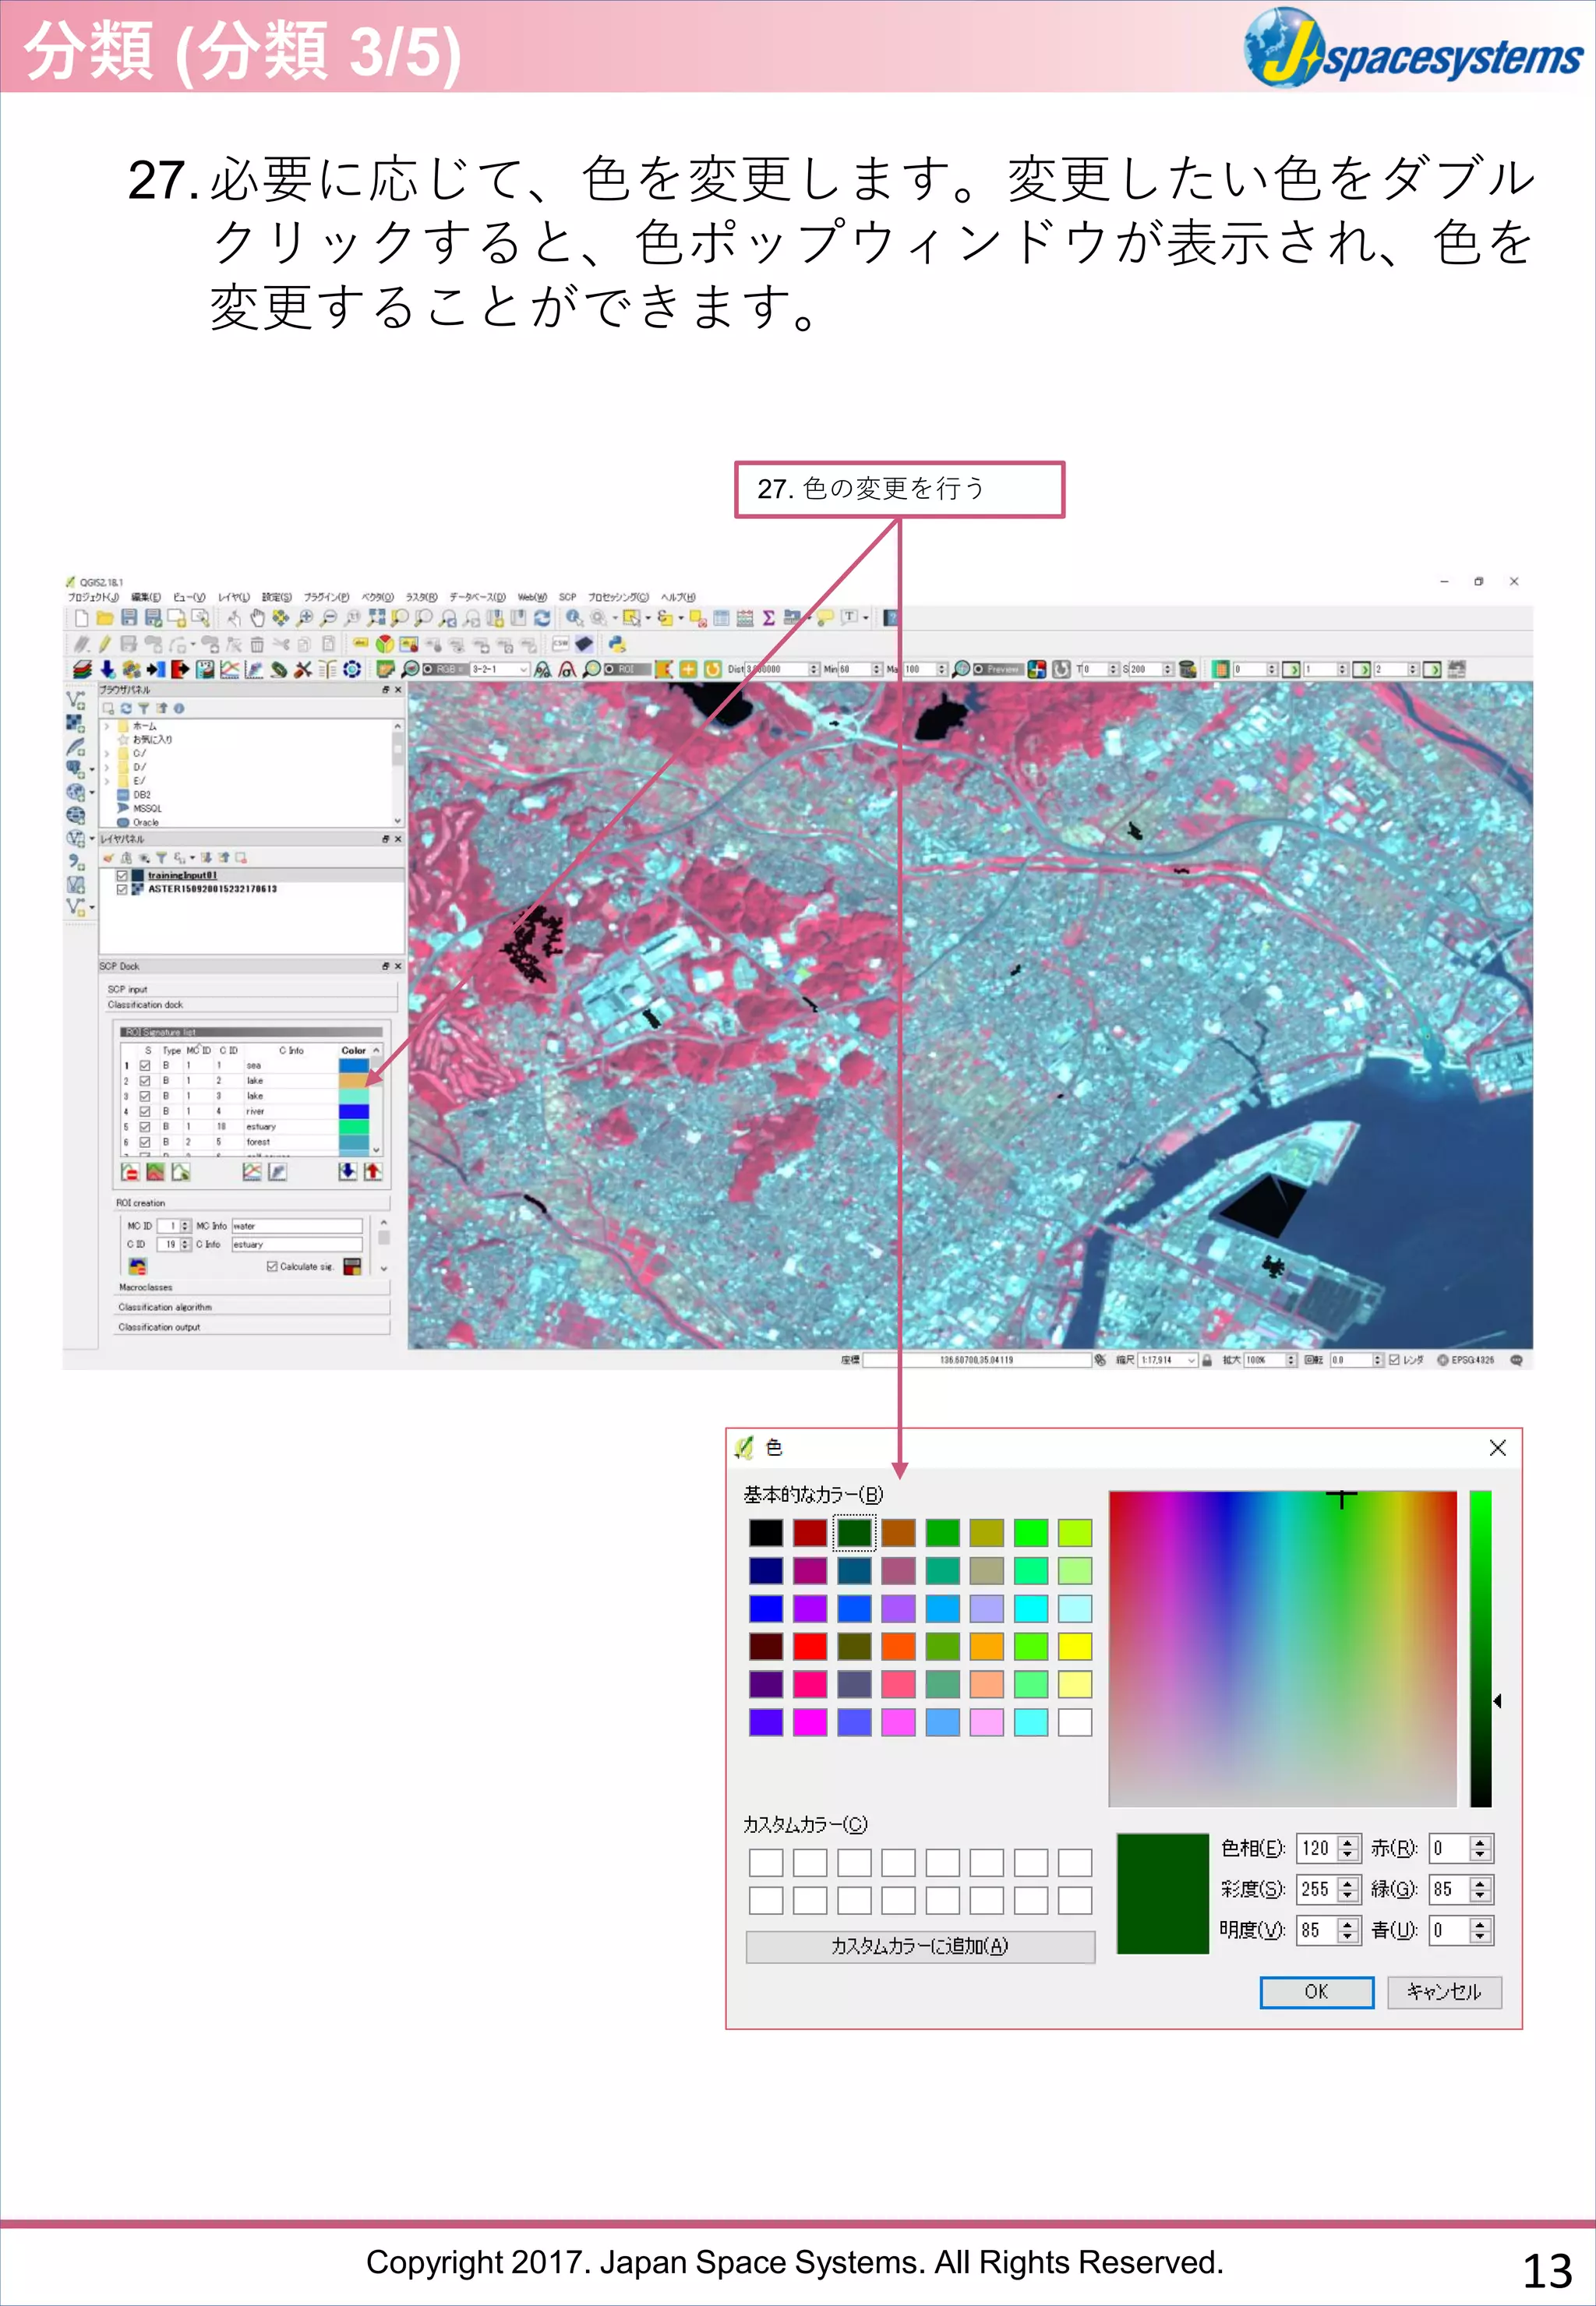
27.必要に応じて、色を変更します。変更したい色をダブル
クリックすると、色ポップウィンドウが表示され、色を
変更することができます。
27. 色の変更を行う
分類 (分類 3/5)
13
- 14.
Copyright 2017. JapanSpace Systems. All Rights Reserved.
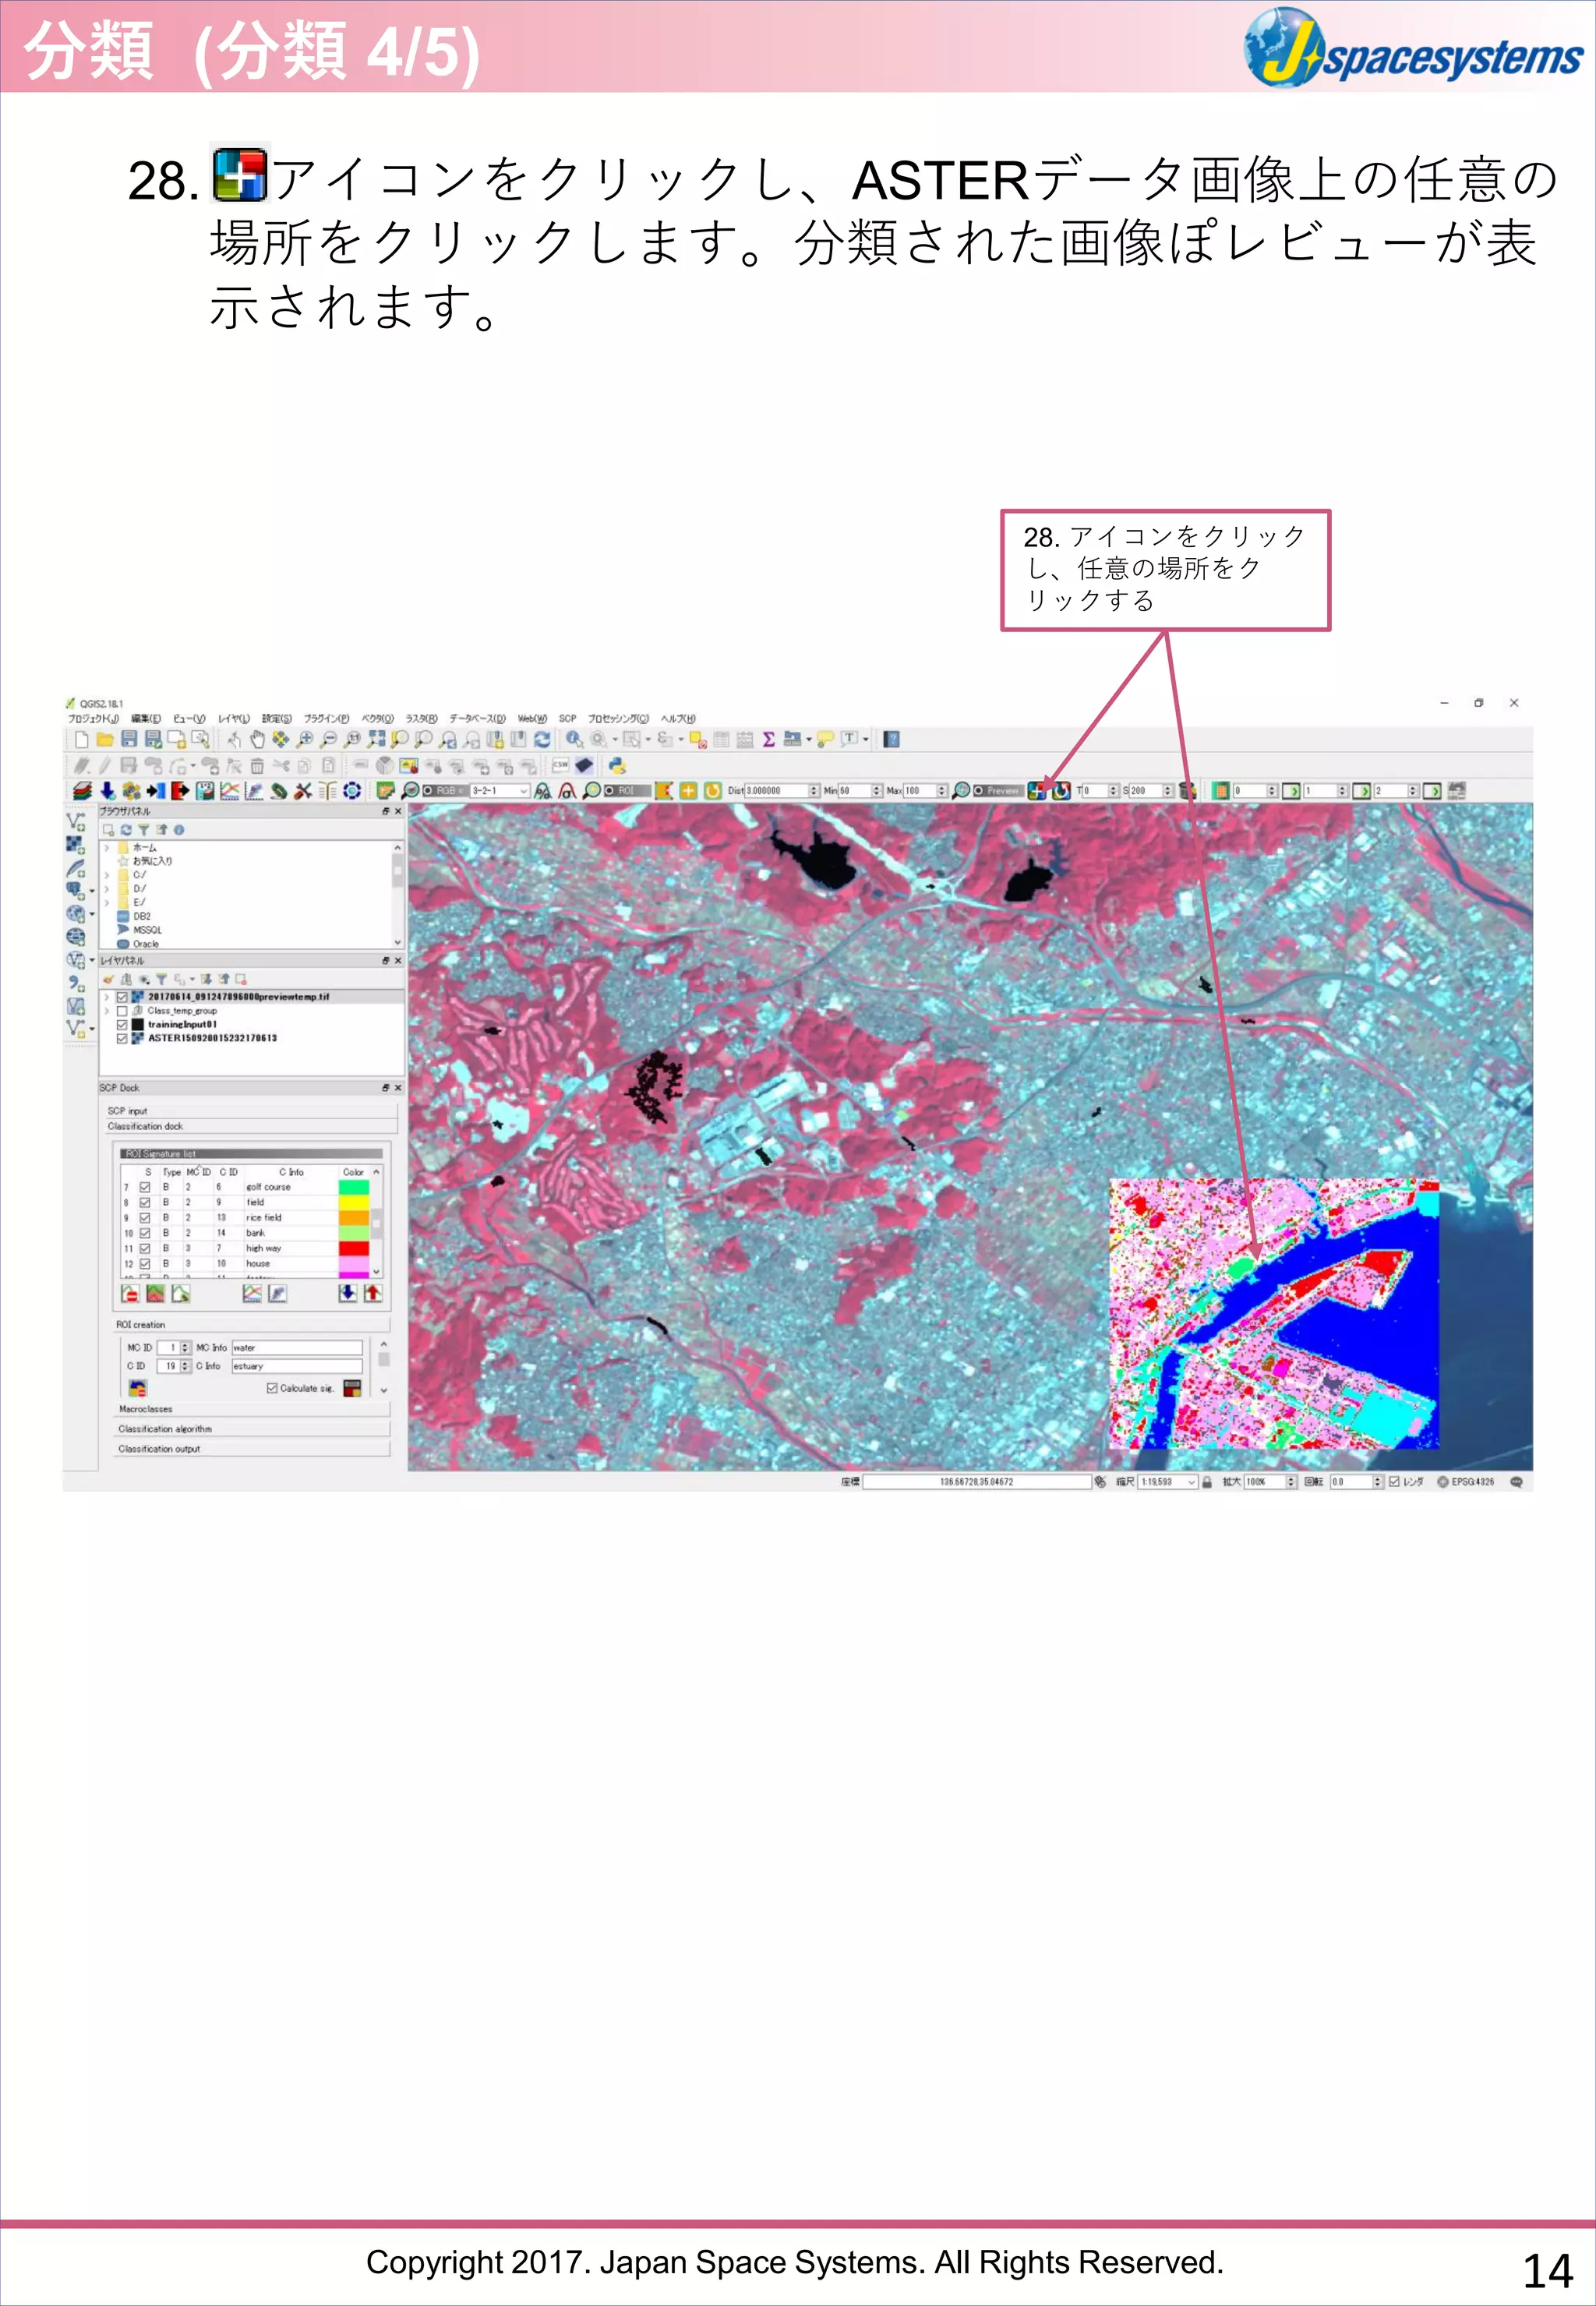
28. アイコンをクリックし、ASTERデータ画像上の任意の
場所をクリックします。分類された画像ぽレビューが表
示されます。
28. アイコンをクリック
し、任意の場所をク
リックする
分類 (分類 4/5)
14
- 15.
Copyright 2017. JapanSpace Systems. All Rights Reserved.
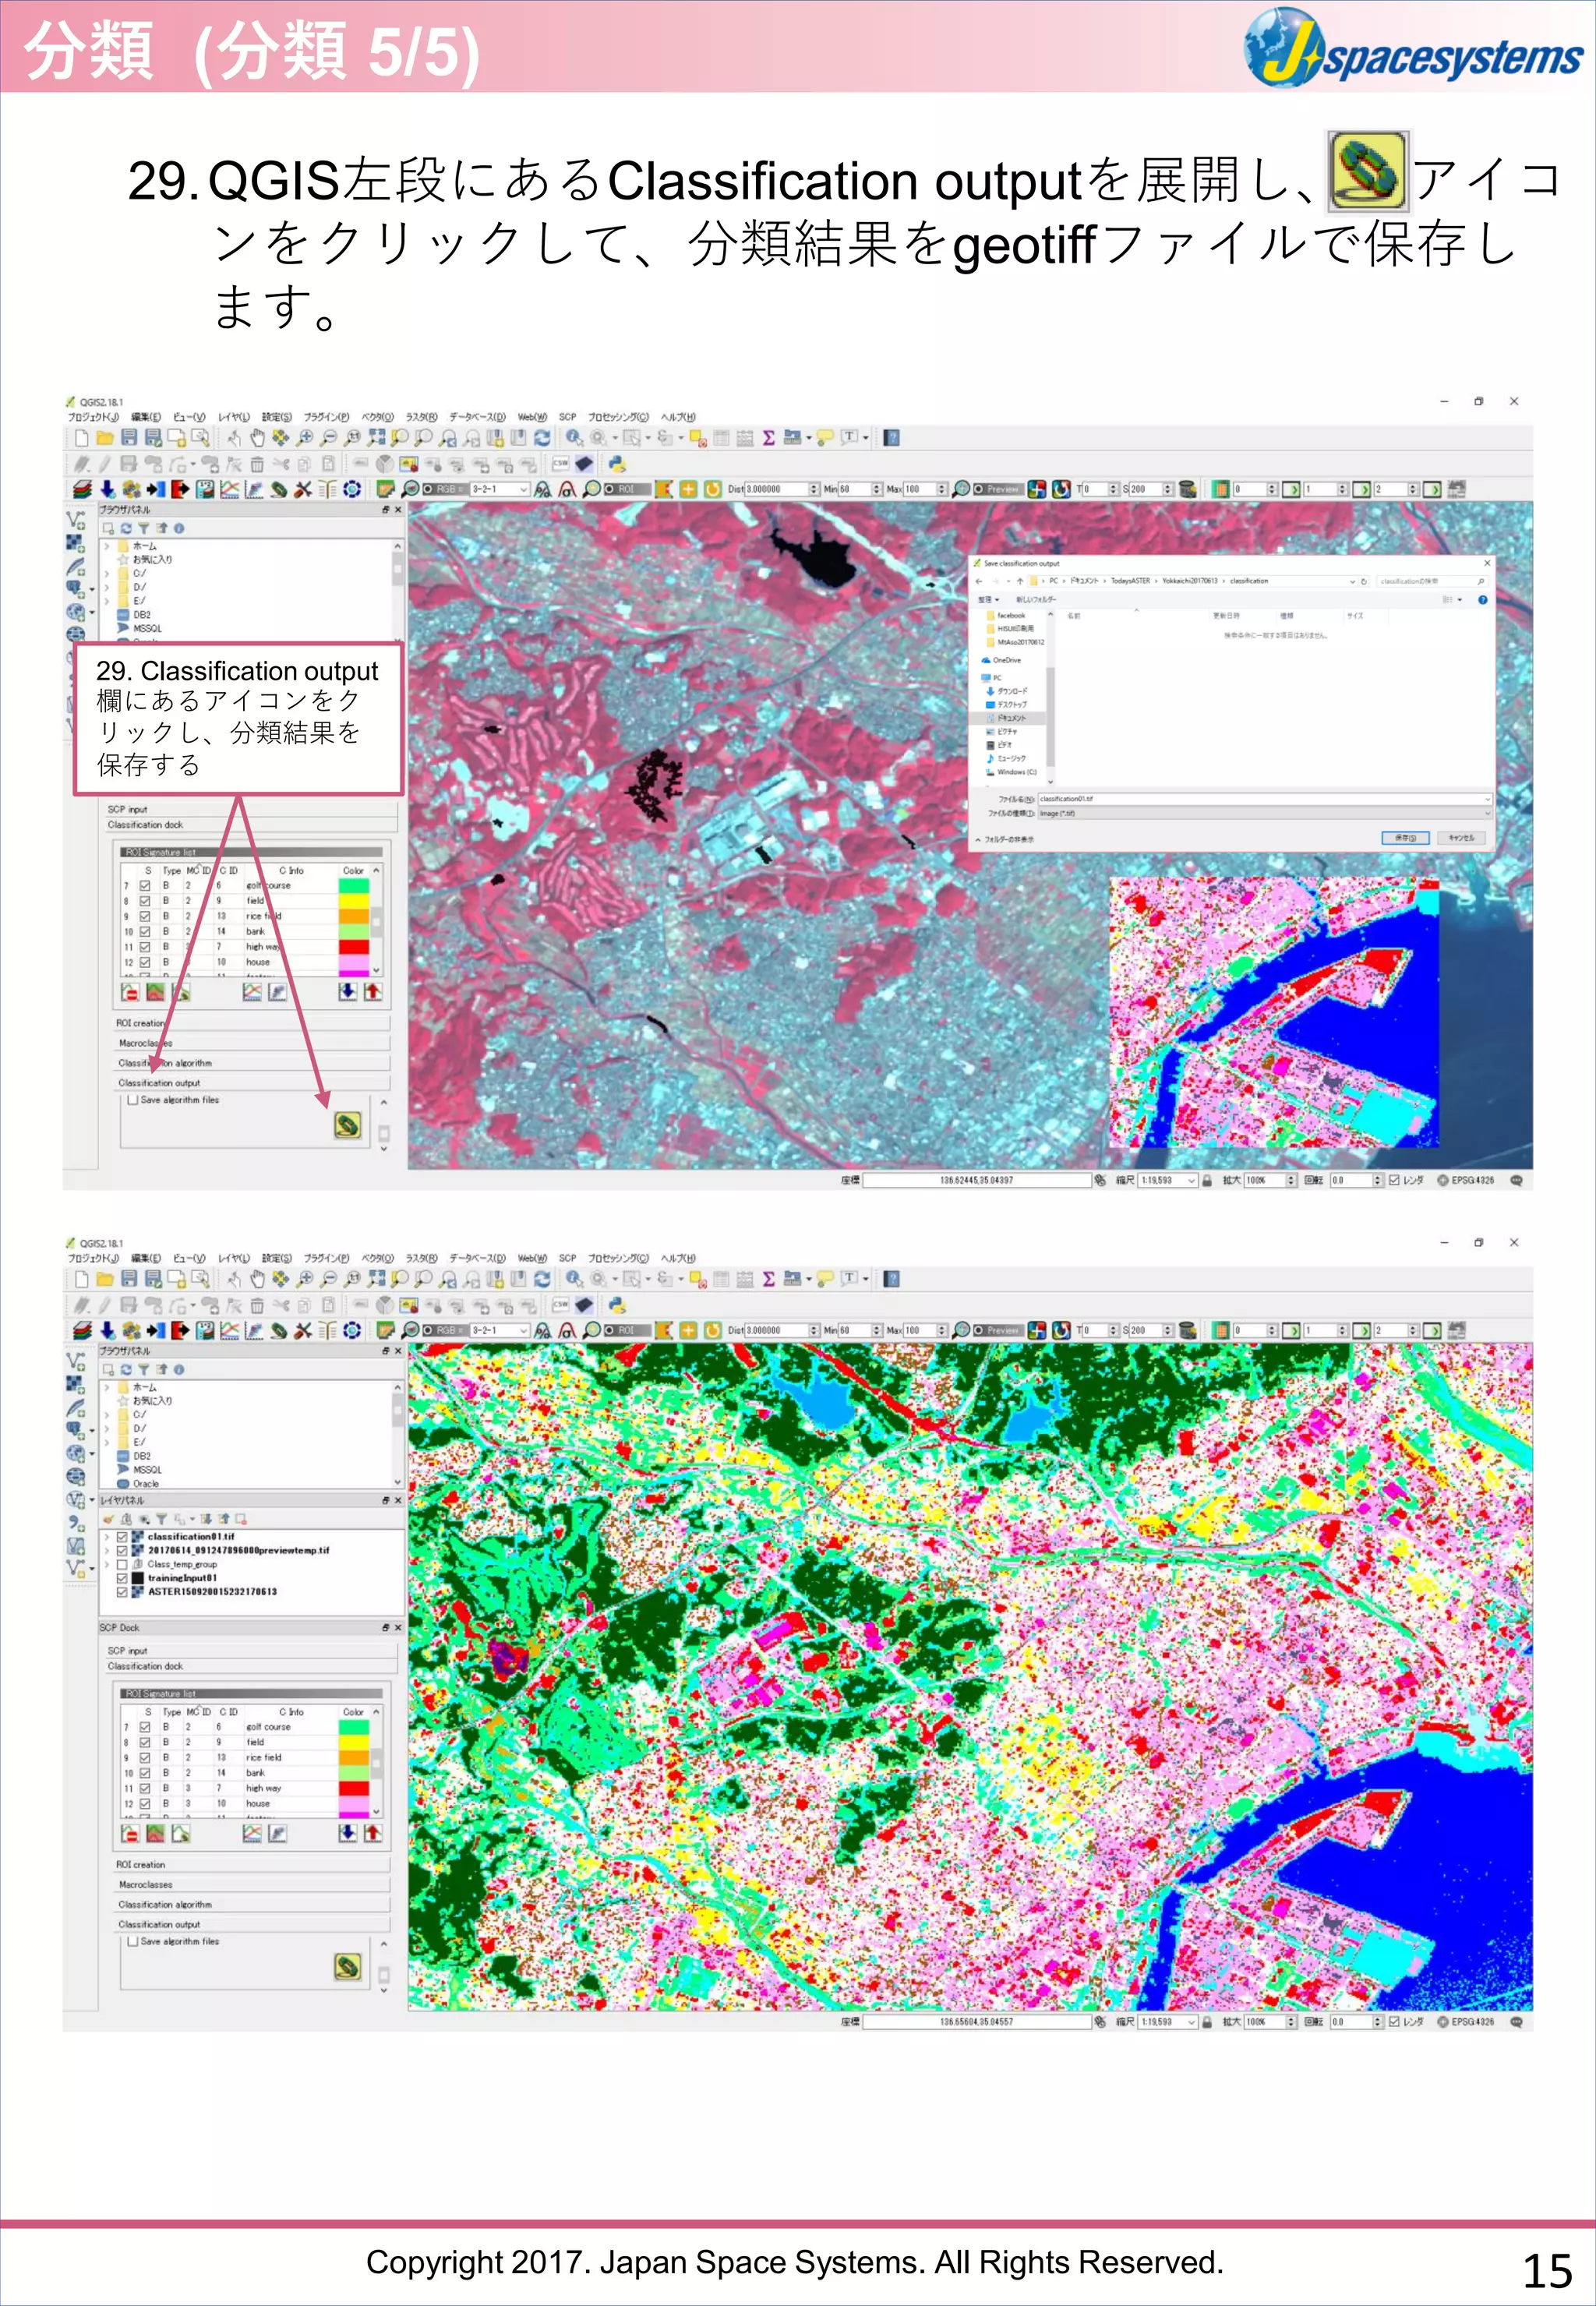
29.QGIS左段にあるClassification outputを展開し、 アイコ
ンをクリックして、分類結果をgeotiffファイルで保存し
ます。
29. Classification output
欄にあるアイコンをク
リックし、分類結果を
保存する
分類 (分類 5/5)
15
- 16.
Copyright 2017. JapanSpace Systems. All Rights Reserved.
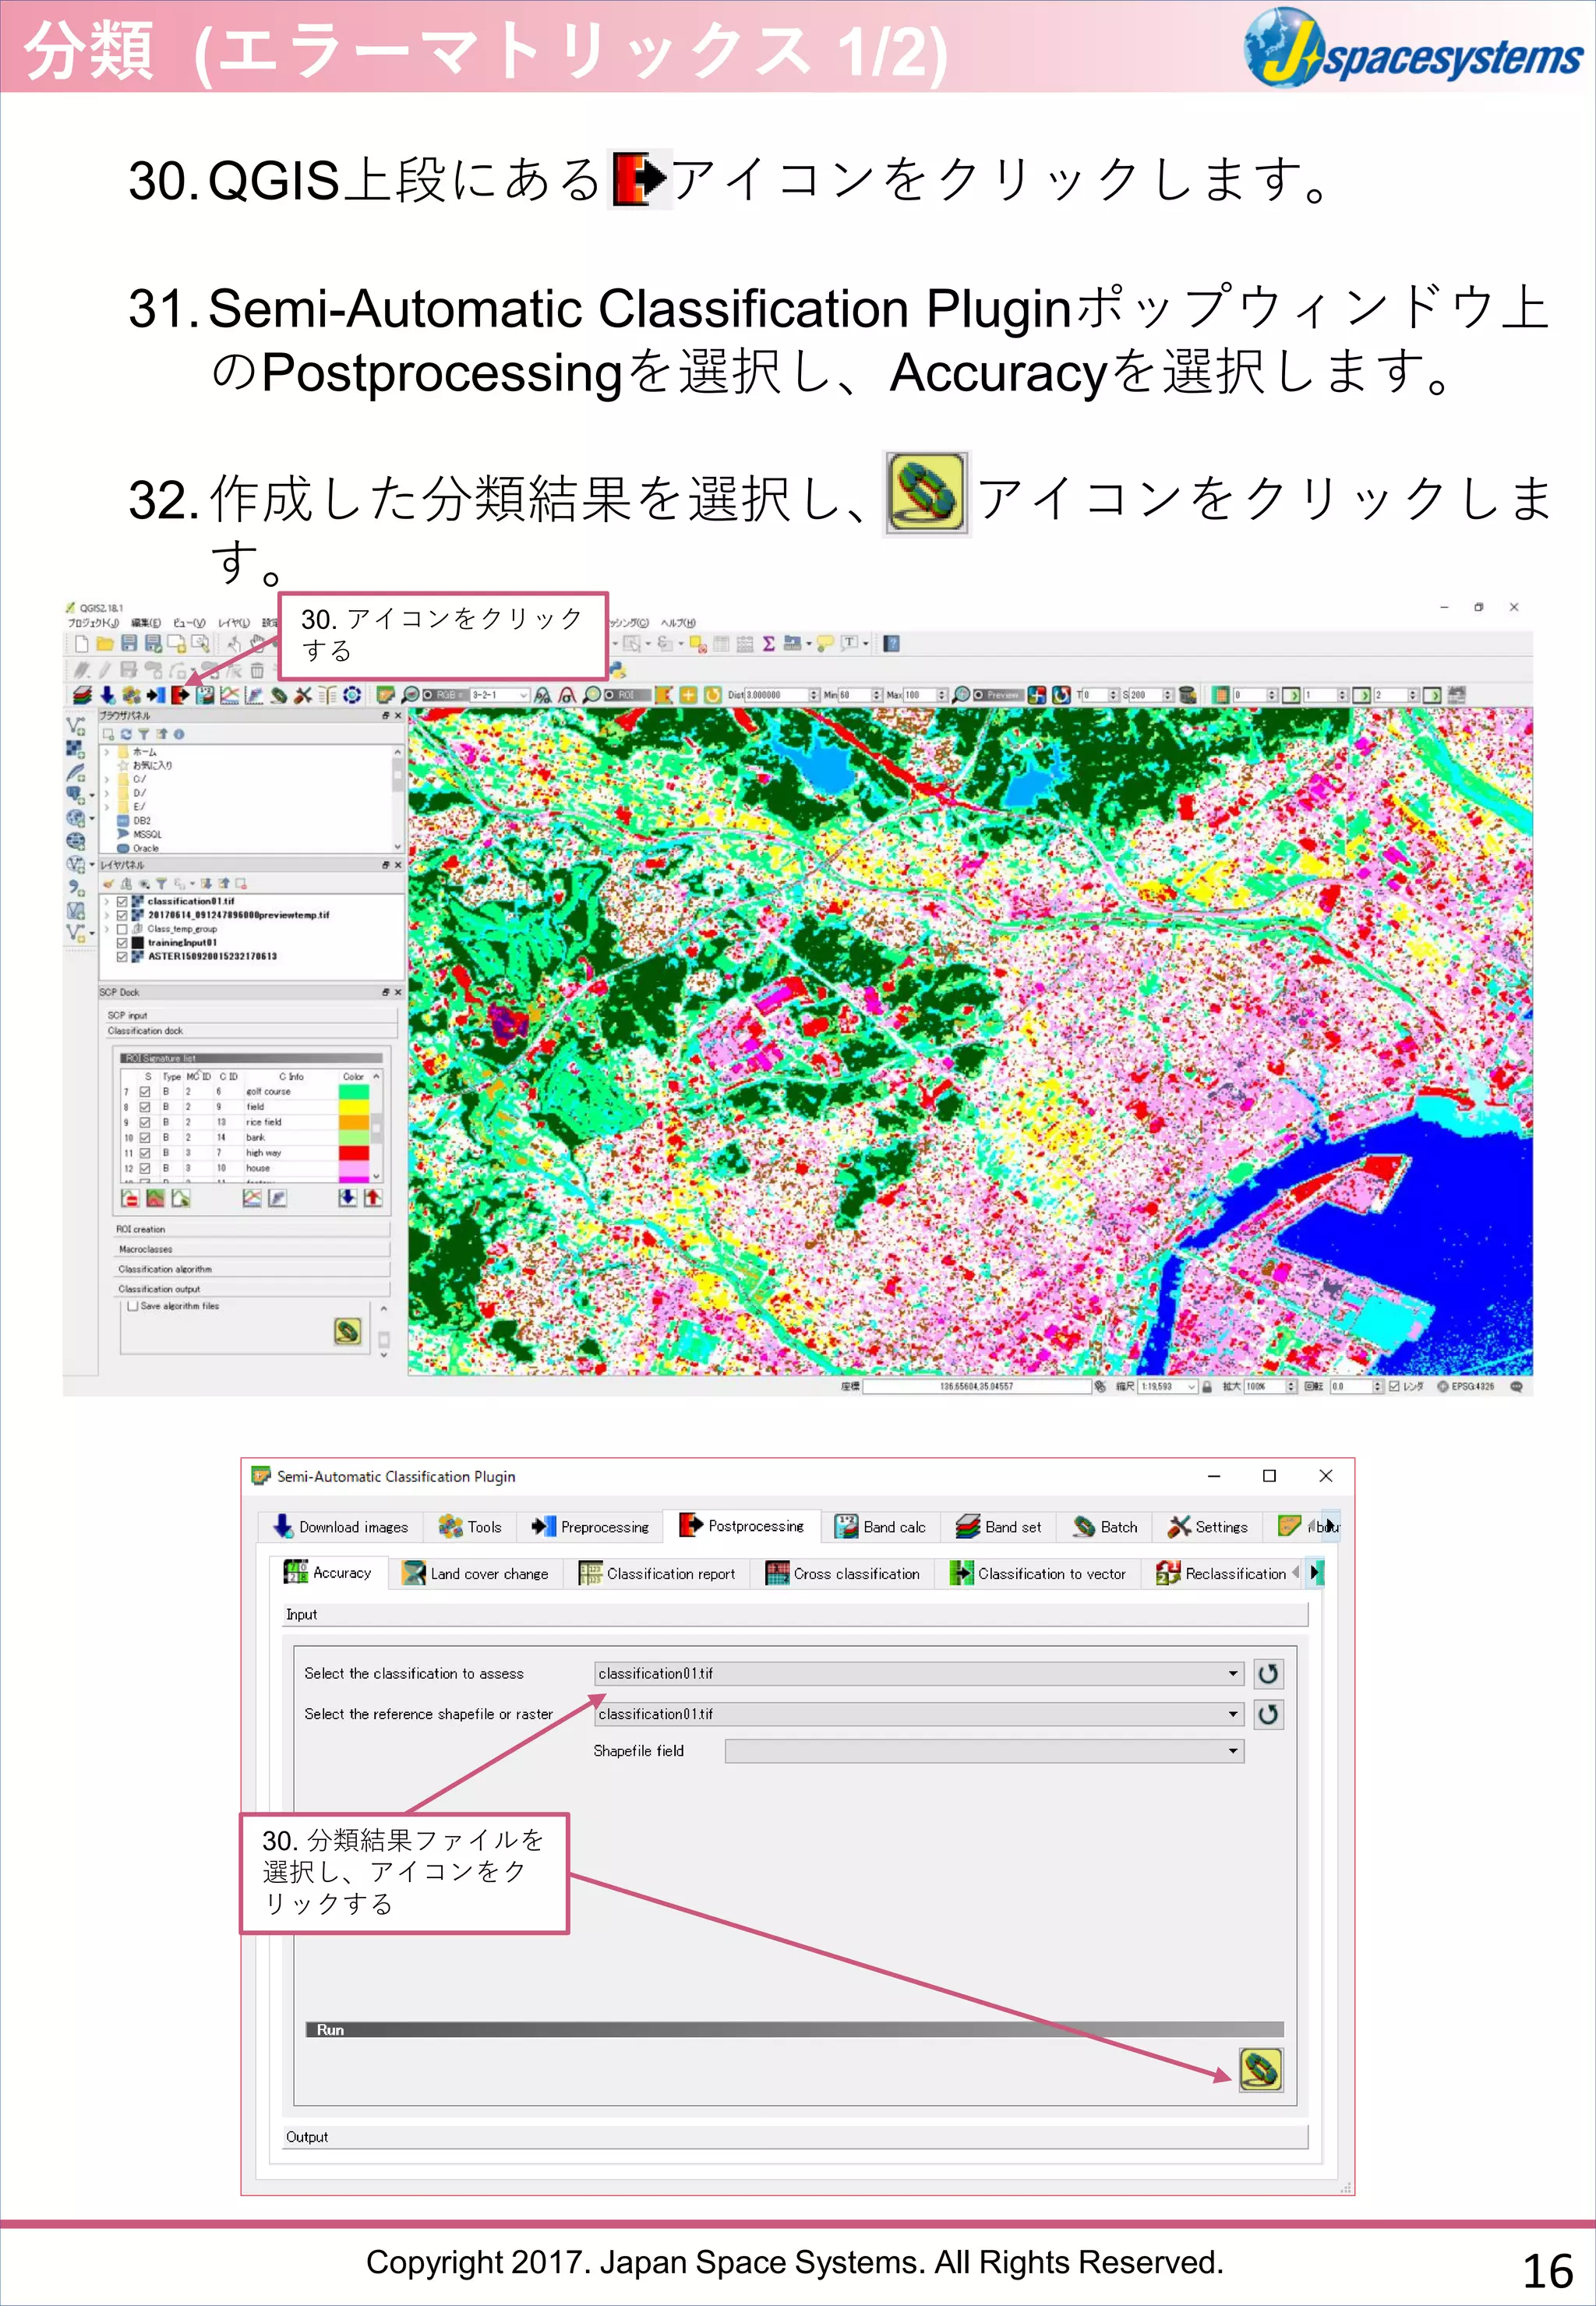
30.QGIS上段にある アイコンをクリックします。
31.Semi-Automatic Classification Pluginポップウィンドウ上
のPostprocessingを選択し、Accuracyを選択します。
32.作成した分類結果を選択し、 アイコンをクリックしま
す。
分類 (エラーマトリックス 1/2)
30. アイコンをクリック
する
30. 分類結果ファイルを
選択し、アイコンをク
リックする
16
- 17.
Copyright 2017. JapanSpace Systems. All Rights Reserved.
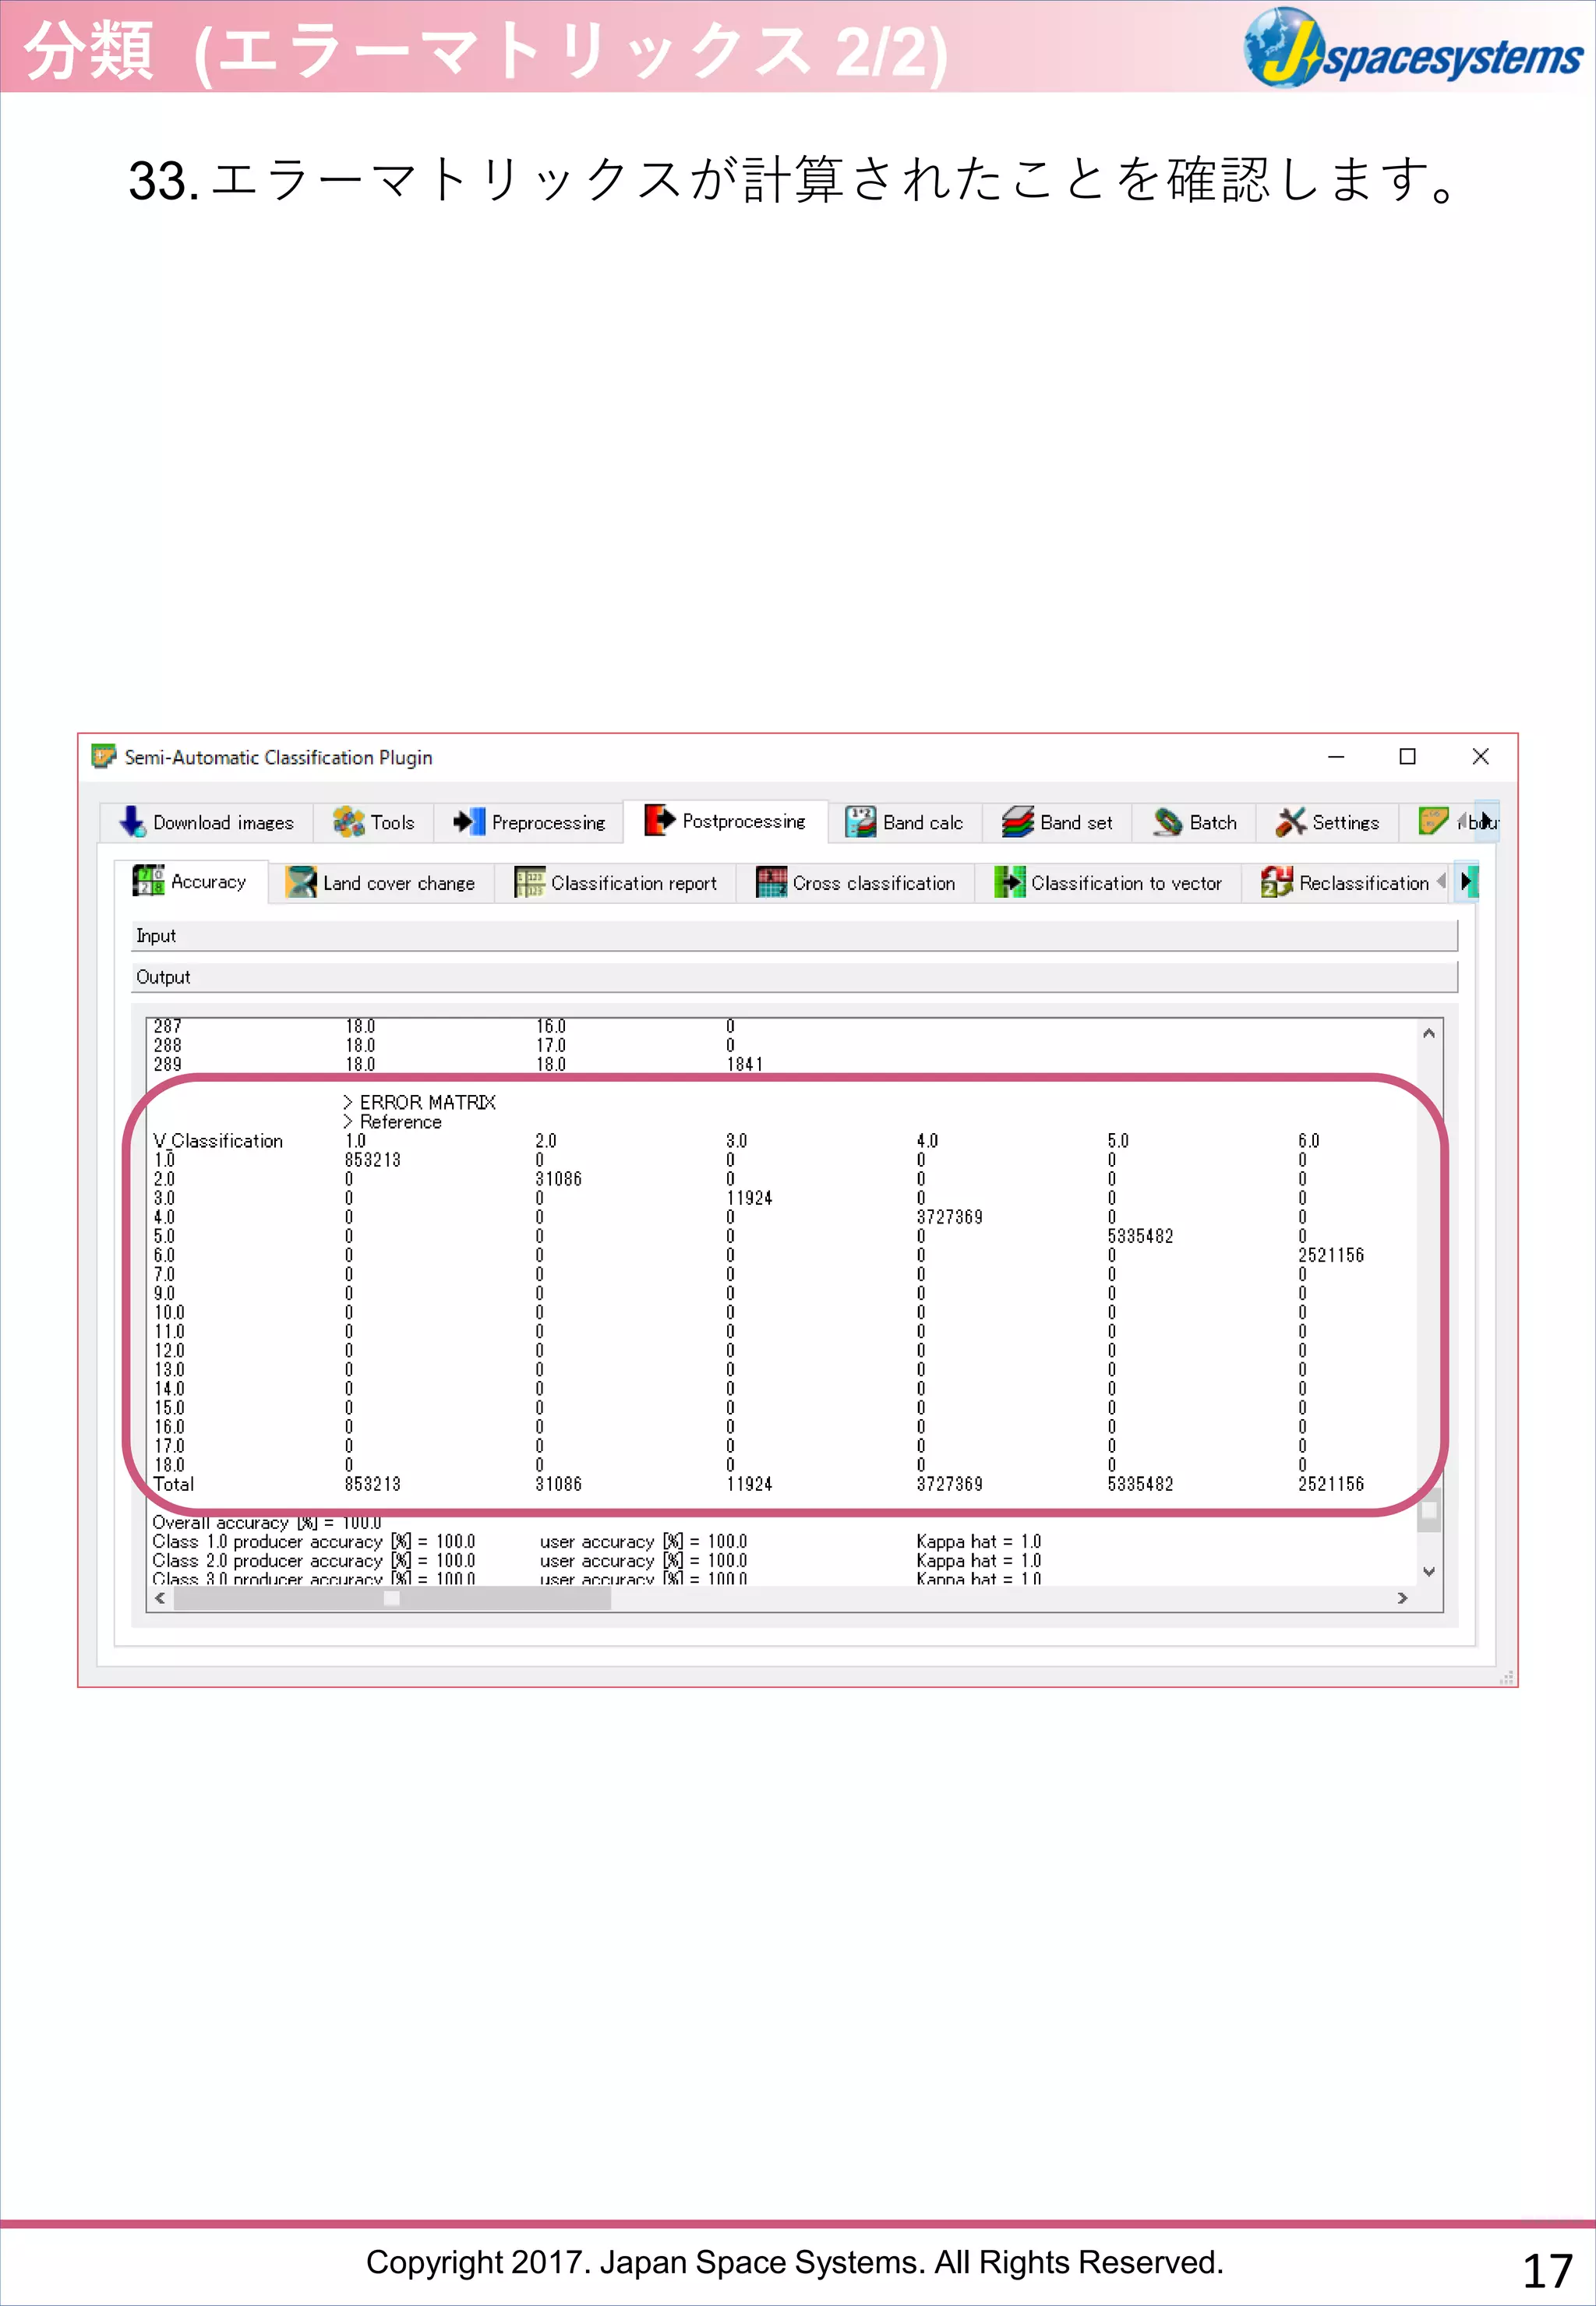
33.エラーマトリックスが計算されたことを確認します。
分類 (エラーマトリックス 2/2)
17
- 18.
Copyright 2017. JapanSpace Systems. All Rights Reserved.
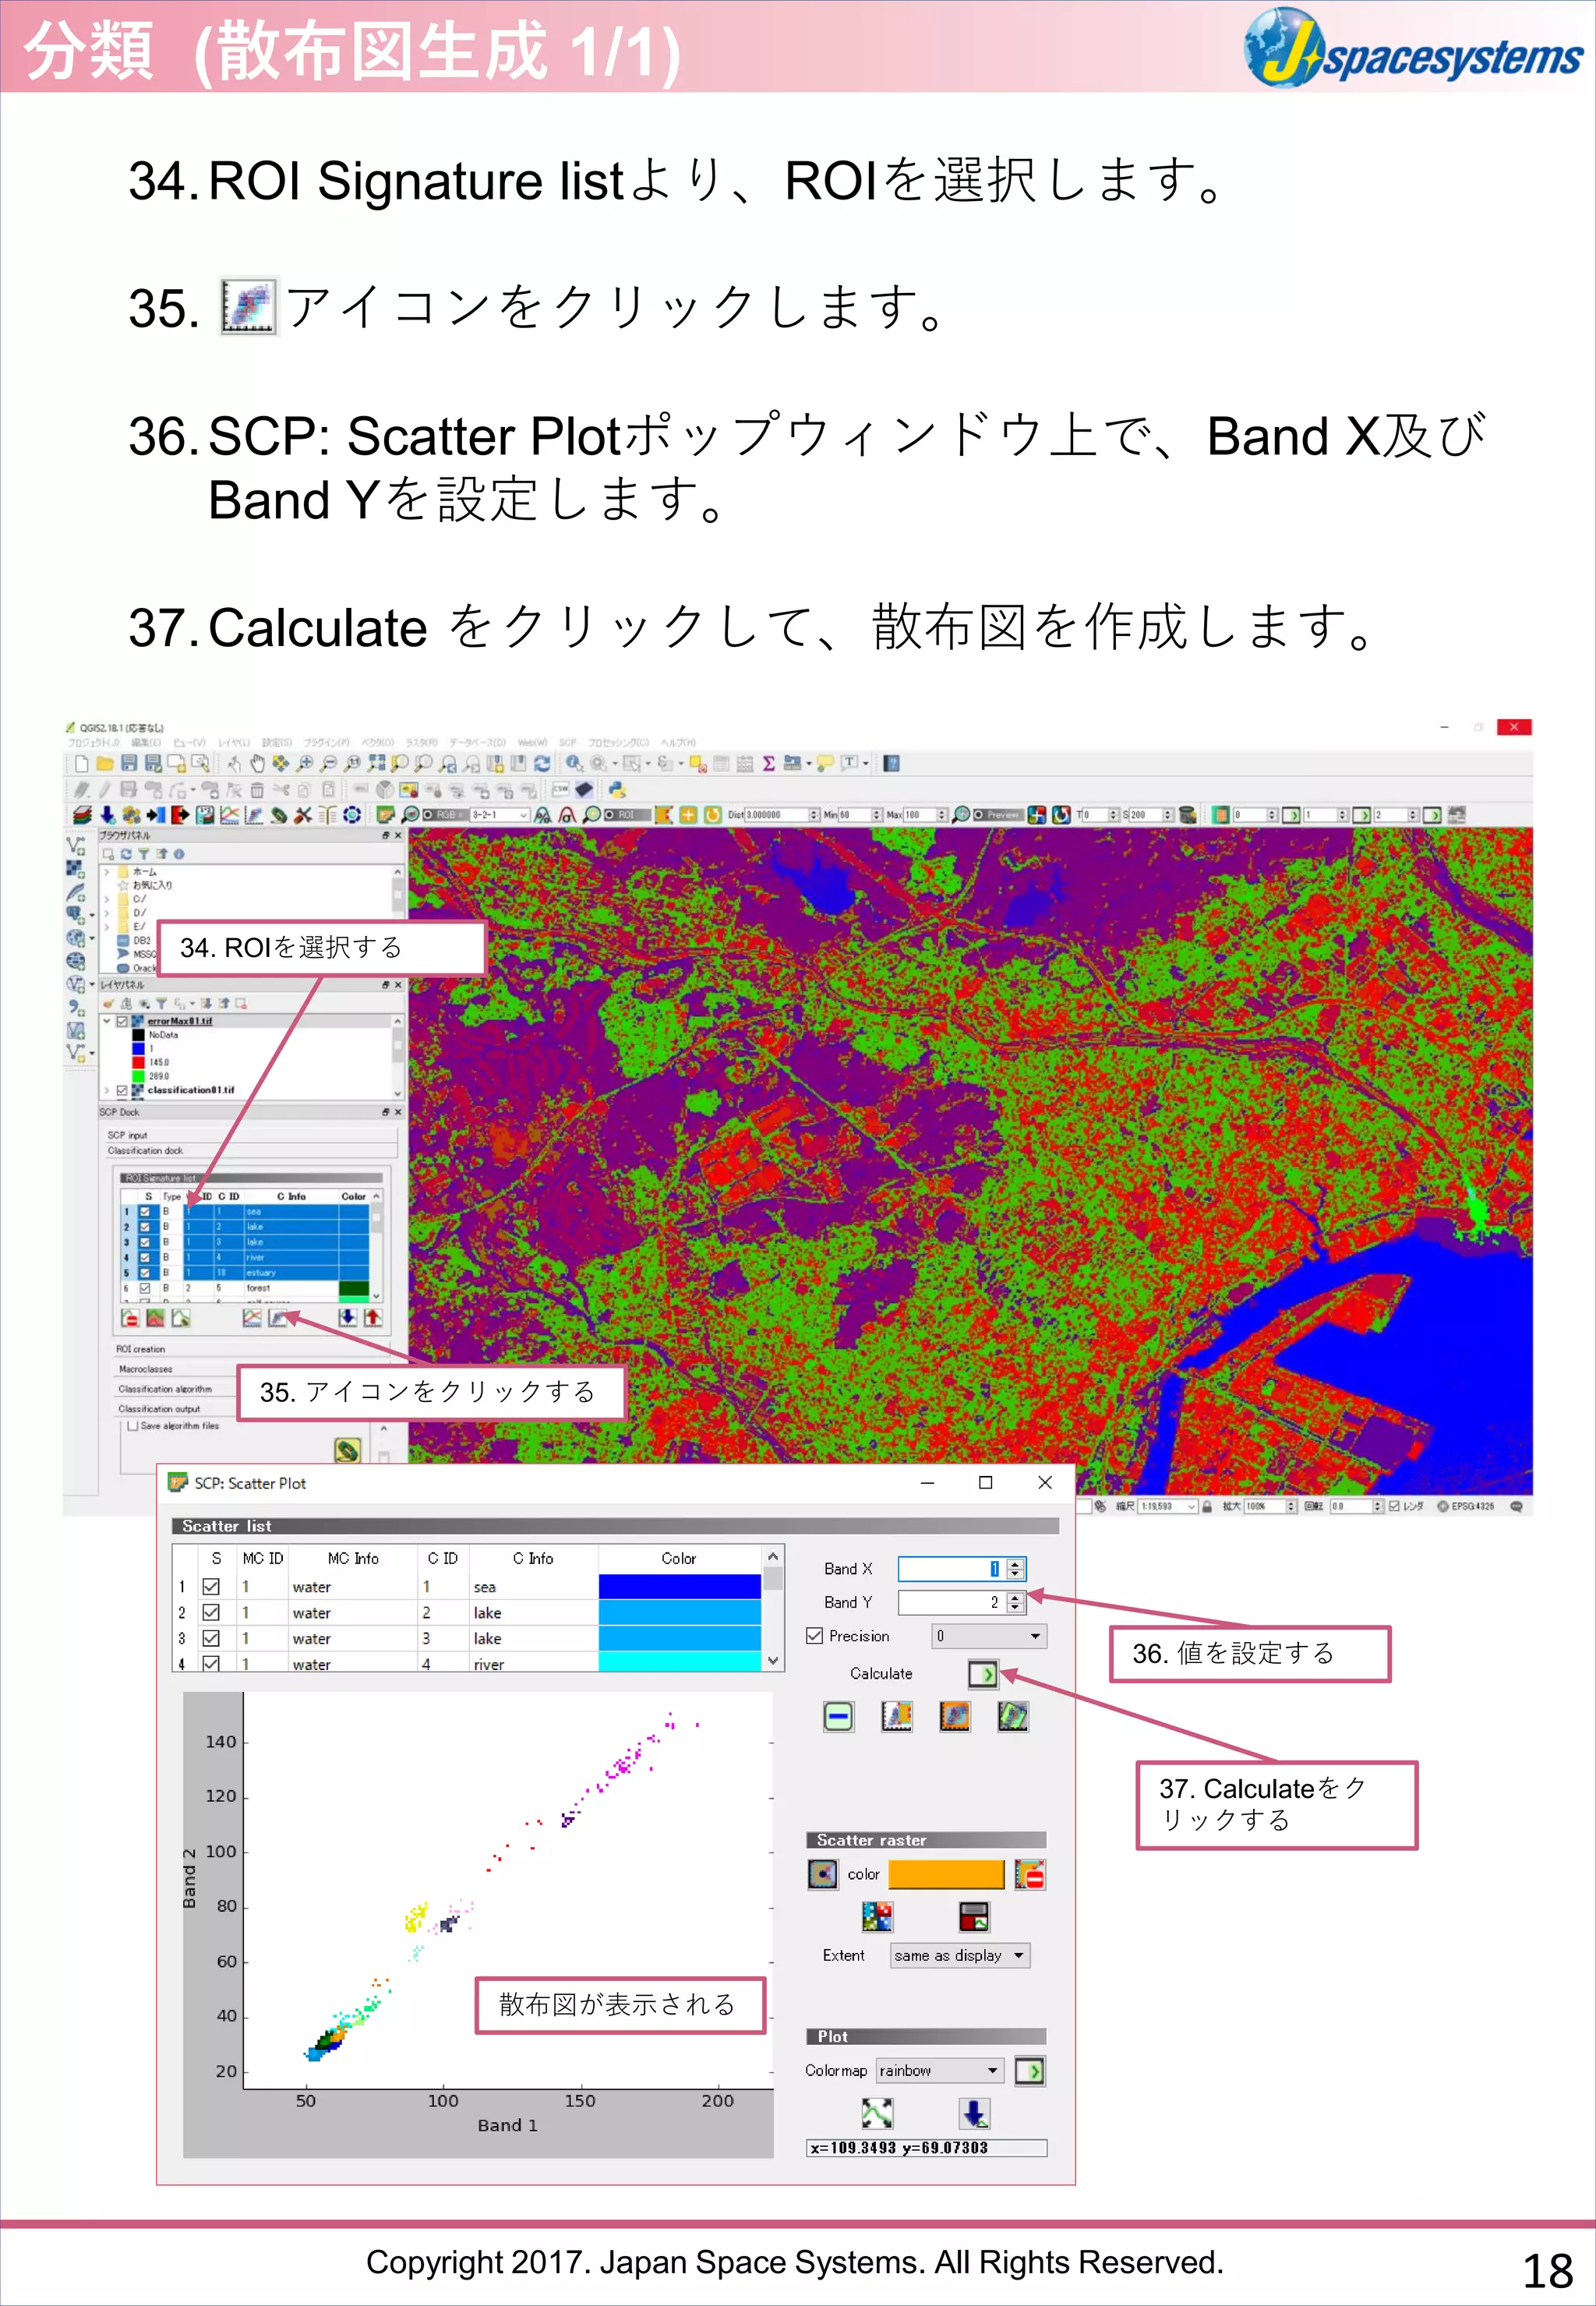
34.ROI Signature listより、ROIを選択します。
35. アイコンをクリックします。
36.SCP: Scatter Plotポップウィンドウ上で、Band X及び
Band Yを設定します。
37.Calculate をクリックして、散布図を作成します。
分類 (散布図生成 1/1)
34. ROIを選択する
35. アイコンをクリックする
36. 値を設定する
37. Calculateをク
リックする
散布図が表示される
18
- 19.
Copyright 2017. JapanSpace Systems. All Rights Reserved.
34.ROI Signature listより、ROIを選択します。
35. アイコンをクリックします。
36.SCP: Scatter Plotポップウィンドウ上で、Band X及び
Band Yを設定します。
37.Calculate をクリックして、散布図を作成します。
分類 (散布図生成 1/2)
34. ROIを選択する
35. アイコンをクリックする
36. 値を設定する
37. Calculateをク
リックする
散布図が表示される
19
- 20.
Copyright 2017. JapanSpace Systems. All Rights Reserved.
分類
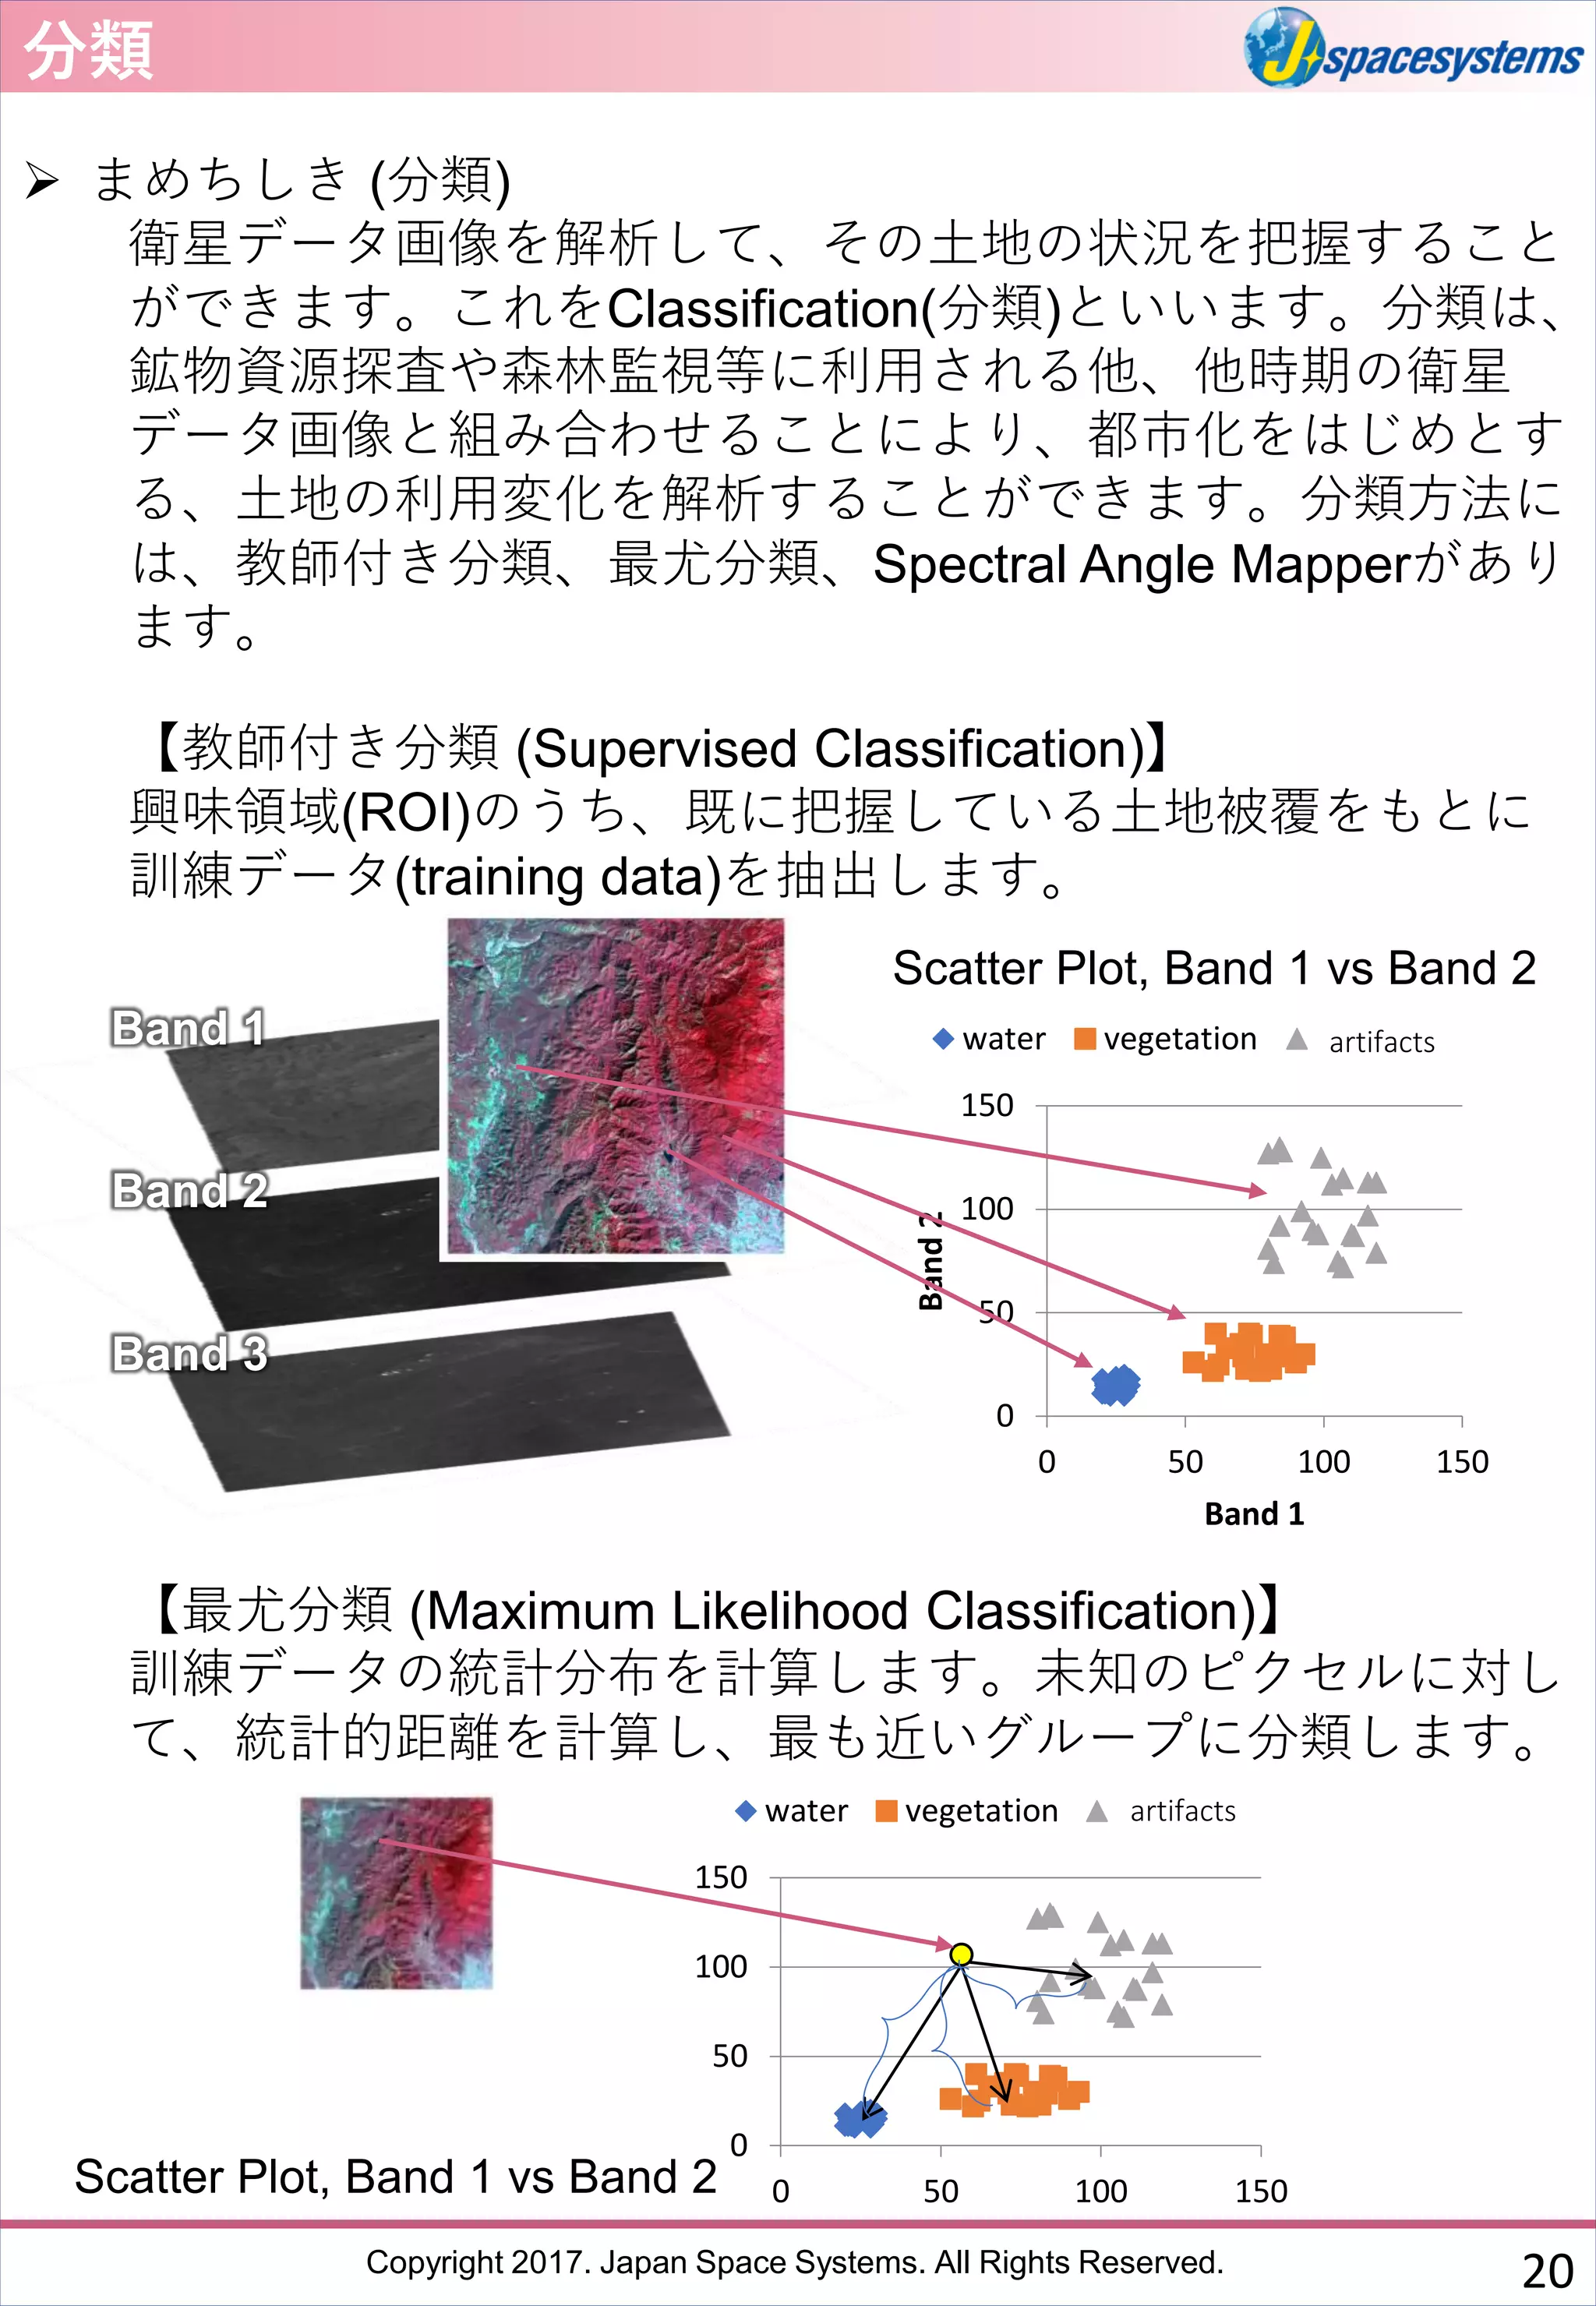
➢ まめちしき (分類)
衛星データ画像を解析して、その土地の状況を把握すること
ができます。これをClassification(分類)といいます。分類は、
鉱物資源探査や森林監視等に利用される他、他時期の衛星
データ画像と組み合わせることにより、都市化をはじめとす
る、土地の利用変化を解析することができます。分類方法に
は、教師付き分類、最尤分類、Spectral Angle Mapperがあり
ます。
【教師付き分類 (Supervised Classification)】
興味領域(ROI)のうち、既に把握している土地被覆をもとに
訓練データ(training data)を抽出します。
【最尤分類 (Maximum Likelihood Classification)】
訓練データの統計分布を計算します。未知のピクセルに対し
て、統計的距離を計算し、最も近いグループに分類します。
Band 1
Band 2
Band 3
0
50
100
150
0 50 100 150
Band2
Band 1
water vegetation man-made
Scatter Plot, Band 1 vs Band 2
artifacts
0
50
100
150
0 50 100 150
water vegetation man-madeartifacts
Scatter Plot, Band 1 vs Band 2
20
- 21.
Copyright 2017. JapanSpace Systems. All Rights Reserved.
分類
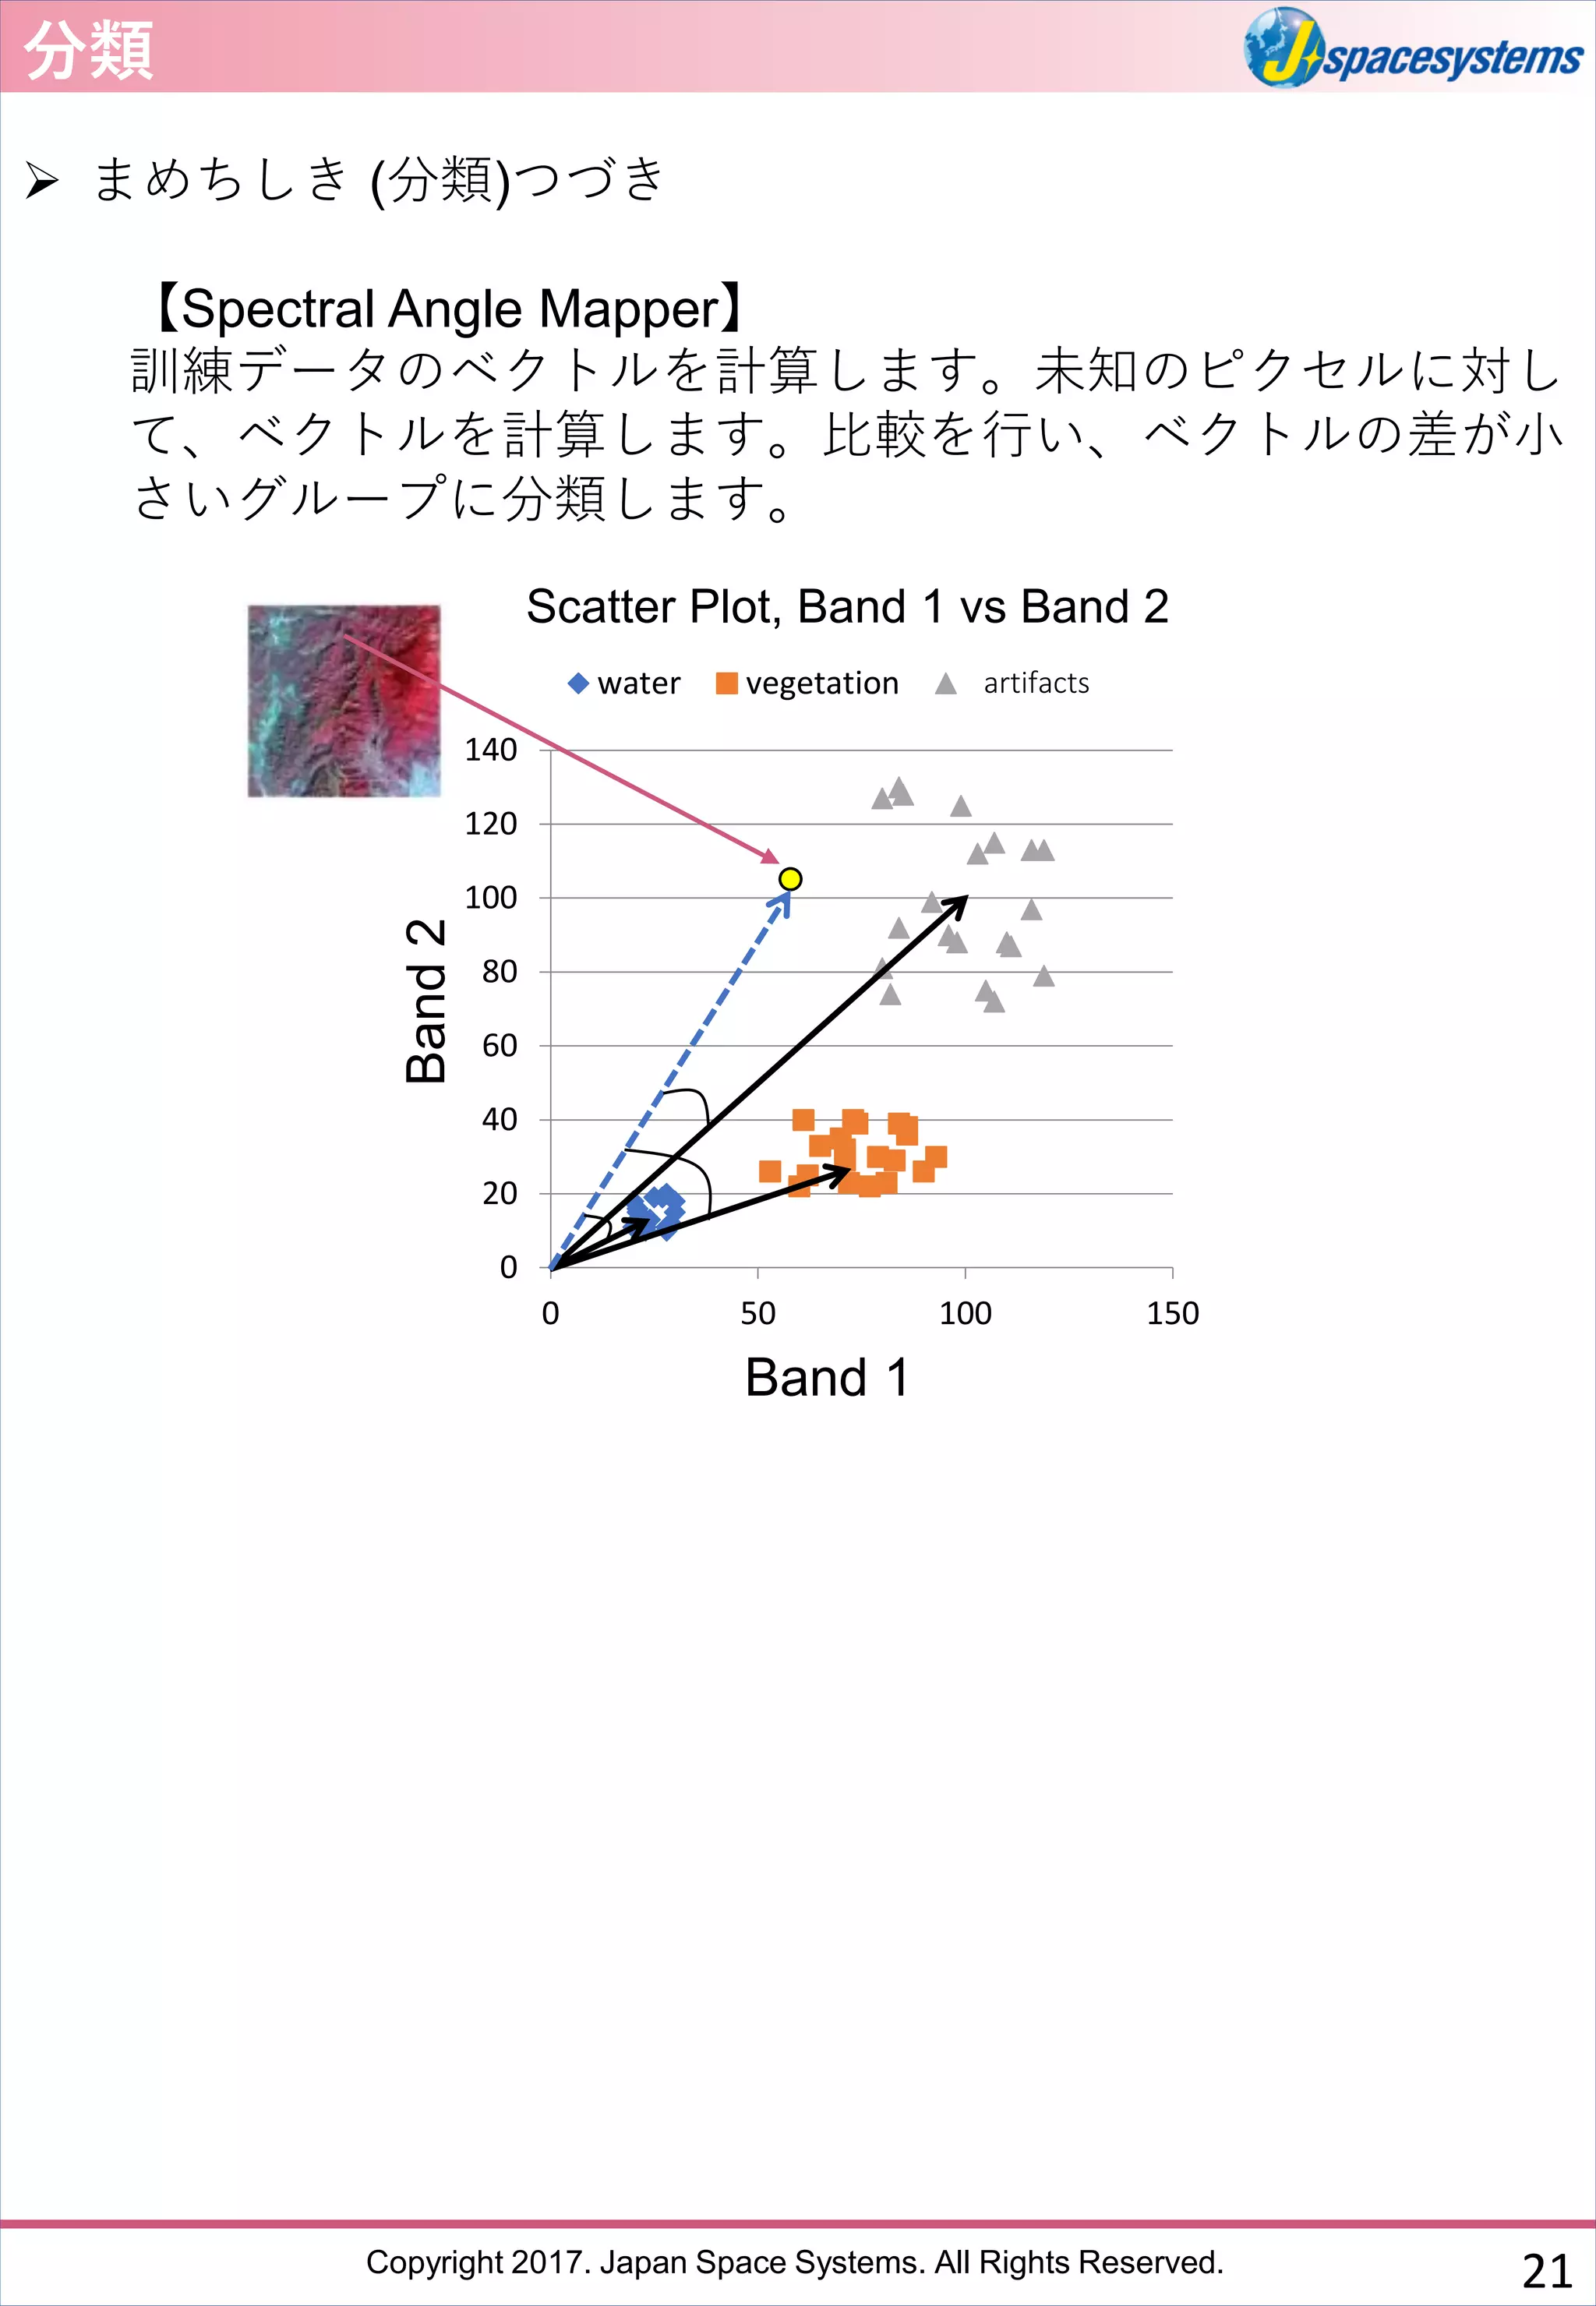
➢ まめちしき (分類)つづき
【Spectral Angle Mapper】
訓練データのベクトルを計算します。未知のピクセルに対し
て、ベクトルを計算します。比較を行い、ベクトルの差が小
さいグループに分類します。
0
20
40
60
80
100
120
140
0 50 100 150
water vegetation man-madeartifacts
Scatter Plot, Band 1 vs Band 2
Band 1
Band2
21