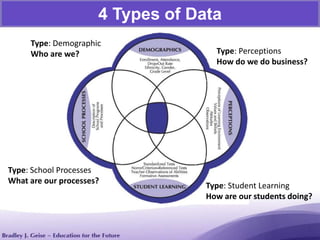
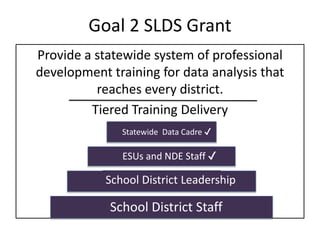
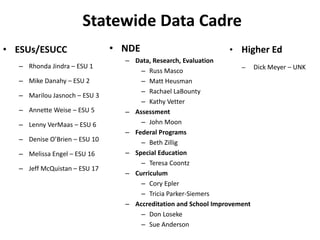
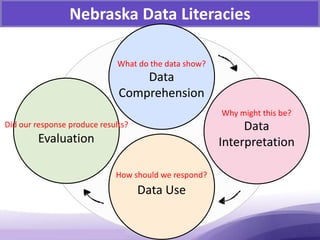
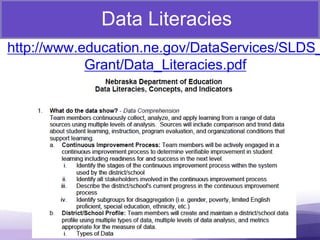
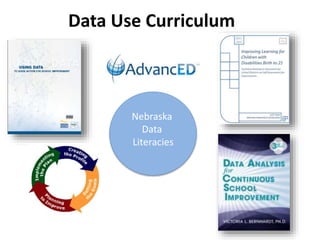
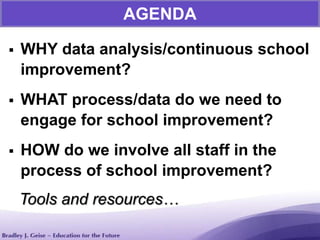
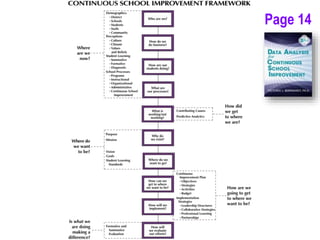
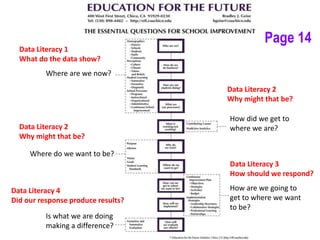
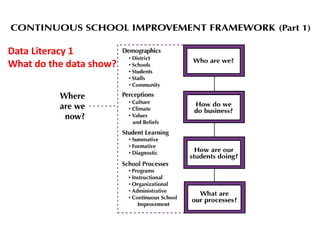
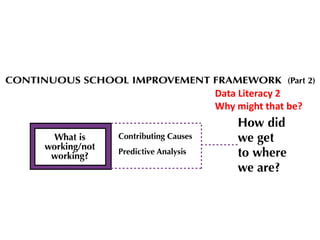
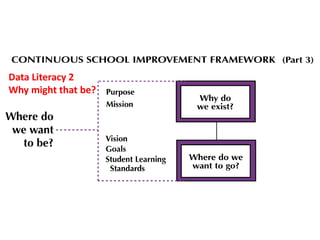
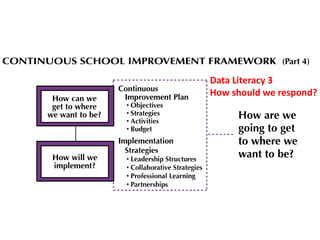
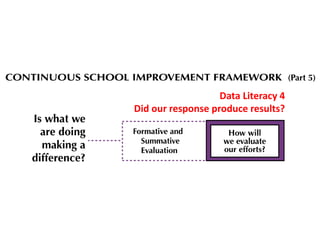
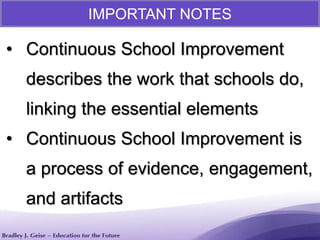
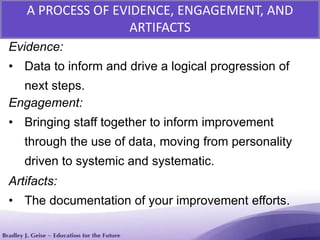
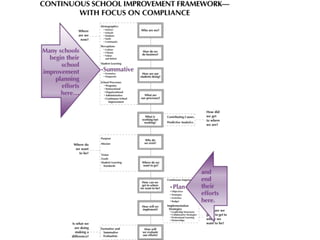
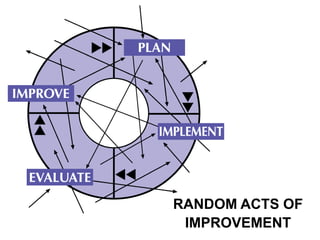
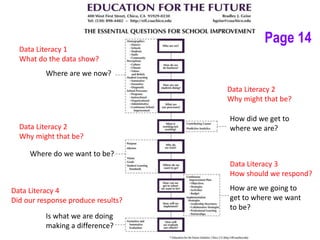
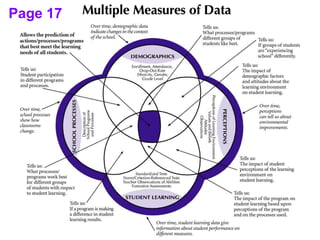
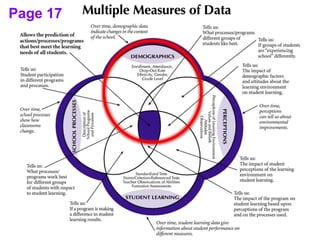
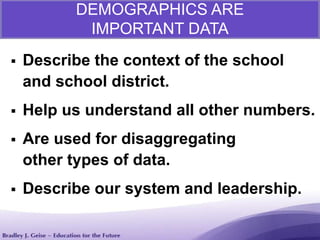
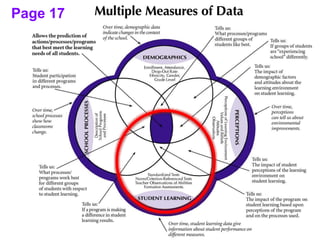
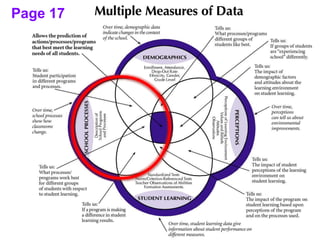
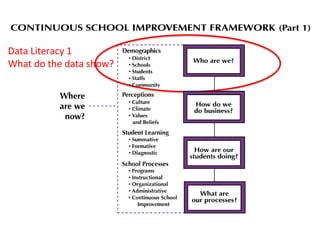
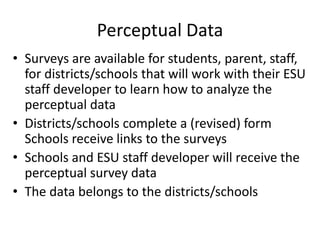
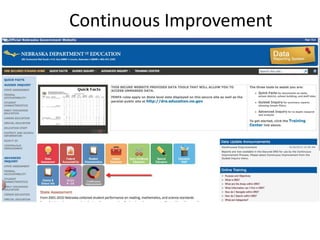
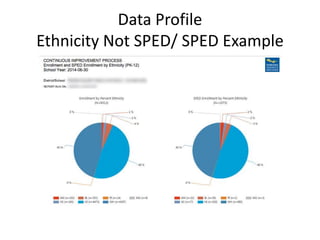
Using Data
for Continuous
School Improvement
2014 Fall CIP Workshops
4 Types of Data
Type: Perceptions
How do we do business?
Type: Student Learning
How are our students doing?
Type: School Processes
What are our processes?
Type: Demographic
Who are we?
Goal 2 SLDS Grant
Provide a statewide system of professional
development training for data analysis that
reaches every district.
Tiered Training Delivery
✔
School District Staff
School District Leadership
ESUs and NDE Staff ✔
Statewide Data Cadre ✔
Statewide Data Cadre
• ESUs/ESUCC
– Rhonda Jindra – ESU 1
– Mike Danahy – ESU 2
– Marilou Jasnoch – ESU 3
– Annette Weise – ESU 5
– Lenny VerMaas – ESU 6
– Denise O’Brien – ESU 10
– Melissa Engel – ESU 16
– Jeff McQuistan – ESU 17
• NDE
– Data, Research, Evaluation
– Russ Masco
– Matt Heusman
– Rachael LaBounty
– Kathy Vetter
– Assessment
– John Moon
– Federal Programs
– Beth Zillig
– Special Education
– Teresa Coontz
– Curriculum
– Cory Epler
– Tricia Parker-Siemers
– Accreditation and School Improvement
– Don Loseke
– Sue Anderson
• Higher Ed
– Dick Meyer – UNK
Nebraska Data Literacies
What do the data show?
Data
Comprehension
Why might this be?
Data
Interpretation
Did our response produce results?
Evaluation
How should we respond?
Data Use
Data Literacies Format
1.
a.
i.
Concept
Indicators
Literacy
Data Literacies
http://www.education.ne.gov/DataServices/SLDS_
Grant/Data_Literacies.pdf
Data Use Curriculum
Nebraska
Data
Literacies
 WHY data analysis/continuous school
improvement?
 WHAT process/data do we need to
engage for school improvement?
 HOW do we involve all staff in the
process of school improvement?
AGENDA
Tools and resources…
Bernhardt, V.L.
(2013)
Data Analysis
for Continuous
School
Improvement
(Third Edition)
New York, NY:
Routledge
BACKGROUND
• Education for the Future – Non-Profit Initiative
• Victoria L. Bernhardt, Exec Director
• California State University, Chico
• Our Mission
• Funded by contracts.
• 17 Books, Conferences, Institutes, Workshop.
• Manage long-term implementation contracts.
• Monthly online meeting series.
Data Analysis for Continuous School Improvement,
Third Edition, ……is about inspiring schools and
districts to commit to a continuous school
improvement framework that will result in
improving teaching for every teacher, and
improving learning for every student, in one
year, through the comprehensive use of data. It
is about providing a new definition of improvement,
away from compliance, toward a commitment to
excellence.
P. 5
HOW MUCH TIME DOES IT TAKE?
It will take one school year
for a school staff to do all
the work described in this
book. If parts of the work are
already done, a staff might
still want to spread out the
work throughout the year.
P. 10
WHY Data Analysis/Continuous
and School Improvement?
What would it take to ensure
student learning at
every grade level, in every subject area, and
with every student group?
WHAT IS THE HARDEST PART
FROM YOUR PERSPECTIVE?
 Beliefs that all children can learn.
 Schools honestly reviewing their data.
 One vision.
 One plan to implement the vision.
 Curriculum, instructional strategies, and
assessments clear and aligned to standards.
 Staff collaboration and use of data related to standards
implementation.
 Staff professional development to work differently.
 Rethinking current structures to avoid add-ons.
THINGS WE KNOW ABOUT DATA USE
For data to be used to impact classroom
instruction, there must be structures in
place, to—
 implement a shared schoolwide vision.
 help staff review data and discuss
improving processes.
 have regular, honest collaborations
that cause learning.
Continuous Improvement Cycle
Mission
Vision
VISION defines the desired or
intended future state of an
organization or enterprise in terms
of its fundamental objectives
relative to key, core areas
(curriculum, inst, assess, environ).
VISION
• Curriculum—
What we teach.
• Instruction—
How we teach the curriculum.
• Assessment—
How we assess learning.
• Environment—
How each person treats every
other person.
MISSION succinctly defines the
fundamental purpose of an
organization or an enterprise,
describing why they exist.
FOCUSED ACTS OF
IMPROVEMENT
Data Analysis for Continuous
School Improvement Is About
What You Are Evaluating Yourself
Against
“In times of change, learners
inherit the earth, while the learned
find themselves beautifully
equipped to deal with a world that
no longer exists.”
- Eric Hoffer
Page 14
Where are we now?
How did we get to
where we are?
Where do we want to be?
How are we going to
get to where we want
to be?
Is what we are doing
making a difference?
Data Literacy 1
What do the data show?
Data Literacy 2
Why might that be?
Data Literacy 3
How should we respond?
Data Literacy 4
Did our response produce results?
Data Literacy 2
Why might that be?
Page 14
Data Literacy 1
What do the data show?
Data Literacy 2
Why might that be?
Data Literacy 2
Why might that be?
Data Literacy 3
How should we respond?
Data Literacy 4
Did our response produce results?
IMPORTANT NOTES
• Continuous School Improvement
describes the work that schools do,
linking the essential elements
• Continuous School Improvement is
a process of evidence, engagement,
and artifacts
A PROCESS OF EVIDENCE, ENGAGEMENT, AND
ARTIFACTS
Evidence:
• Data to inform and drive a logical progression of
next steps.
Engagement:
• Bringing staff together to inform improvement
through the use of data, moving from personality
driven to systemic and systematic.
Artifacts:
• The documentation of your improvement efforts.
RANDOM ACTS OF
IMPROVEMENT
Where are we now?
How did we get to
where we are?
Where do we want to be?
How are we going to
get to where we want
to be?
Is what we are doing
making a difference?
Data Literacy 1
What do the data show?
Data Literacy 2
Why might that be?
Data Literacy 3
How should we respond?
Data Literacy 4
Did our response produce results?
Data Literacy 2
Why might that be?
Page 14
FOCUSED ACTS OF
IMPROVEMENT
COMPLIANCE
VERSUS
COMMITMENT
Bernhardt, V.L. (2013).
Data Analysis for
Continuous School
Improvement. Third Edition.
New York, NY: Routledge.
Page 4. Reproducible.
Page 4
Evidence
Data Literacy 1
What do the data show?
“Study the past if you would
like to define the future.”
- Confucius
Page 17
Page 17
 Describe the context of the school
and school district.
 Help us understand all other numbers.
 Are used for disaggregating
other types of data.
 Describe our system and leadership.
DEMOGRAPHICS ARE
IMPORTANT DATA
 Enrollment
 Gender
 Ethnicity / Race
 Attendance (Absences)
 Expulsions
 Suspensions
DEMOGRAPHICS
 Language Proficiency
 Indicators of Poverty
 Special Needs/Exceptionality
 IEP (Yes/No)
 Drop-Out/Graduation Rates
 Program Enrollment
DEMOGRAPHICS (Continued)
WHAT STUDENT DEMOGRAPHIC DATA ELEMENTS
CHANGE WHEN LEADERSHIP CHANGES?
 Enrollment
 Gender
 Ethnicity/Race
 Attendance
(Absences)
 Expulsions
 Suspensions
 Language Proficiency
 Indicators of Poverty
 Special Needs/
Exceptionality
 IEP (Yes/No)
 Drop-Out / Graduation Rates
 Program Enrollment
 School and Teaching Assignment
 Qualifications
 Years of Teaching/At this School
 Gender, Ethnicity
 Additional Professional
Development
STAFF DEMOGRAPHICS
Page 17
 Help us understand what
students, staff, and parents are
perceiving about the learning
environment.
 We cannot act different from
what we value, believe, perceive.
PERCEPTIONS ARE
IMPORTANT DATA
 Student, Staff, Parent,
Alumni Questionnaires
 Observations
 Focus Groups
PERCEPTIONS INCLUDE
PERCEPTIONS
What do you suppose students
say is the #1 “thing” that has to
be in place in order for them to
learn?
Page 17
 Know what students are
learning.
 Understand what we are
teaching.
 Determine which students
need extra help.
STUDENT LEARNING ARE
IMPORTANT DATA
STUDENT LEARNING
DATA INCLUDE
 Diagnostic Assessments
(Universal Screeners)
 Classroom Assessments
 Formative Assessments
(Progress Monitoring)
 Summative Assessments
(High Stakes Tests, End of Course)
Defined:
Pages
54-57
What happens when learning
organizations react solely to the
measures used for compliance
and accountability?
STUDENT LEARNING ARE
IMPORTANT DATA
Page 17
Schools are perfectly designed to
get the results they are getting now.
If schools want different results,
they must measure and then change
their processes to create the
results they really want.
SCHOOL PROCESSES
SCHOOL PROCESSES
Processes include…
 Actions, changes, functions that
bring about a desired result
 Curriculum, instructional strategies,
assessment, programs, interventions
…
 The way we work.
 Tell us about the way
we work.
 Tell us how we get the
results we are getting.
 Help us know if we have
instructional coherence.
SCHOOL PROCESSES ARE
IMPORTANT DATA
SCHOOL PROCESSES DEFINITIONS
 INSTRUCTIONAL: The techniques and
strategies that teachers use in the
learning environment.
 ORGANIZATIONAL: Those
structures the school puts in place
to implement the vision.
 ADMINISTRATIVE: Elements about
schooling that we count, such as class
sizes.
 CONTINUOUS SCHOOL IMPROVEMENT:
The structures and elements that help
schools continuously improve their
systems.
 PROGRAMS: Programs are planned series
of activities and processes, with specific
goals.
SCHOOL PROCESSES DEFINITIONS
Data Profile
Demographic Data
ENGAGEMENT
Appendix F Page 265-296
Data Literacy 1
What do the data show?
STUDY
QUESTIONS
Demographic
Data
Strengths Challenges
Implications for the
continuous school
improvement plan.
Other data . . .
Page 348
 STRENGTHS: Something positive
that can be seen in the data. Often
leverage for improving a challenge.
 CHALLENGES: Data that imply
something might need attention,
a potential undesirable result,
or something out of a school’s control.
DEFINITIONS
 IMPLICATIONS FOR THE
SCHOOL IMPROVEMENT PLAN
are placeholders until all the data are
analyzed. Implications are thoughts
to not forget to address in the school
improvement plan. Implications
most often result from CHALLENGES.
DEFINITIONS
 List other demographic data you
would like to have in your data
profile.
 Make sure your data profile
describes your uniqueness and
provides the information you need
to monitor your system.
OTHER DEMOGRAPHICS
LETS SEE WHAT IT LOOKS LIKE
Pages 265-334
• Individually review the
data to identify strengths,
challenges, implications
for planning, and further
data needed.
• Write your findings on
the Demographic Data
handout.
DEMOGRAPHIC DATA PP 265-296
Answer Questions—
Strengths, Challenges,
Implications, Other
Demographic Data.
1. Independently
2. Merge to Whole Group
3. Write combined findings on Poster
Paper
ANALYZING THE DATA
WHAT ARE
THE BENEFITS OF
THIS APPROACH?
DEMOGRAPHIC DATA PP 265-296
CASE STUDY Demographic Data
5 Divisions
1. Enrollment: Pages 265-273
2. Mobility: P. 273, Attendance: P. 274, ELL: P. 275,
& FRL: P. 276
3. Special Education: P. 277-284
4. Retention: PP. 276-277, Pre-Referral Team: PP.
285-286, Staff: Pages 294-296
5. Behavior: Pages 287-293
NEXT STEPS
Work with your ESU Staff Developer to
• Engage with your district/school data
• Analyze demographic, perceptual, student
learning, and school process data
• Understand the common and systemic
implications of strengths and challenges
from all four data types
• Solve challenges using data
DATA INVENTORIES - APPENDIX B
Pages 205-217
Next Steps….
Aggregating Implications for
Planning Across All Areas of Data
 Review implications across data.
 Look for commonalities.
 Create an aggregated list of
implications for the school
improvement plan.
MERGE STRENGTHS, CHALLENGES,
AND IMPLICATIONS FOR THE SCHOOL
IMPROVEMENT PLAN
After analyzing all four types of data
AGGREGATING IMPLICATIONS
• Intersections
• Presentation
and
interpretation/en
gagement as a
function of
analysis.Page 17
Page 343
FACILITATION GUIDE
Pages 343-353
“Education is learning what
you didn’t even know you didn’t
know.”
- Daniel J. Boorstin
CONTRIBUTING CAUSES:
Underlying cause or causes
of positive or negative results.
Pages 105-108
Page 106-108
PROBLEM
SOLVING
CYCLE
EXAMPLE
Not enough students
are proficient in
Mathematics.
IDENTIFY THE PROBLEM
THE PROBLEM-SOLVING CYCLE
Example Hunches/Hypotheses Page 106
THE PROBLEM-SOLVING CYCLE
Example Hunches/Hypotheses Page 106
What questions do you
need to answer to know
more about the problem
and what data do
you need to gather?
THE PROBLEM-SOLVING CYCLE
Example Questions/Data Needed Page 107
1. Identify a problem/
undesirable result.
2. List 20 reasons
this problem exists
(from the perspective
of your staff).
THE PROBLEM-SOLVING CYCLE
3. Determine what
questions you need
to answer with data.
4. What data do you
need to gather to
answer the questions?
THE PROBLEM-SOLVING CYCLE
Please record
on chart
paper.
P. 357 P. 358
PROBLEM SOLVING CYCLE
Evidence:
• Automatically end up at the 4 circles.
• Focus on the process(es) at the root.
Engagement:
• Makes big problems manageable.
• Time savings.
• Key in making the move from
personality driven to systemic and
systematic.
FACILITATION GUIDE
Pages 354-358
Where are we now?
How did we get to
where we are?
Where do we want to be?
How are we going to
get to where we want
to be?
Is what we are doing
making a difference?
Data Literacy 1
What do the data show?
Data Literacy 2
Why might that be?
Data Literacy 3
How should we respond?
Data Literacy 4
Did our response produce results?
Data Literacy 2
Why might that be?
Page 14
Data Literacy 1
What do the data show?
Perceptual and Demographic
Resources available
through NDE
Perceptual Data
• Surveys are available for students, parent, staff,
for districts/schools that will work with their ESU
staff developer to learn how to analyze the
perceptual data
• Districts/schools complete a (revised) form
Schools receive links to the surveys
• Schools and ESU staff developer will receive the
perceptual survey data
• The data belongs to the districts/schools
Perceptual Data Request Form
Return to ESU Staff Developer
Perceptual Data
• Ability to administer surveys will be available
in future years as well
• NDEs capacity to manage the perceptual data
surveys is developing
Data Profile - Reports in DRS
Profile similar to Bernhardt Appendix F
Continuous Improvement
Data Profile
Enrollment example
Data Profile-Enrollment by Ethnicity
Data Profile
Ethnicity Not SPED/ SPED Example
Evaluation & Next Steps
with your ESU Staff Developer
https://www.surveymonkey.com/s/dataliteracy
Please complete one survey per district
together as a district team
http://www.education.ne.gov/DataSer
vices/SLDS_Grant/Data_Cadre.html
Resources
PPT

Using Data for Continuos School Improvement

  • 1.
    Using Data for Continuous SchoolImprovement 2014 Fall CIP Workshops
  • 2.
    4 Types ofData Type: Perceptions How do we do business? Type: Student Learning How are our students doing? Type: School Processes What are our processes? Type: Demographic Who are we?
  • 4.
    Goal 2 SLDSGrant Provide a statewide system of professional development training for data analysis that reaches every district. Tiered Training Delivery ✔ School District Staff School District Leadership ESUs and NDE Staff ✔ Statewide Data Cadre ✔
  • 5.
    Statewide Data Cadre •ESUs/ESUCC – Rhonda Jindra – ESU 1 – Mike Danahy – ESU 2 – Marilou Jasnoch – ESU 3 – Annette Weise – ESU 5 – Lenny VerMaas – ESU 6 – Denise O’Brien – ESU 10 – Melissa Engel – ESU 16 – Jeff McQuistan – ESU 17 • NDE – Data, Research, Evaluation – Russ Masco – Matt Heusman – Rachael LaBounty – Kathy Vetter – Assessment – John Moon – Federal Programs – Beth Zillig – Special Education – Teresa Coontz – Curriculum – Cory Epler – Tricia Parker-Siemers – Accreditation and School Improvement – Don Loseke – Sue Anderson • Higher Ed – Dick Meyer – UNK
  • 6.
    Nebraska Data Literacies Whatdo the data show? Data Comprehension Why might this be? Data Interpretation Did our response produce results? Evaluation How should we respond? Data Use
  • 7.
  • 8.
  • 9.
  • 11.
     WHY dataanalysis/continuous school improvement?  WHAT process/data do we need to engage for school improvement?  HOW do we involve all staff in the process of school improvement? AGENDA Tools and resources…
  • 12.
    Bernhardt, V.L. (2013) Data Analysis forContinuous School Improvement (Third Edition) New York, NY: Routledge
  • 13.
    BACKGROUND • Education forthe Future – Non-Profit Initiative • Victoria L. Bernhardt, Exec Director • California State University, Chico • Our Mission • Funded by contracts. • 17 Books, Conferences, Institutes, Workshop. • Manage long-term implementation contracts. • Monthly online meeting series.
  • 14.
    Data Analysis forContinuous School Improvement, Third Edition, ……is about inspiring schools and districts to commit to a continuous school improvement framework that will result in improving teaching for every teacher, and improving learning for every student, in one year, through the comprehensive use of data. It is about providing a new definition of improvement, away from compliance, toward a commitment to excellence. P. 5
  • 15.
    HOW MUCH TIMEDOES IT TAKE? It will take one school year for a school staff to do all the work described in this book. If parts of the work are already done, a staff might still want to spread out the work throughout the year. P. 10
  • 17.
  • 18.
    What would ittake to ensure student learning at every grade level, in every subject area, and with every student group?
  • 20.
    WHAT IS THEHARDEST PART FROM YOUR PERSPECTIVE?  Beliefs that all children can learn.  Schools honestly reviewing their data.  One vision.  One plan to implement the vision.  Curriculum, instructional strategies, and assessments clear and aligned to standards.  Staff collaboration and use of data related to standards implementation.  Staff professional development to work differently.  Rethinking current structures to avoid add-ons.
  • 21.
    THINGS WE KNOWABOUT DATA USE For data to be used to impact classroom instruction, there must be structures in place, to—  implement a shared schoolwide vision.  help staff review data and discuss improving processes.  have regular, honest collaborations that cause learning.
  • 23.
  • 24.
    VISION defines thedesired or intended future state of an organization or enterprise in terms of its fundamental objectives relative to key, core areas (curriculum, inst, assess, environ).
  • 25.
    VISION • Curriculum— What weteach. • Instruction— How we teach the curriculum. • Assessment— How we assess learning. • Environment— How each person treats every other person.
  • 26.
    MISSION succinctly definesthe fundamental purpose of an organization or an enterprise, describing why they exist.
  • 27.
  • 28.
    Data Analysis forContinuous School Improvement Is About What You Are Evaluating Yourself Against
  • 30.
    “In times ofchange, learners inherit the earth, while the learned find themselves beautifully equipped to deal with a world that no longer exists.” - Eric Hoffer
  • 31.
  • 32.
    Where are wenow? How did we get to where we are? Where do we want to be? How are we going to get to where we want to be? Is what we are doing making a difference? Data Literacy 1 What do the data show? Data Literacy 2 Why might that be? Data Literacy 3 How should we respond? Data Literacy 4 Did our response produce results? Data Literacy 2 Why might that be? Page 14
  • 33.
    Data Literacy 1 Whatdo the data show?
  • 34.
    Data Literacy 2 Whymight that be?
  • 35.
    Data Literacy 2 Whymight that be?
  • 36.
    Data Literacy 3 Howshould we respond?
  • 37.
    Data Literacy 4 Didour response produce results?
  • 38.
    IMPORTANT NOTES • ContinuousSchool Improvement describes the work that schools do, linking the essential elements • Continuous School Improvement is a process of evidence, engagement, and artifacts
  • 39.
    A PROCESS OFEVIDENCE, ENGAGEMENT, AND ARTIFACTS Evidence: • Data to inform and drive a logical progression of next steps. Engagement: • Bringing staff together to inform improvement through the use of data, moving from personality driven to systemic and systematic. Artifacts: • The documentation of your improvement efforts.
  • 41.
  • 42.
    Where are wenow? How did we get to where we are? Where do we want to be? How are we going to get to where we want to be? Is what we are doing making a difference? Data Literacy 1 What do the data show? Data Literacy 2 Why might that be? Data Literacy 3 How should we respond? Data Literacy 4 Did our response produce results? Data Literacy 2 Why might that be? Page 14
  • 43.
  • 44.
    COMPLIANCE VERSUS COMMITMENT Bernhardt, V.L. (2013). DataAnalysis for Continuous School Improvement. Third Edition. New York, NY: Routledge. Page 4. Reproducible. Page 4
  • 46.
  • 48.
    Data Literacy 1 Whatdo the data show?
  • 49.
    “Study the pastif you would like to define the future.” - Confucius
  • 50.
  • 51.
  • 52.
     Describe thecontext of the school and school district.  Help us understand all other numbers.  Are used for disaggregating other types of data.  Describe our system and leadership. DEMOGRAPHICS ARE IMPORTANT DATA
  • 53.
     Enrollment  Gender Ethnicity / Race  Attendance (Absences)  Expulsions  Suspensions DEMOGRAPHICS
  • 54.
     Language Proficiency Indicators of Poverty  Special Needs/Exceptionality  IEP (Yes/No)  Drop-Out/Graduation Rates  Program Enrollment DEMOGRAPHICS (Continued)
  • 55.
    WHAT STUDENT DEMOGRAPHICDATA ELEMENTS CHANGE WHEN LEADERSHIP CHANGES?  Enrollment  Gender  Ethnicity/Race  Attendance (Absences)  Expulsions  Suspensions  Language Proficiency  Indicators of Poverty  Special Needs/ Exceptionality  IEP (Yes/No)  Drop-Out / Graduation Rates  Program Enrollment
  • 56.
     School andTeaching Assignment  Qualifications  Years of Teaching/At this School  Gender, Ethnicity  Additional Professional Development STAFF DEMOGRAPHICS
  • 57.
  • 58.
     Help usunderstand what students, staff, and parents are perceiving about the learning environment.  We cannot act different from what we value, believe, perceive. PERCEPTIONS ARE IMPORTANT DATA
  • 59.
     Student, Staff,Parent, Alumni Questionnaires  Observations  Focus Groups PERCEPTIONS INCLUDE
  • 60.
    PERCEPTIONS What do yousuppose students say is the #1 “thing” that has to be in place in order for them to learn?
  • 61.
  • 62.
     Know whatstudents are learning.  Understand what we are teaching.  Determine which students need extra help. STUDENT LEARNING ARE IMPORTANT DATA
  • 63.
    STUDENT LEARNING DATA INCLUDE Diagnostic Assessments (Universal Screeners)  Classroom Assessments  Formative Assessments (Progress Monitoring)  Summative Assessments (High Stakes Tests, End of Course) Defined: Pages 54-57
  • 65.
    What happens whenlearning organizations react solely to the measures used for compliance and accountability? STUDENT LEARNING ARE IMPORTANT DATA
  • 66.
  • 67.
    Schools are perfectlydesigned to get the results they are getting now. If schools want different results, they must measure and then change their processes to create the results they really want. SCHOOL PROCESSES
  • 68.
    SCHOOL PROCESSES Processes include… Actions, changes, functions that bring about a desired result  Curriculum, instructional strategies, assessment, programs, interventions …  The way we work.
  • 69.
     Tell usabout the way we work.  Tell us how we get the results we are getting.  Help us know if we have instructional coherence. SCHOOL PROCESSES ARE IMPORTANT DATA
  • 70.
    SCHOOL PROCESSES DEFINITIONS INSTRUCTIONAL: The techniques and strategies that teachers use in the learning environment.  ORGANIZATIONAL: Those structures the school puts in place to implement the vision.
  • 71.
     ADMINISTRATIVE: Elementsabout schooling that we count, such as class sizes.  CONTINUOUS SCHOOL IMPROVEMENT: The structures and elements that help schools continuously improve their systems.  PROGRAMS: Programs are planned series of activities and processes, with specific goals. SCHOOL PROCESSES DEFINITIONS
  • 73.
  • 74.
    Data Literacy 1 Whatdo the data show?
  • 77.
    STUDY QUESTIONS Demographic Data Strengths Challenges Implications forthe continuous school improvement plan. Other data . . . Page 348
  • 78.
     STRENGTHS: Somethingpositive that can be seen in the data. Often leverage for improving a challenge.  CHALLENGES: Data that imply something might need attention, a potential undesirable result, or something out of a school’s control. DEFINITIONS
  • 79.
     IMPLICATIONS FORTHE SCHOOL IMPROVEMENT PLAN are placeholders until all the data are analyzed. Implications are thoughts to not forget to address in the school improvement plan. Implications most often result from CHALLENGES. DEFINITIONS
  • 80.
     List otherdemographic data you would like to have in your data profile.  Make sure your data profile describes your uniqueness and provides the information you need to monitor your system. OTHER DEMOGRAPHICS
  • 82.
    LETS SEE WHATIT LOOKS LIKE Pages 265-334
  • 83.
    • Individually reviewthe data to identify strengths, challenges, implications for planning, and further data needed. • Write your findings on the Demographic Data handout. DEMOGRAPHIC DATA PP 265-296
  • 84.
    Answer Questions— Strengths, Challenges, Implications,Other Demographic Data. 1. Independently 2. Merge to Whole Group 3. Write combined findings on Poster Paper ANALYZING THE DATA WHAT ARE THE BENEFITS OF THIS APPROACH?
  • 85.
    DEMOGRAPHIC DATA PP265-296 CASE STUDY Demographic Data 5 Divisions 1. Enrollment: Pages 265-273 2. Mobility: P. 273, Attendance: P. 274, ELL: P. 275, & FRL: P. 276 3. Special Education: P. 277-284 4. Retention: PP. 276-277, Pre-Referral Team: PP. 285-286, Staff: Pages 294-296 5. Behavior: Pages 287-293
  • 87.
    NEXT STEPS Work withyour ESU Staff Developer to • Engage with your district/school data • Analyze demographic, perceptual, student learning, and school process data • Understand the common and systemic implications of strengths and challenges from all four data types • Solve challenges using data
  • 88.
    DATA INVENTORIES -APPENDIX B Pages 205-217
  • 89.
    Next Steps…. Aggregating Implicationsfor Planning Across All Areas of Data
  • 90.
     Review implicationsacross data.  Look for commonalities.  Create an aggregated list of implications for the school improvement plan. MERGE STRENGTHS, CHALLENGES, AND IMPLICATIONS FOR THE SCHOOL IMPROVEMENT PLAN After analyzing all four types of data
  • 91.
    AGGREGATING IMPLICATIONS • Intersections •Presentation and interpretation/en gagement as a function of analysis.Page 17
  • 92.
  • 93.
  • 95.
    “Education is learningwhat you didn’t even know you didn’t know.” - Daniel J. Boorstin
  • 96.
    CONTRIBUTING CAUSES: Underlying causeor causes of positive or negative results. Pages 105-108
  • 97.
  • 98.
    Not enough students areproficient in Mathematics. IDENTIFY THE PROBLEM
  • 99.
    THE PROBLEM-SOLVING CYCLE ExampleHunches/Hypotheses Page 106
  • 100.
    THE PROBLEM-SOLVING CYCLE ExampleHunches/Hypotheses Page 106
  • 101.
    What questions doyou need to answer to know more about the problem and what data do you need to gather? THE PROBLEM-SOLVING CYCLE
  • 102.
    THE PROBLEM-SOLVING CYCLE ExampleQuestions/Data Needed Page 107
  • 103.
    1. Identify aproblem/ undesirable result. 2. List 20 reasons this problem exists (from the perspective of your staff). THE PROBLEM-SOLVING CYCLE
  • 104.
    3. Determine what questionsyou need to answer with data. 4. What data do you need to gather to answer the questions? THE PROBLEM-SOLVING CYCLE
  • 105.
    THE PROBLEM-SOLVING CYCLE Pleaserecord on chart paper. P. 357 P. 358
  • 106.
    PROBLEM SOLVING CYCLE Evidence: •Automatically end up at the 4 circles. • Focus on the process(es) at the root. Engagement: • Makes big problems manageable. • Time savings. • Key in making the move from personality driven to systemic and systematic.
  • 107.
  • 108.
    Where are wenow? How did we get to where we are? Where do we want to be? How are we going to get to where we want to be? Is what we are doing making a difference? Data Literacy 1 What do the data show? Data Literacy 2 Why might that be? Data Literacy 3 How should we respond? Data Literacy 4 Did our response produce results? Data Literacy 2 Why might that be? Page 14
  • 109.
    Data Literacy 1 Whatdo the data show?
  • 111.
  • 112.
    Perceptual Data • Surveysare available for students, parent, staff, for districts/schools that will work with their ESU staff developer to learn how to analyze the perceptual data • Districts/schools complete a (revised) form Schools receive links to the surveys • Schools and ESU staff developer will receive the perceptual survey data • The data belongs to the districts/schools
  • 113.
    Perceptual Data RequestForm Return to ESU Staff Developer
  • 114.
    Perceptual Data • Abilityto administer surveys will be available in future years as well • NDEs capacity to manage the perceptual data surveys is developing
  • 115.
    Data Profile -Reports in DRS Profile similar to Bernhardt Appendix F
  • 116.
  • 118.
  • 119.
  • 120.
    Data Profile Ethnicity NotSPED/ SPED Example
  • 121.
    Evaluation & NextSteps with your ESU Staff Developer https://www.surveymonkey.com/s/dataliteracy Please complete one survey per district together as a district team
  • 122.