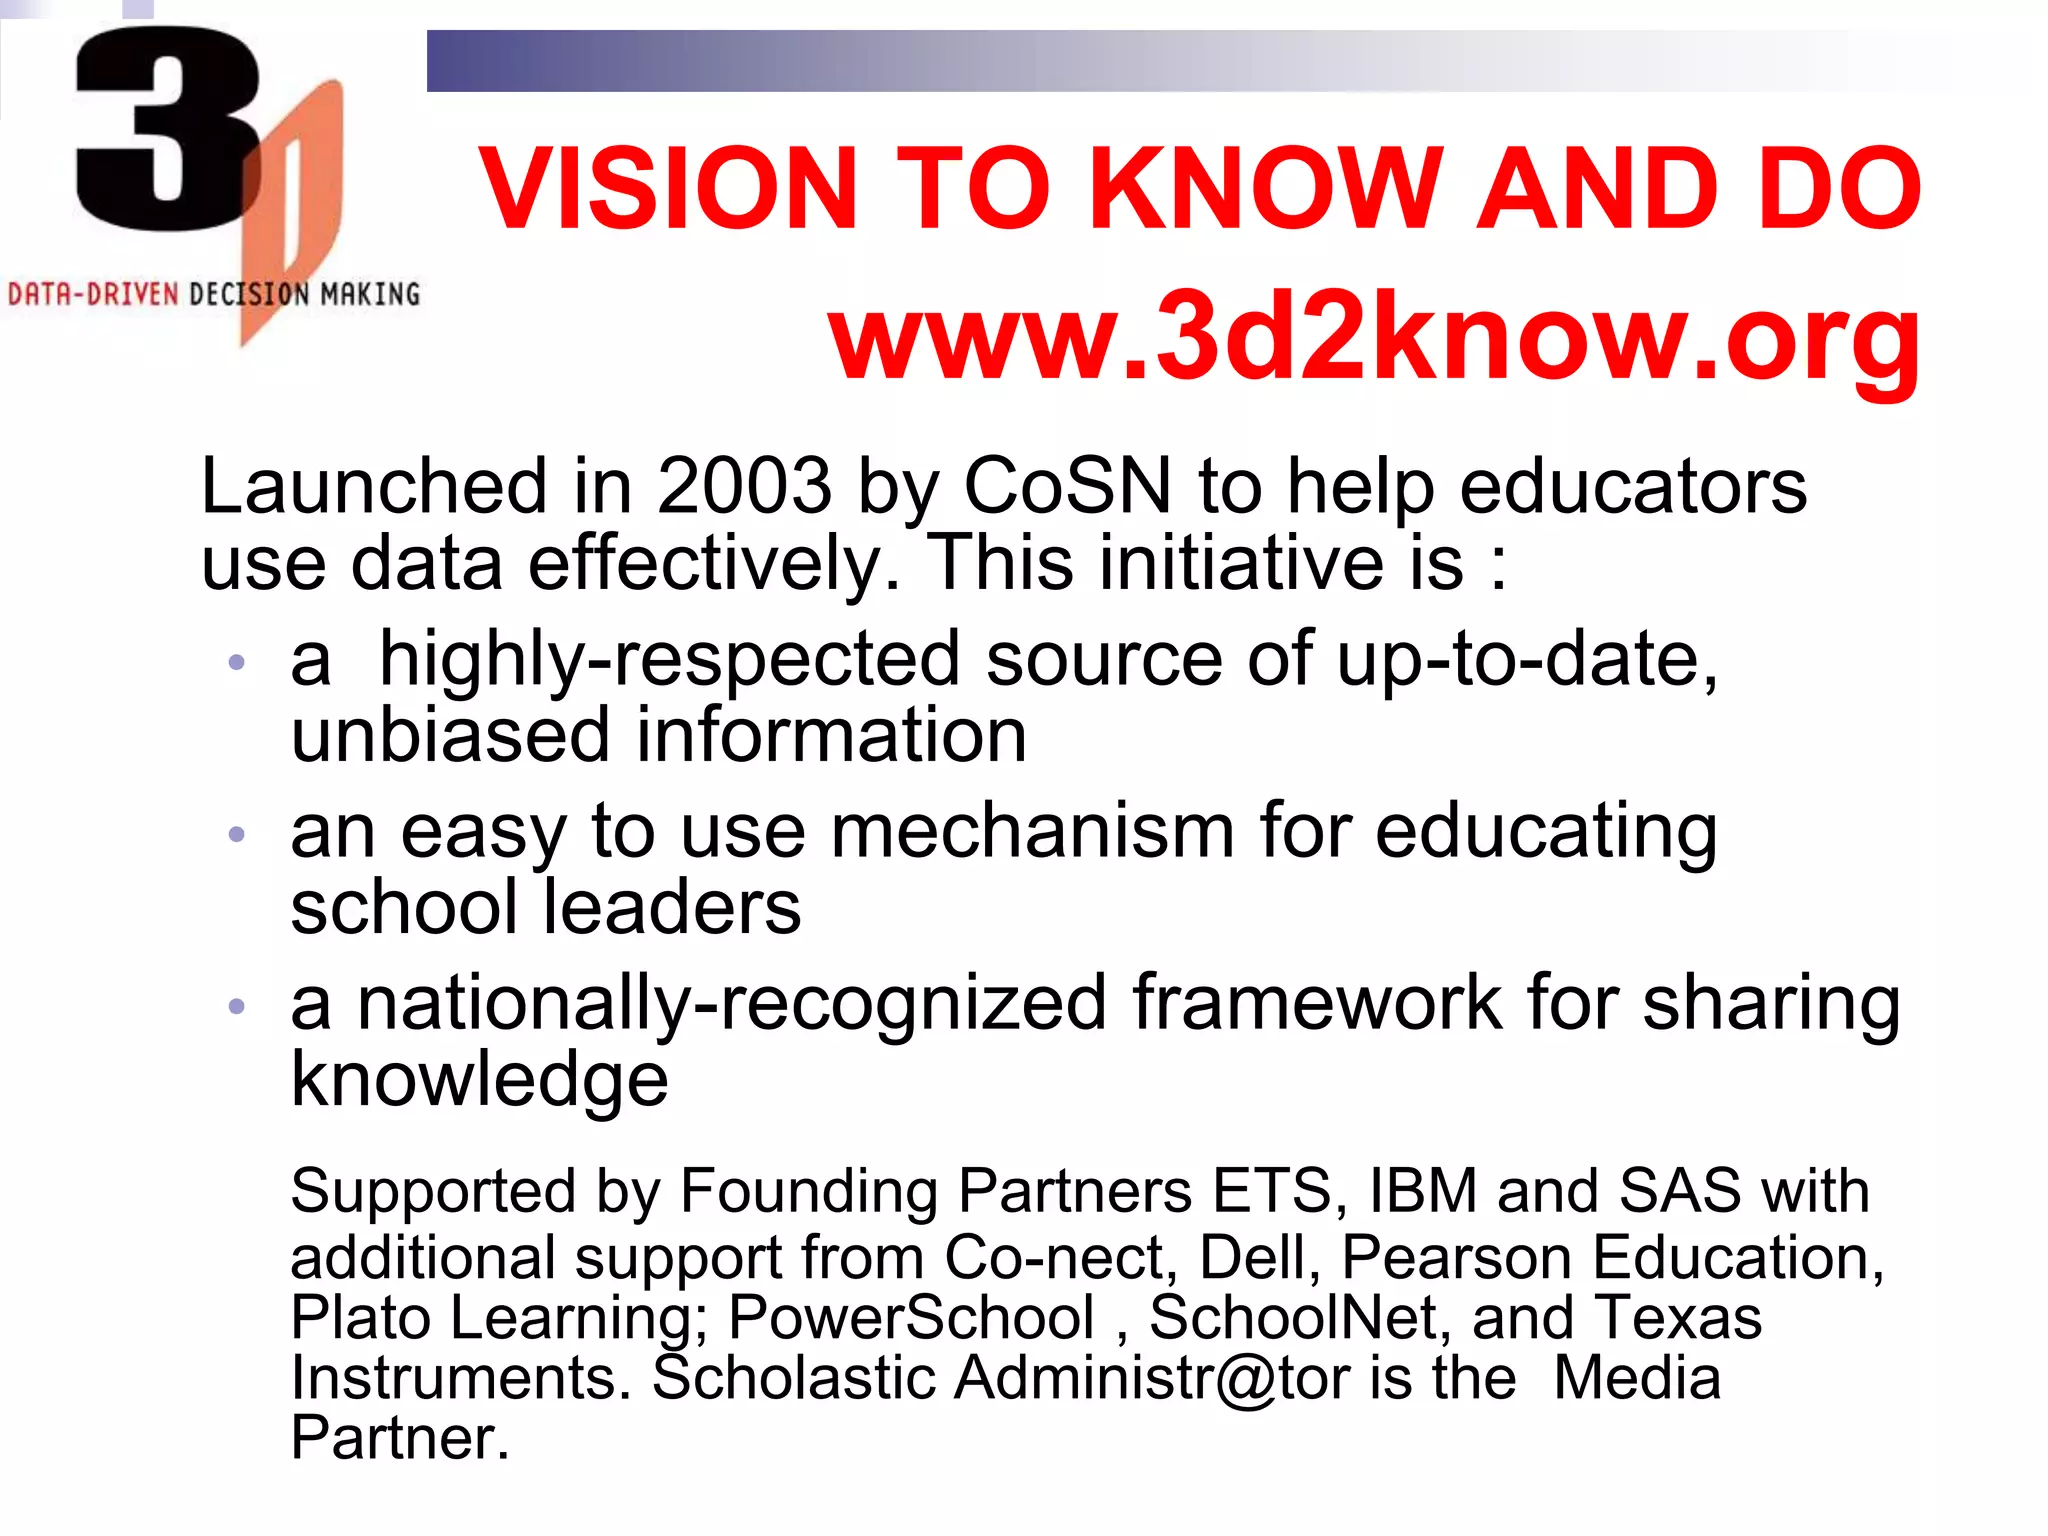
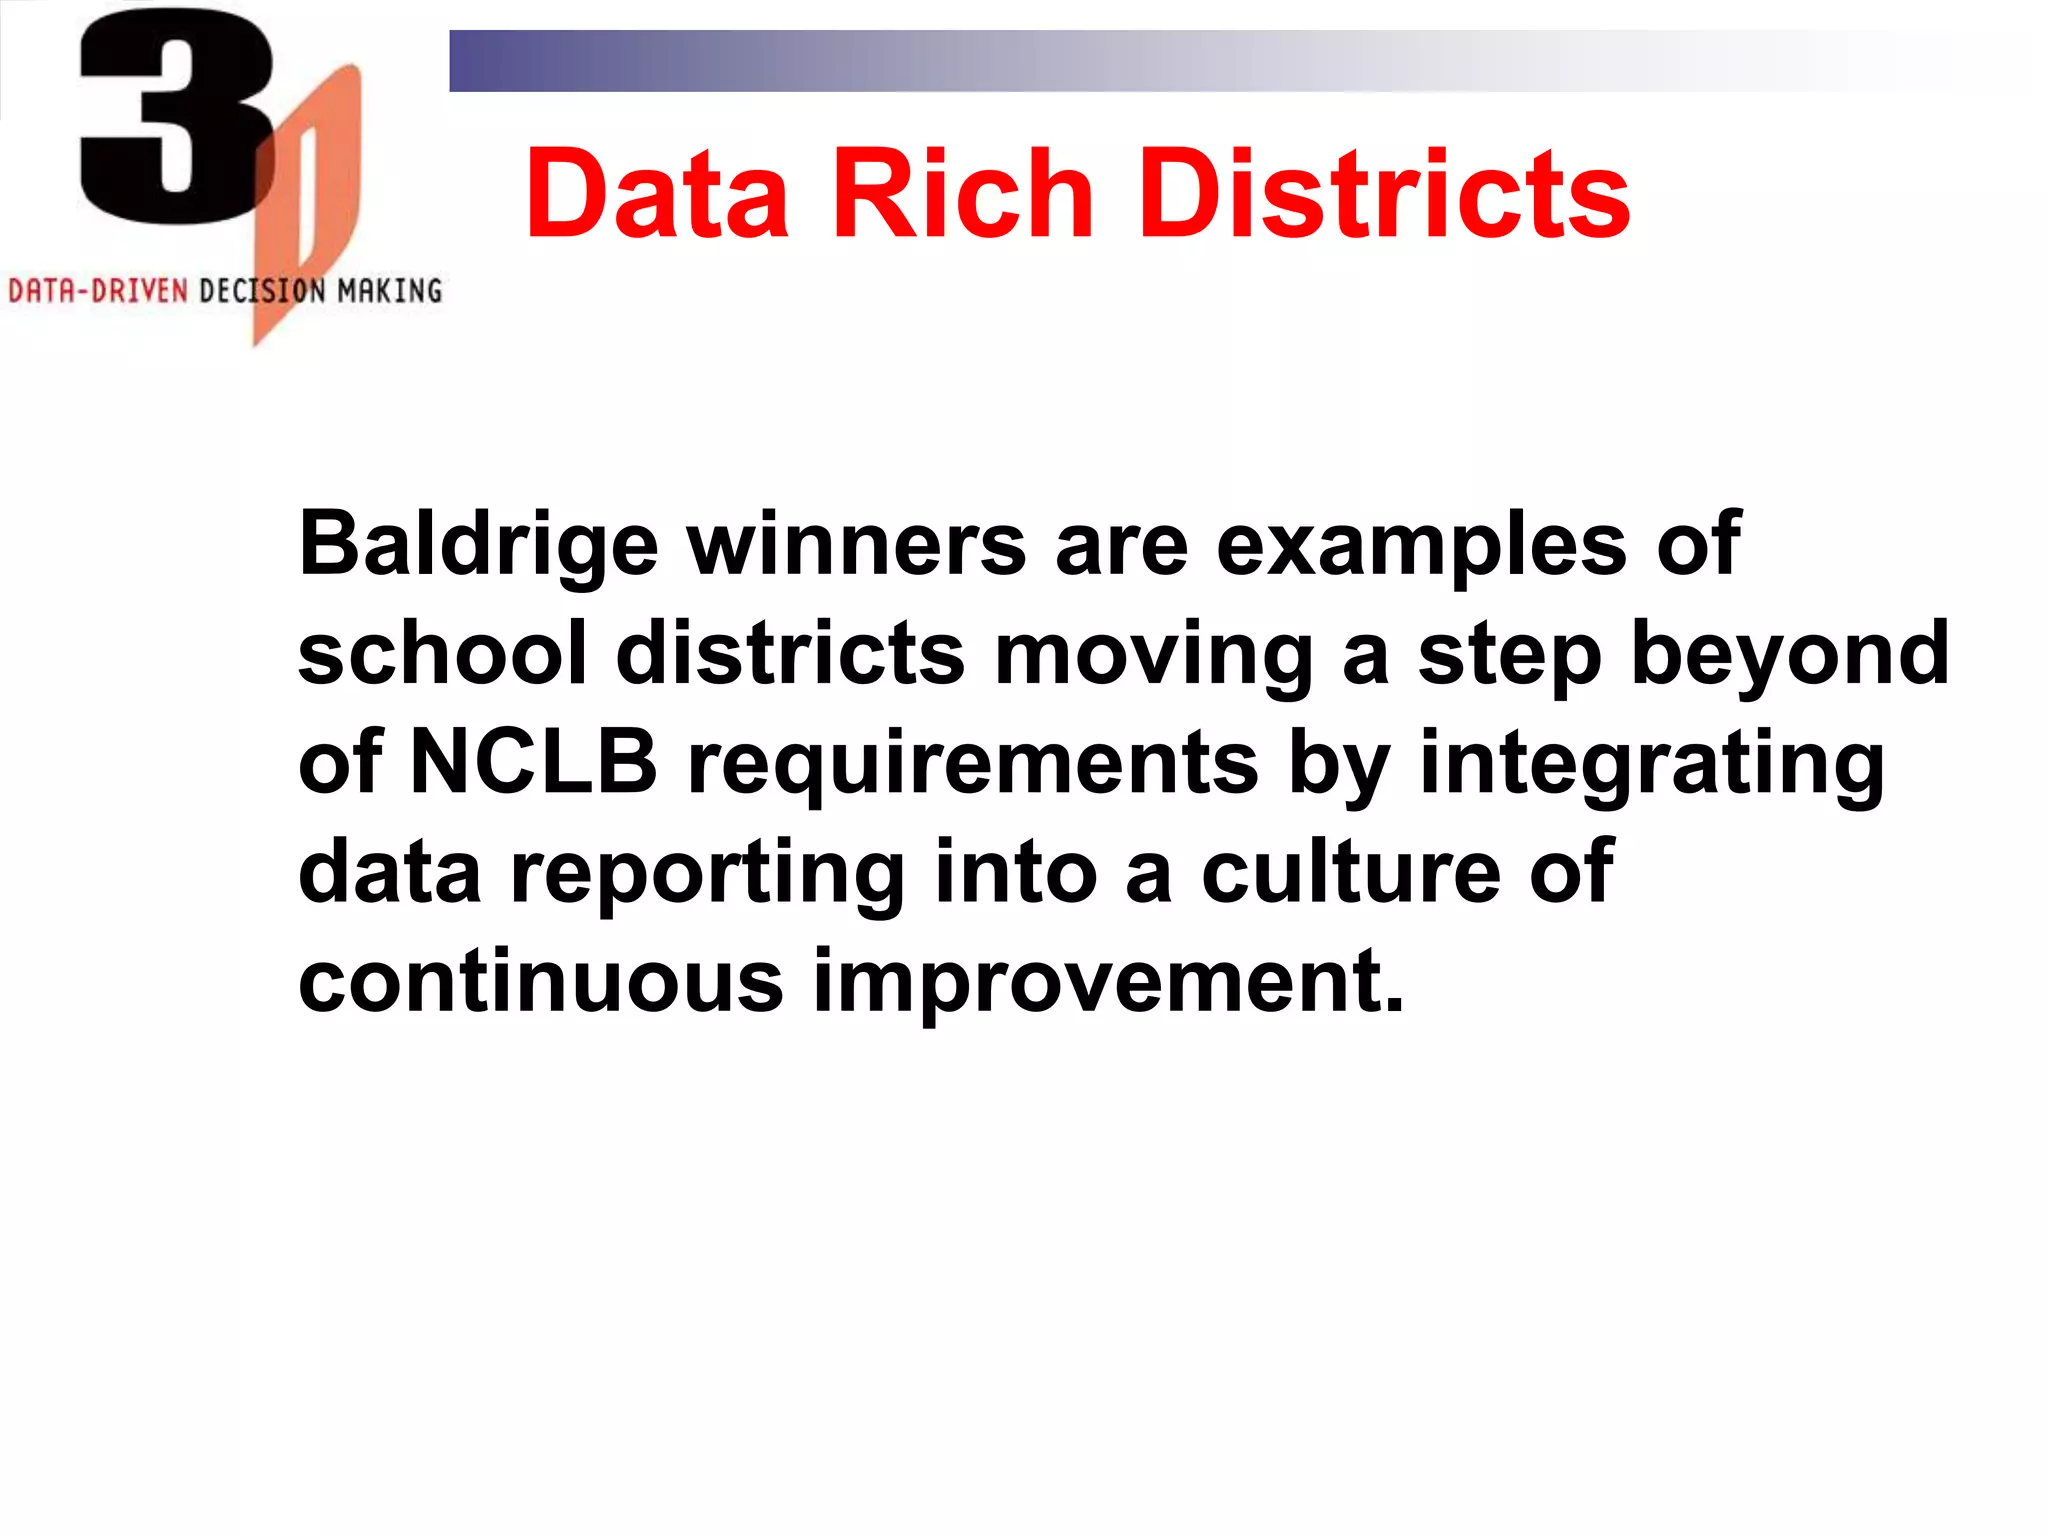
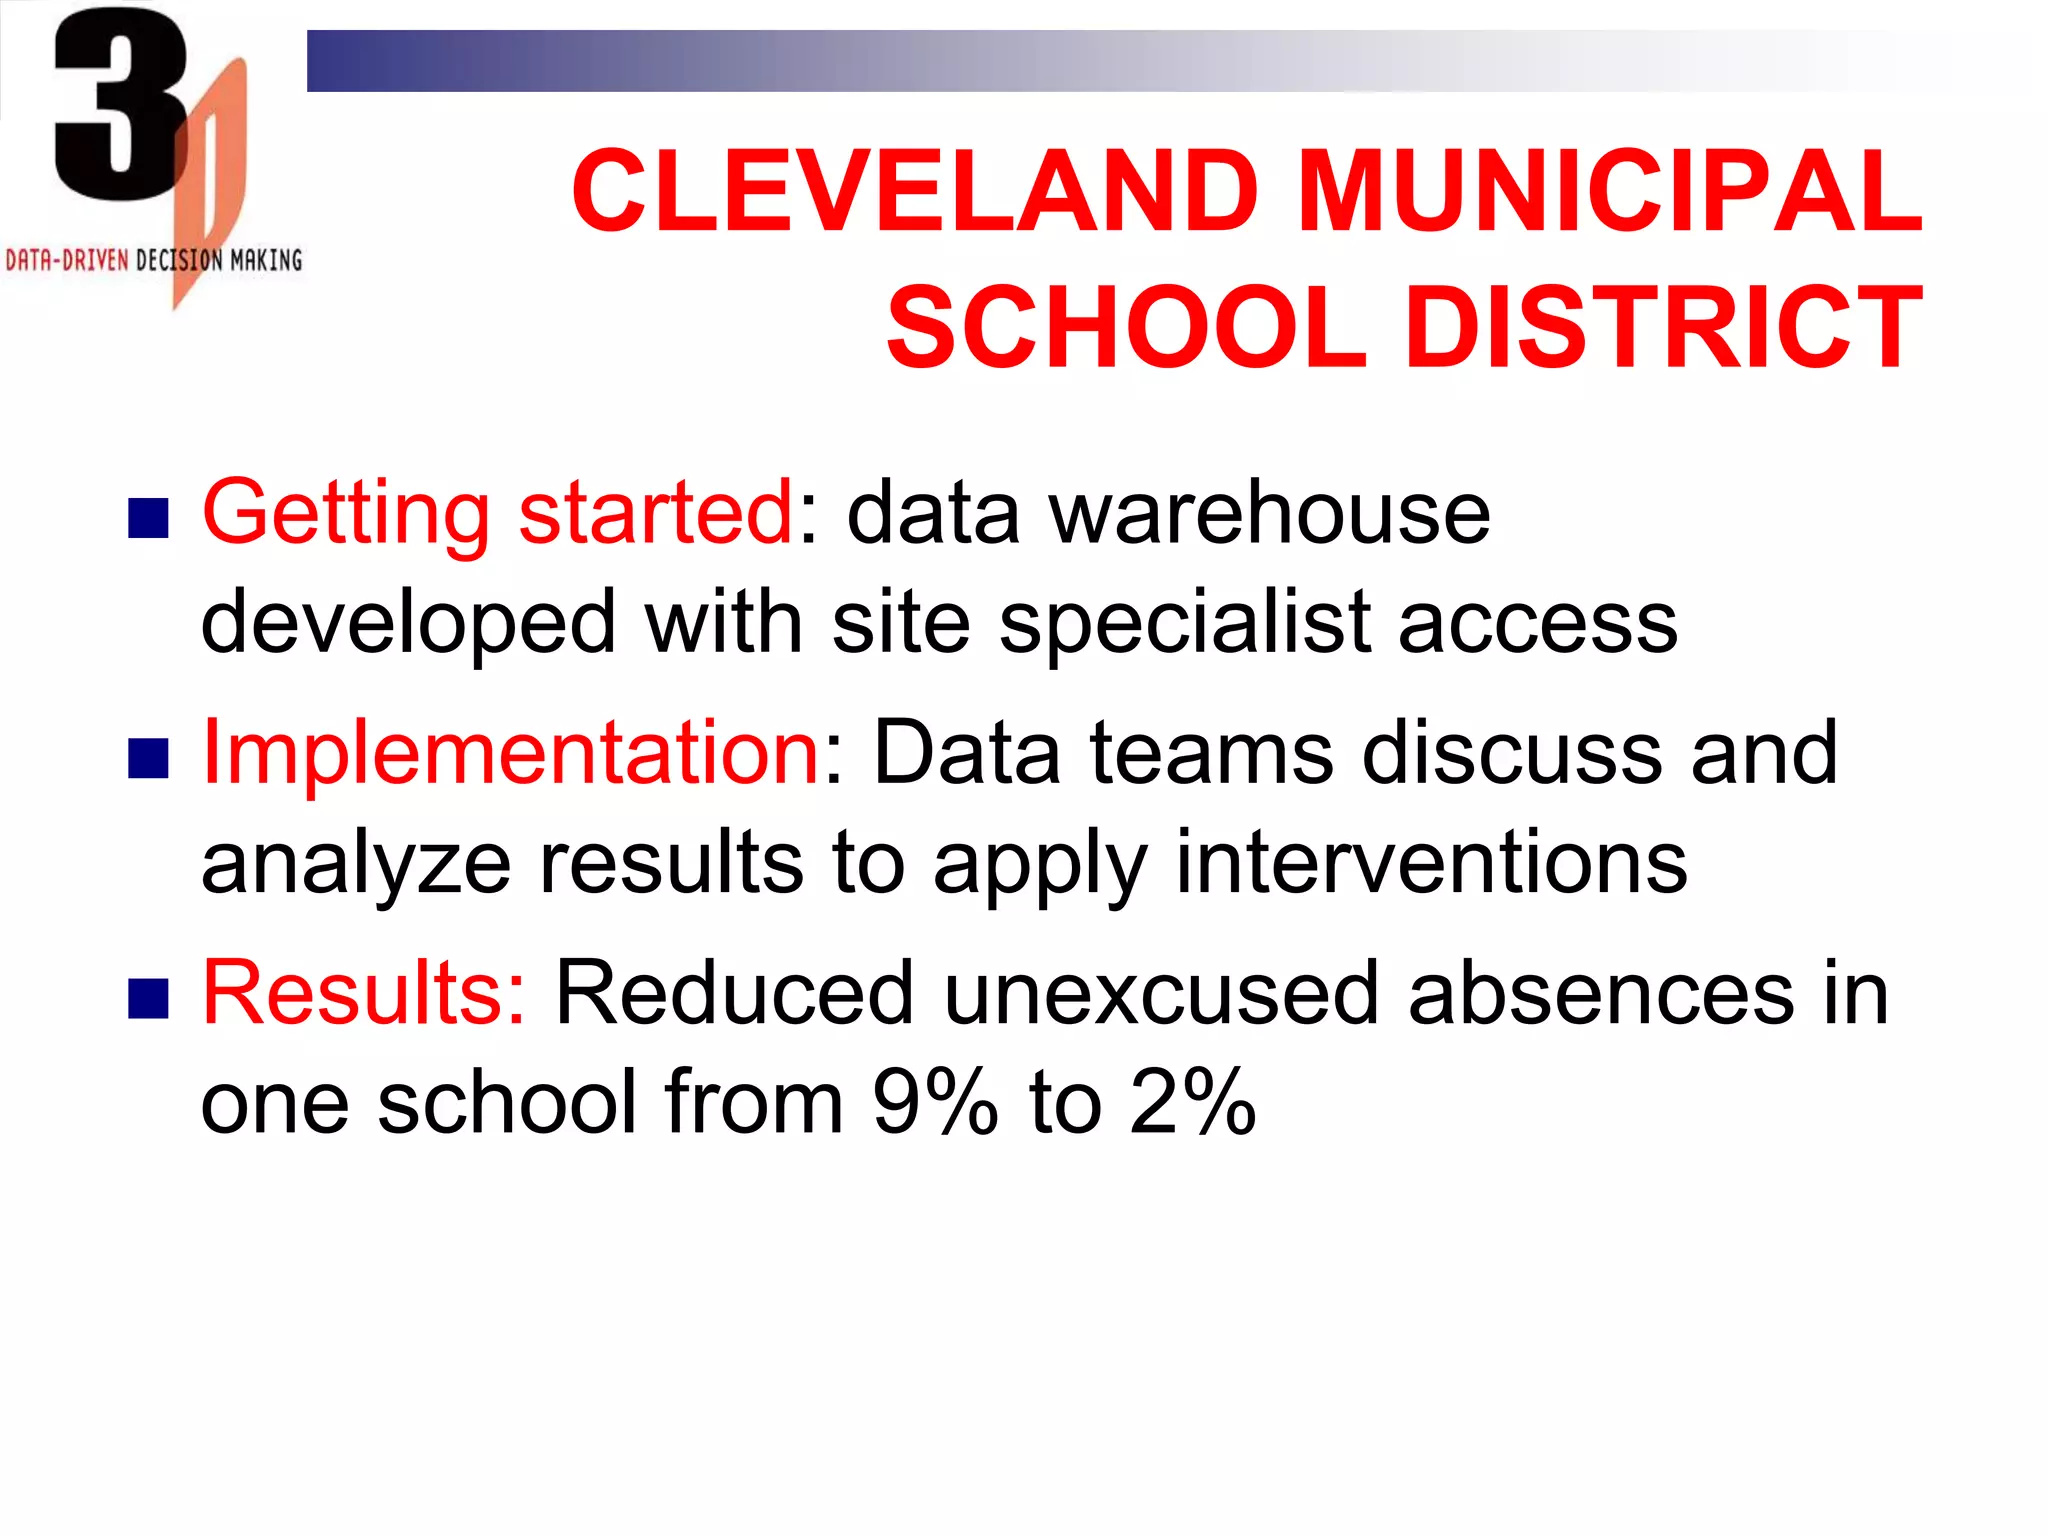
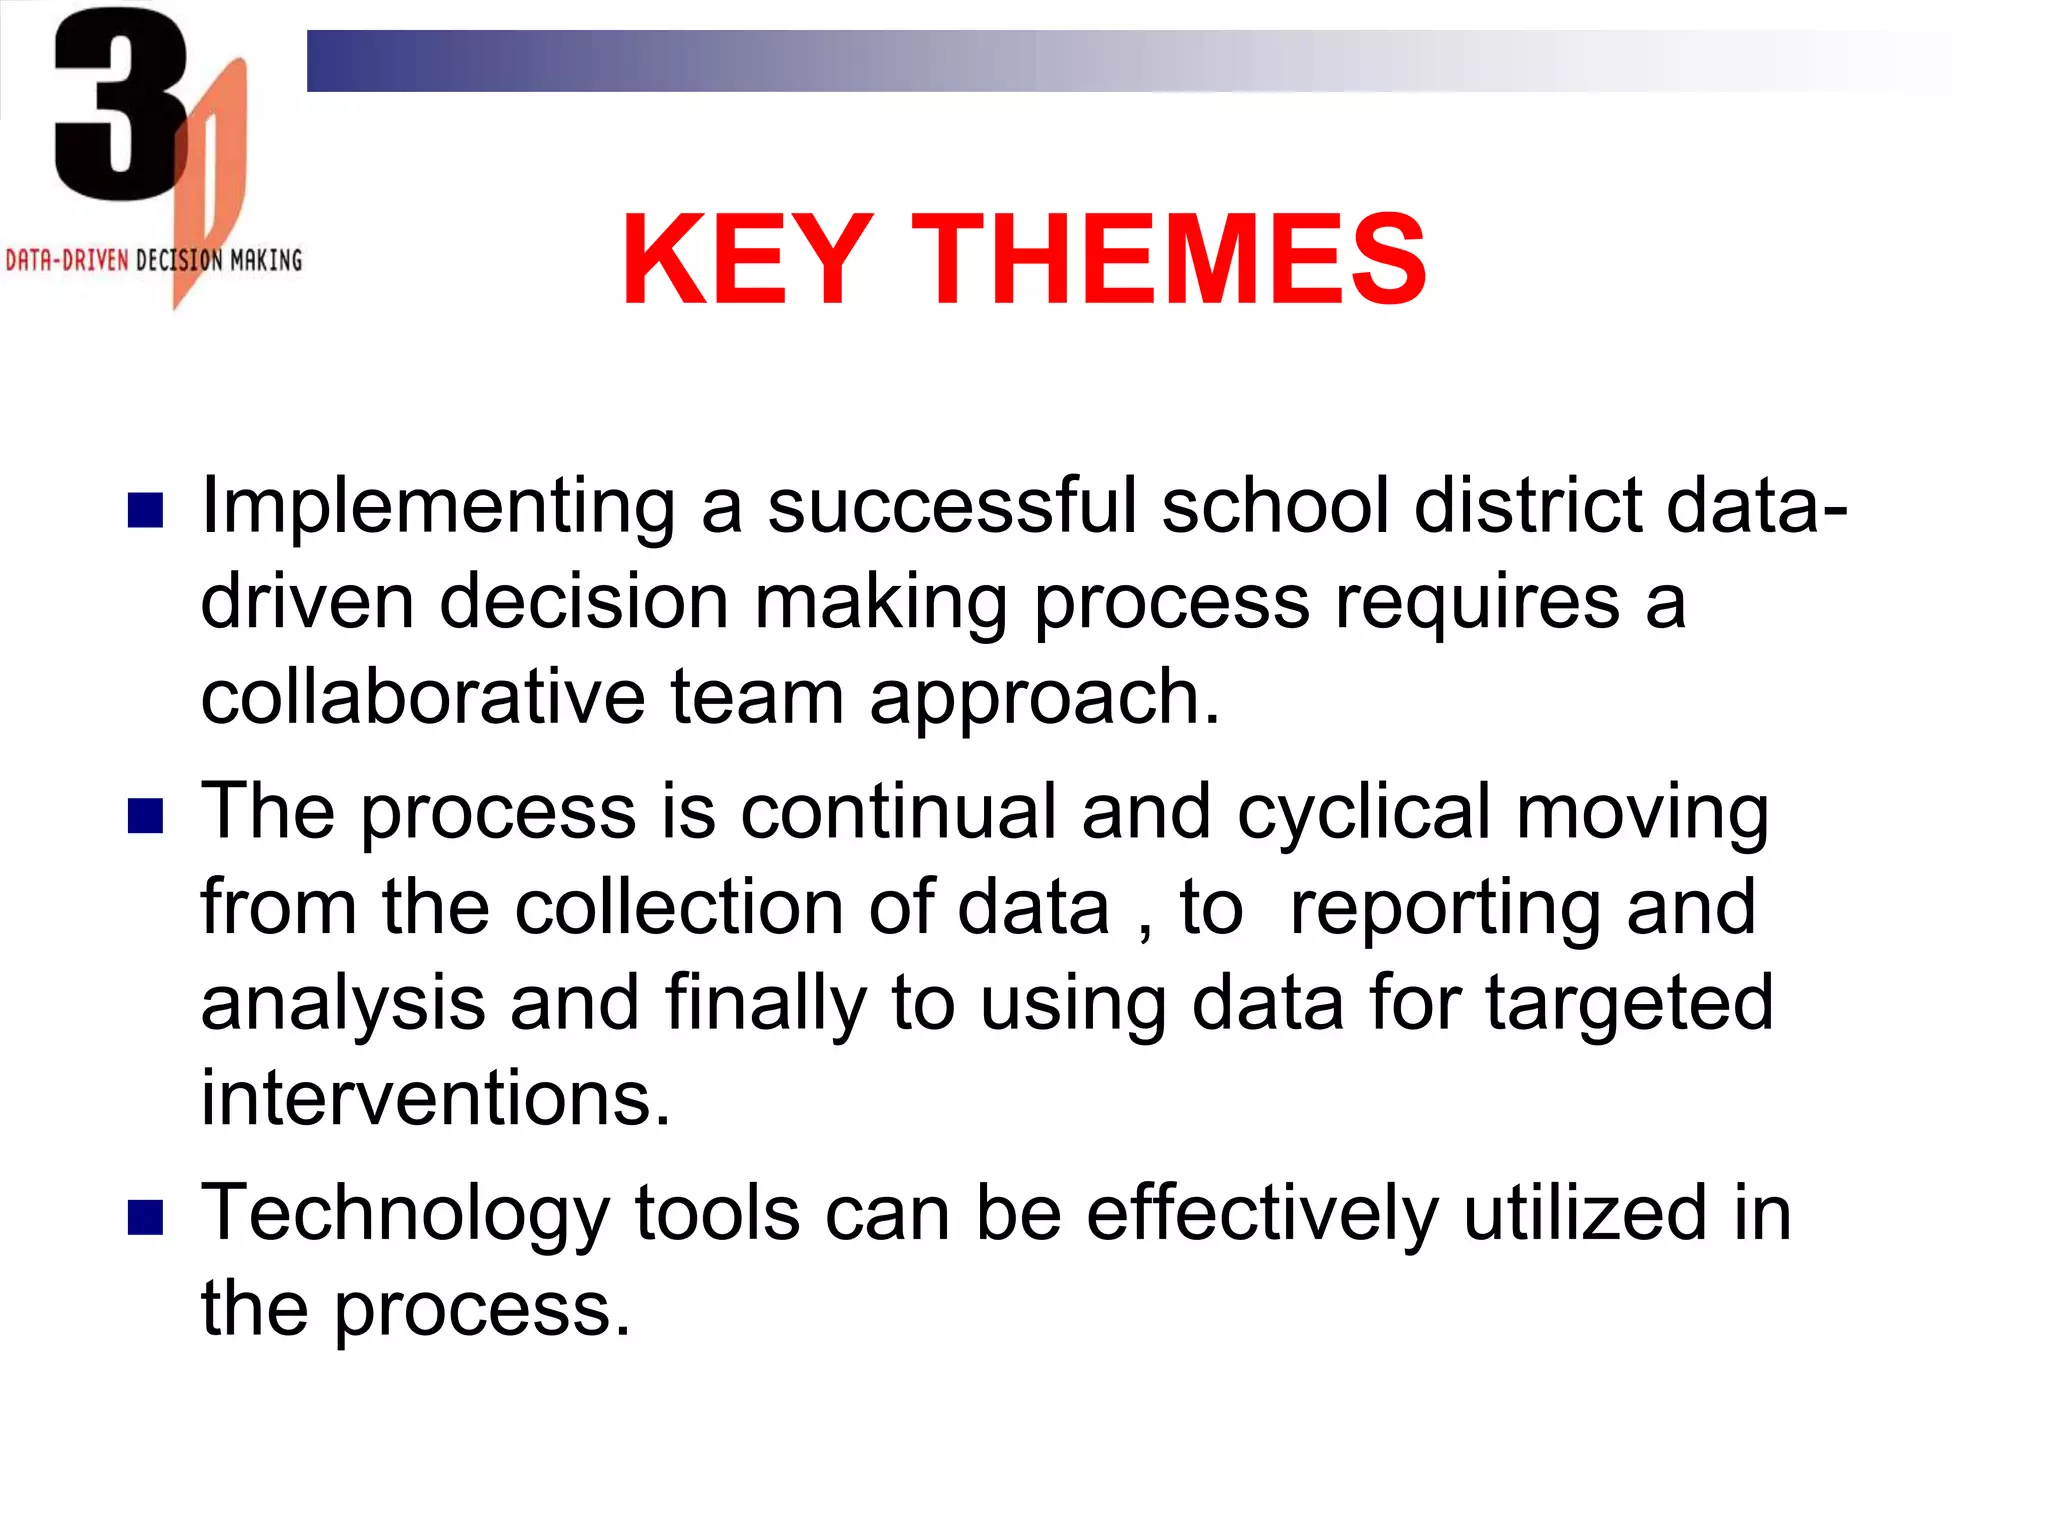
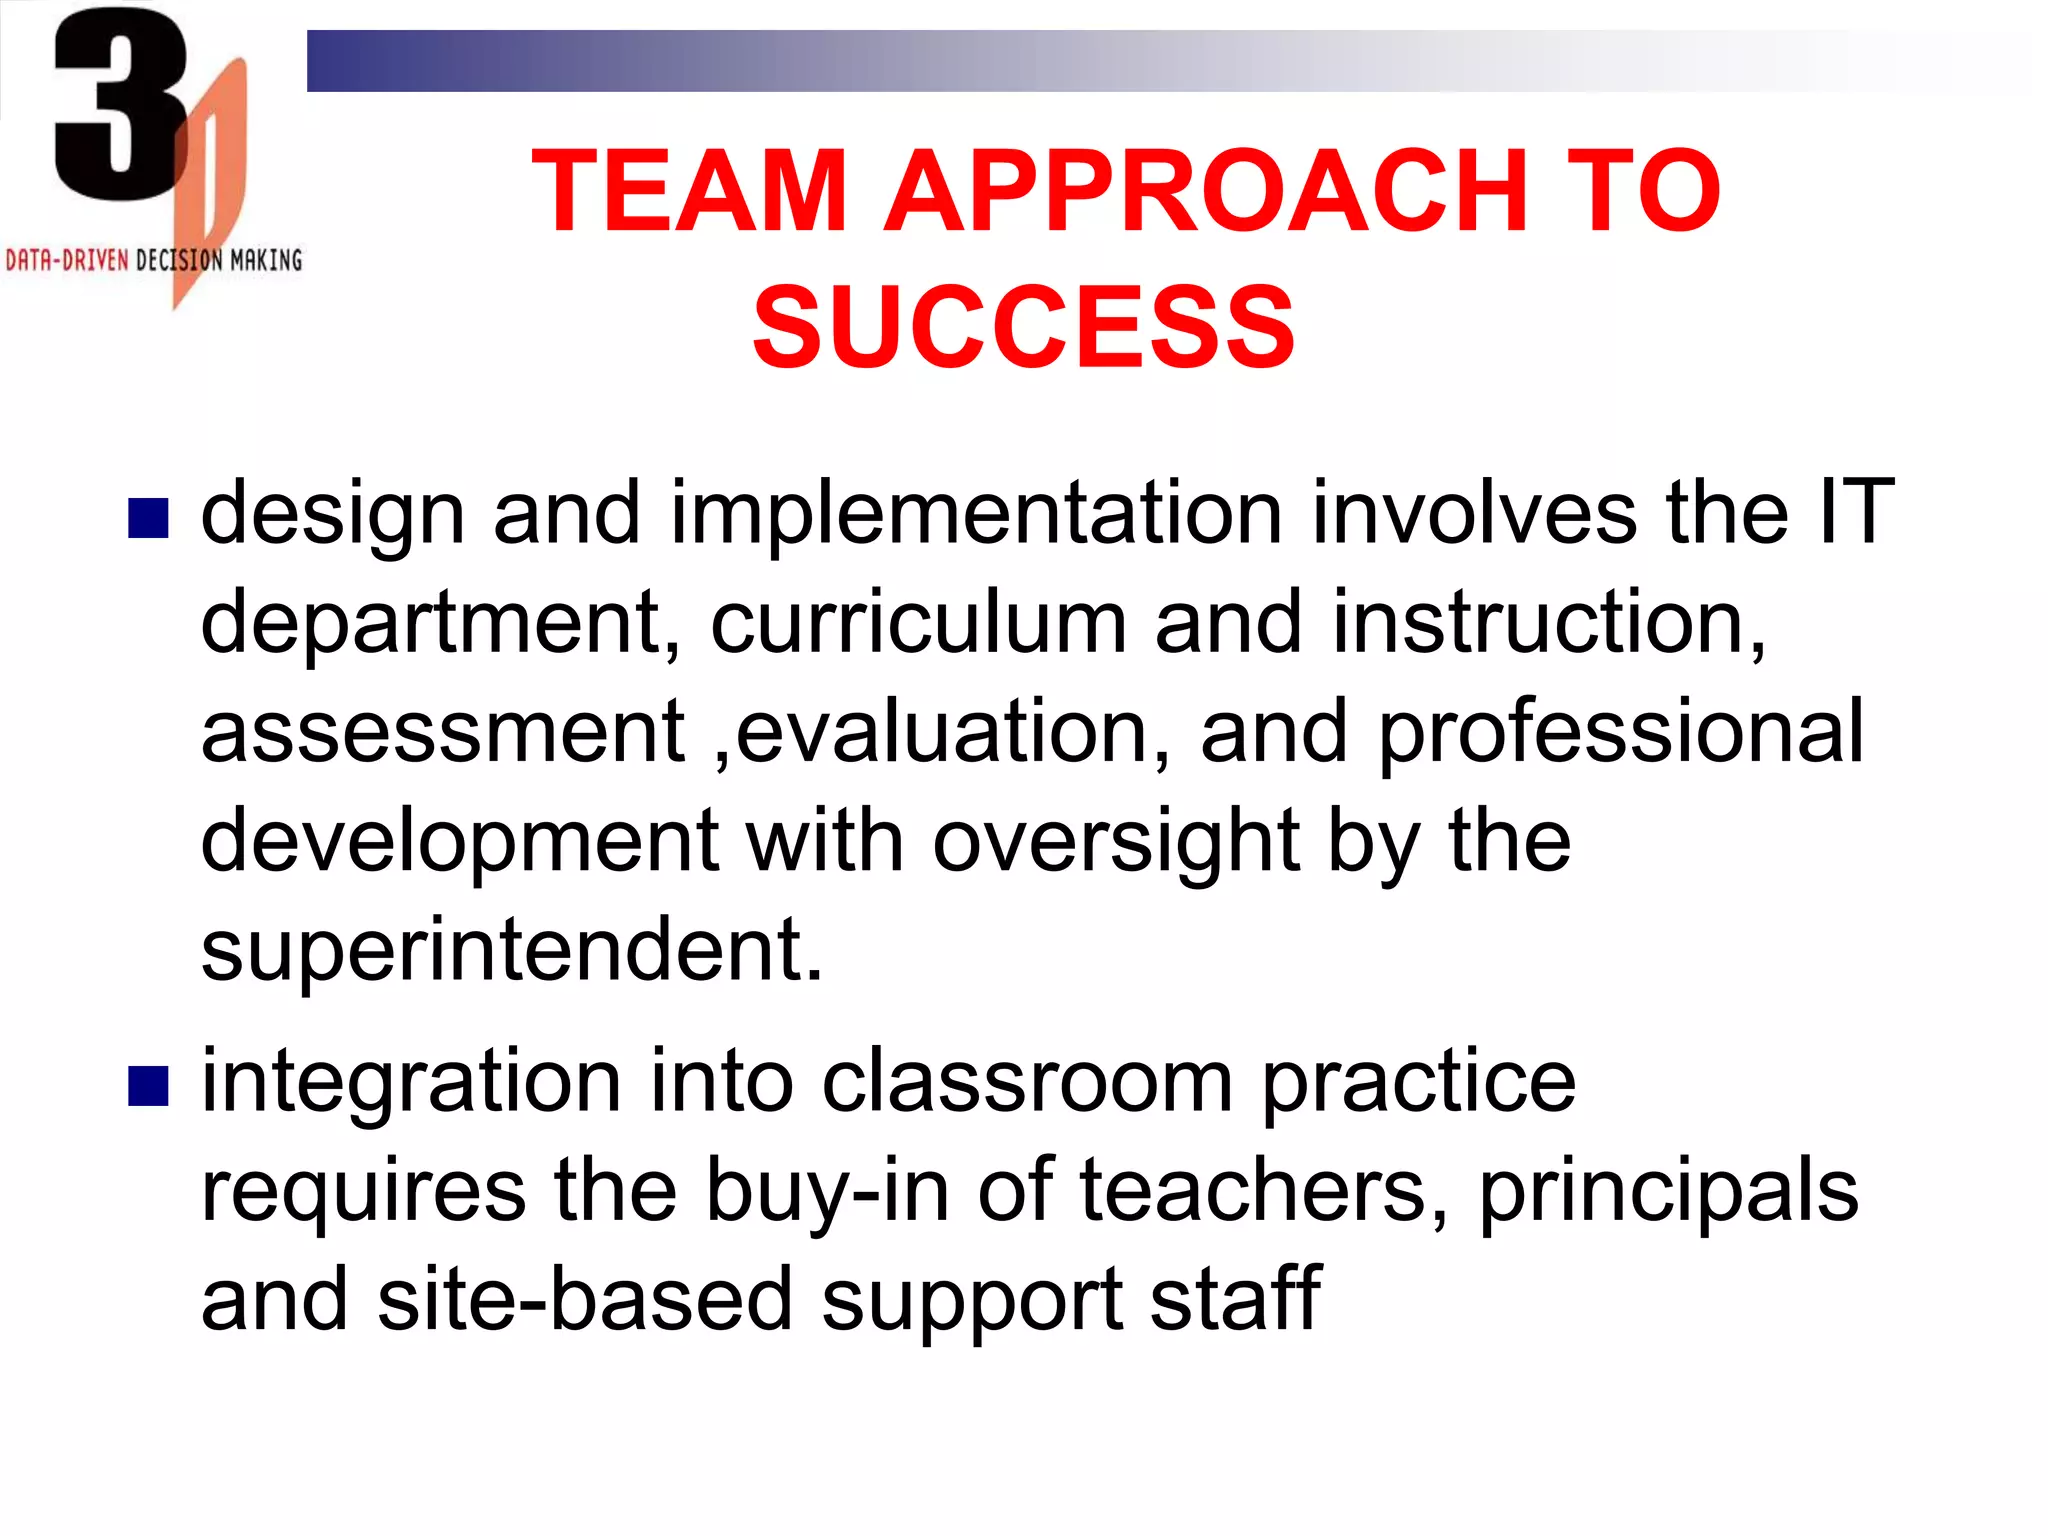
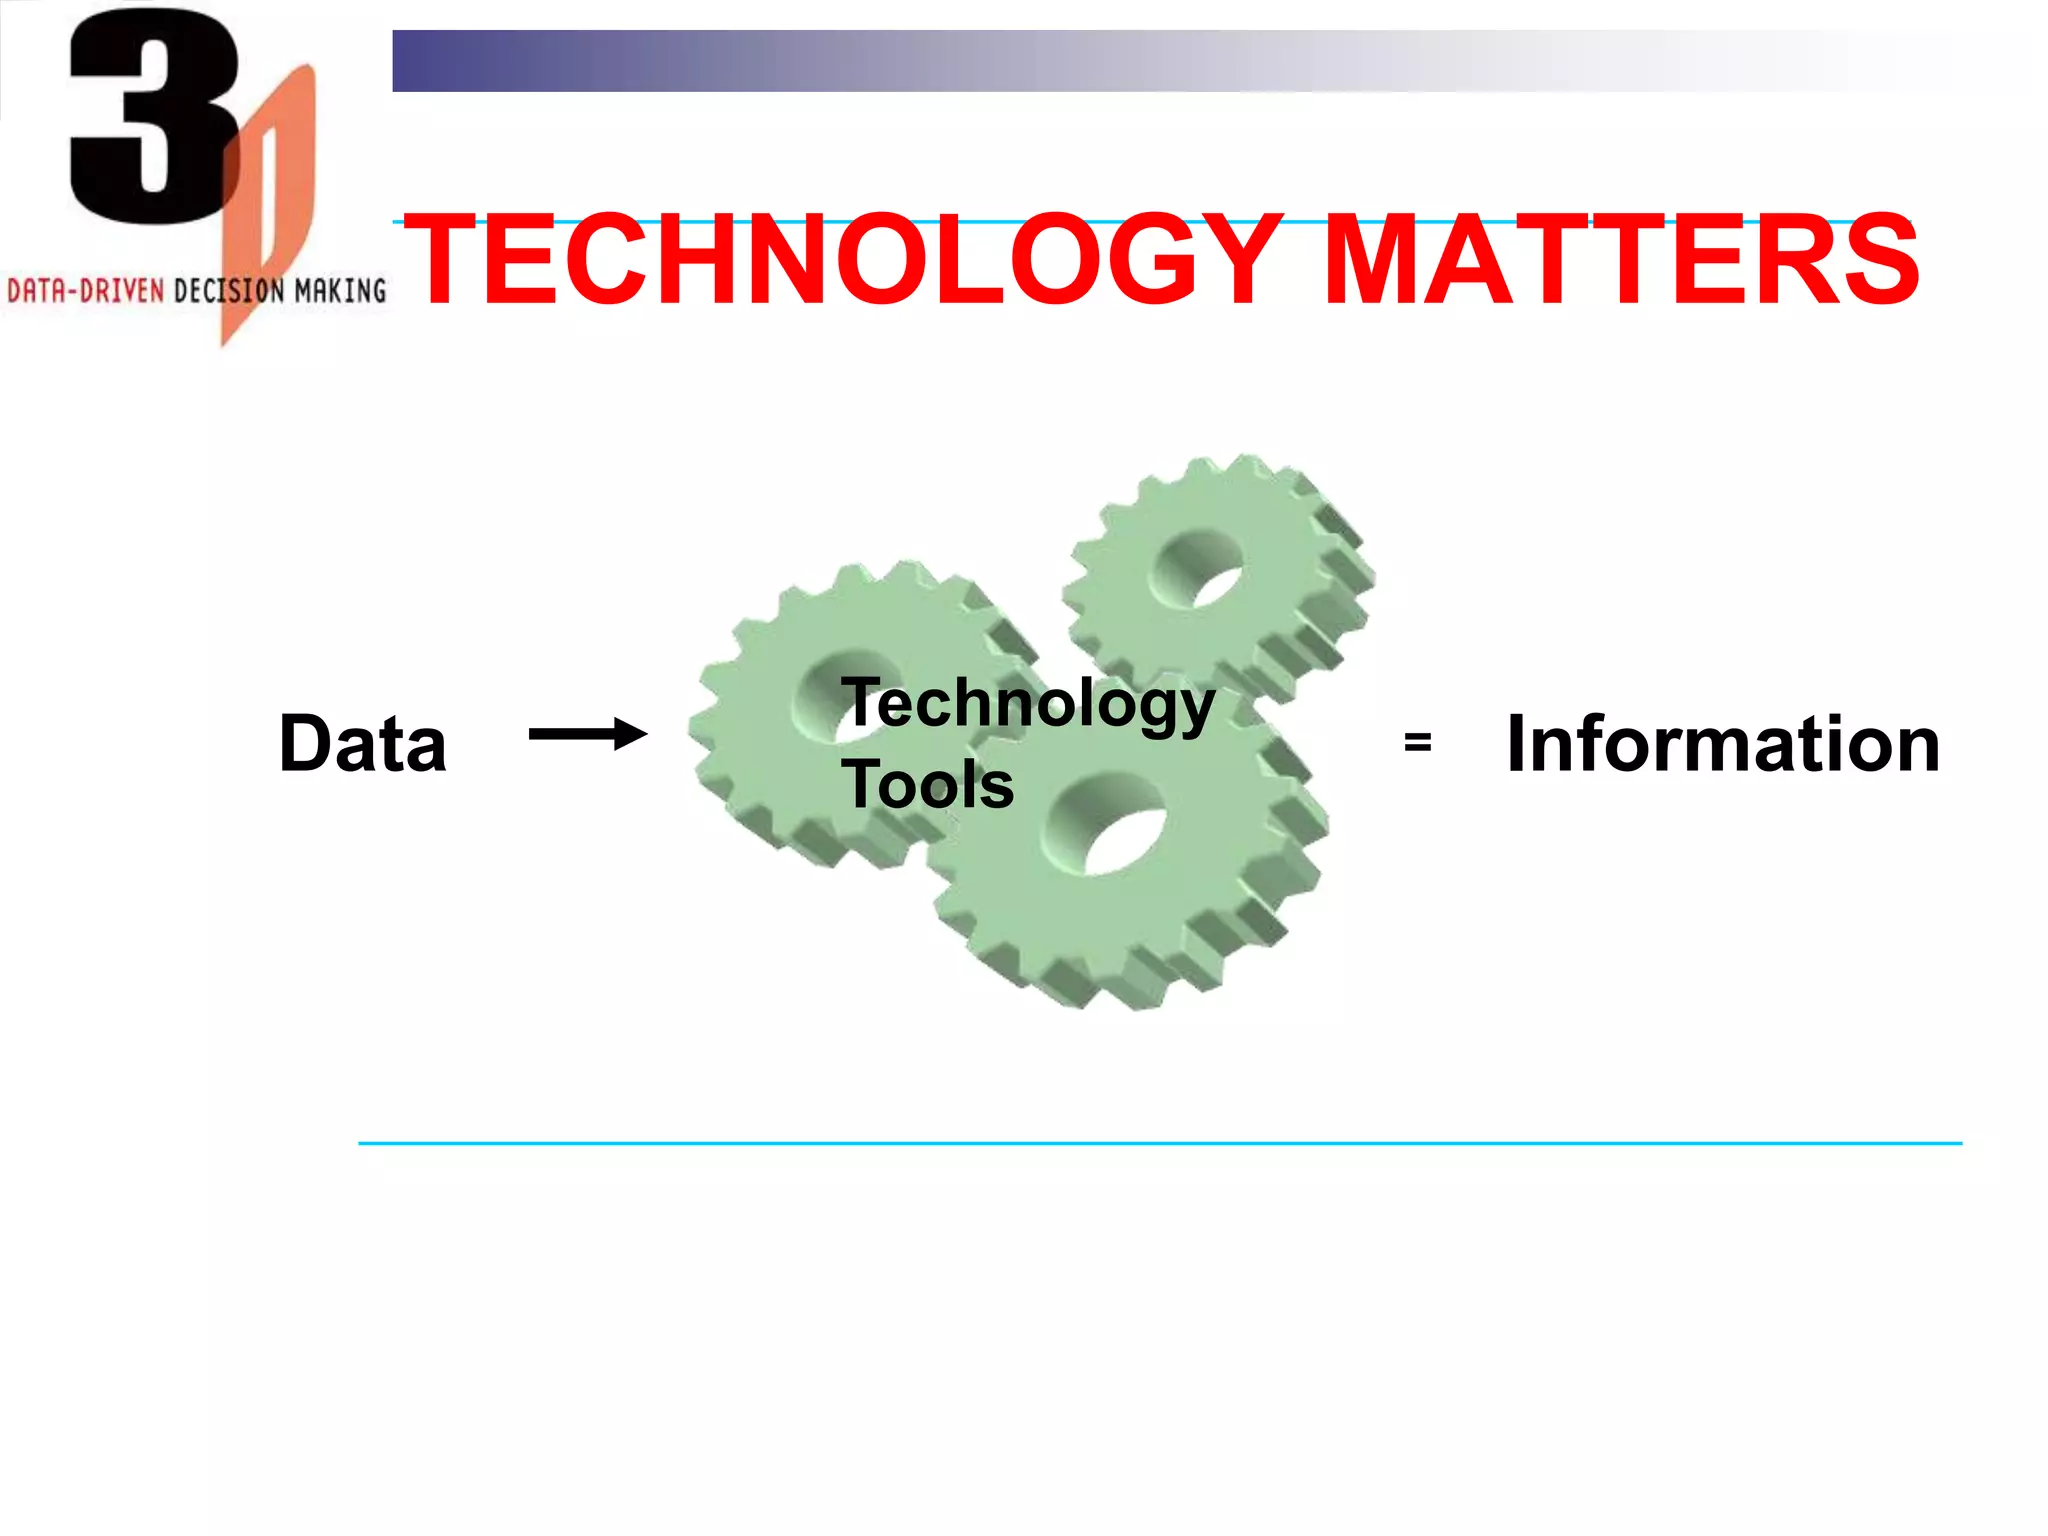
WORKSHOP # 2Vision to Know and Do :Helping Educators Use Data EffectivelyASBO  International 2005 Annual MeetingFRIDAY, OCTOBER 21, 2005Boston, MA
WORKSHOP AGENDALearning about CoSN’s Data-driven Decision Making Initiative: Vision to Know and DoSmall Group ExerciseReporting Out and Reaching Consensus
VISION TO KNOW AND DOwww.3d2know.org	Launched in 2003 by CoSN to help educators use data effectively. This initiative is : a  highly-respected source of up-to-date, unbiased information
an easy to use mechanism for educating school leaders
a nationally-recognized framework for sharing knowledgeSupported by Founding Partners ETS, IBM and SAS with additional support from Co-nect, Dell, Pearson Education, Plato Learning; PowerSchool , SchoolNet, and Texas Instruments. Scholastic Administr@tor is the  Media Partner.
DEFINITIONData-Driven Decision Making	A process of making choices based on appropriate analysis of relevant information
DATA DRIVEN DECISION MAKING PROCESSDetermine your desired outcome Define your business processes Identify data available
VISION TO KNOW AND DOReleased Vision to Know and Do: The Power of Data as a Tool in Educational Decision Making and From Vision to Action: How School Districts Use Data to Improve Performance ,in depth examinations of the issue Created a rich website, www.3d2know.orgDeveloped a self assessment tool to  estimate a district’s readiness to use data-driven decision models Convened a Congressional Seminars in Washington, DC Issued quarterly newsletter, Vision to Know and Do newsletter
CURRENT CONTEXTData collection, analysis and reporting are critical components of No Child Left Behind (NCLB).School districts must collect more data, in more detail and disaggregate them.State-level systems and support are being developed for collecting and integrating student assessment data with demographic information.
NATIONAL EDUCATION TECHNOLOGY PLAN	TowardA New Golden Age in American Educationcalls upon states, districts and schools to establish a plan to integrate data systems; use data from both administrative and instructional systems to understand relationships; ensure interoperability;  and use assessment results to inform instruction.
NCLB "Information is the key to holding schools accountable for improved performance every year among every student group…Data is our best management tool.  I often say that what gets measured, gets done.  If we know the contours of the problem, and who is affected, we can put forward a solution.  Teachers can adjust lesson plans.  Administrators can evaluate curricula.  Data can inform decision-making.  Thanks to No Child Left Behind, we're no longer flying blind."  Secretary of Education Margaret Spellings
MOVING BEYOND THE MANDATECurrent environment is an opportunity to:use data  to transform teaching, learning and administration. inform decisions about everything from class schedules to textbook reading levels to professional development budgets. provide a rationale for decisions that parents, teachers, taxpayers, and students can understand.
TEN REASONS TO BRING DATA INTO DECISIONSAssess the current and future needs of studentsDecide what to changeDetermine if goals are being metEngage in continuous school improvementIdentify root causes of problemsAlign instruction to standards.Provide personalized instruction.Track professional developmentMeet accountability provisions of NCLBKeep constituents informed about progress.
DATA AND HURRICANE KATRINAThe Mississippi Student Information System—which stores the past four years of student records—is serving as a backup for districts that have lost crucial equipment and software, and the information they contain. Mississippi districts receiving evacuated students from other districts in the state are tapping the state’s database for course records, grades, Carnegie units, and special classifications, thus smoothing those students’ transitions into new schools.
 Perceived Benefits of Technology  (Digital Leadership Divide,CoSN/Grunwald Associates Survey)
SmallMediumLarge TotalDATA-DRIVEN DECISION MAKINGDistricts That  Employ A Data-driven Decision Making Process(Digital Leadership Divide: CoSN/Grunwald Survey)
CHANGING THE MINDSETWhy does education data make educators so uncomfortable? To only slightly exaggerate, for the past 150 years data was something a third party required you to gather about yourself so they could embarrass you with it three months later. Or so teachers and administrators believed. Data was something higher-ups would use to catch you doing something wrong. No longer. As Montgomery County MD Superintendent Jerry Weast elegantly says, in his district, he uses data to catch you doing something right. That’s the good news. The better news is that the idea is catching on.
Vision to Know and DoThe Power of Data as a Tool inEducational Decision MakingHighlights school districts using data analysis systems to improve student outcomes
Identifies factors for successfully integrating data into decision making processes
Calls for more emphasis on data-driven decision making as a way to prepare students with 21st century educational skillsData Rich DistrictsBaldrige winners are examples of school districts moving a step beyond of NCLB requirements by integrating data reporting into a culture of continuous improvement.
Data Rich District:Rural Response to Local ExpectationsName: Chugach School DistrictLocation: Prince William Sound, AlaskaEnrollment: 214 students
Chugach Improvement ProcessCreate a snapshot of the current status
Hold town meetings to shape a shared vision
Implement balanced instructional model
Write standards in a continuum from pre-kindergarten through 16
Determine assessments aligned to standards
Change reporting process for children, parents, teachers
Phase in with continuous improvementData Rich District:Integrated PlanningName: Community Consolidated School District 15Location: Palatine, Illinois, northwest of ChicagoEnrollment: 13,000 students
CCSD15 Improvement ProcessSet measurable goals and targets
Collect data using electronic methods
Deliver information to decision makers (classroom, building, district)
Identify clearly levels of performance and opportunities for improvementData Rich District:Students Choose Public SchoolsName: Pearl River School DistrictLocation:  Rockland County, New York Enrollment: 2,467 students
Define district goals, objectives and projectsCollect data using format and informal check pointsCheck stakeholder satisfactionAnalyze promptly and share resultsCompile analyses annuallyEvaluate performance and achievementPearl River Improvement Process
Data Rich Districts:Lessons LearnedIt takes time.
It has to start at the top.
Progress has to be measurable
Business models are starting points.
Community outreach is essential.
Data –driven decision making can be a powerful tool in changing student outcomes and promoting continuous improvement. NEW!!From Vision to Action: How School Districts Use Data to Improve Performancefor school district leaders and K-12 educators seeking ways to implement a data-driven decision making process
DATA RICH DISTRICTSFrom Vision to Action draws from interviews with more than 30 experts around the country  Detailed profiles of Lemon Grove School District (CA), Fulton County Schools (GA) and Cleveland Municipal School District (OH). Profiles and examples  in From Vision to Action provide others with examples and techniques.
DISTRICTS INTERVIEWED*Indicates 2003-2004 enrollment.
FULTON COUNTY, GAGetting started: District wide strategic planning process in placeImplementation: Cross functional teams help school site with data use and analysisResults: All elementary schools met AYP targets in 2003-4
LEMON GROVEGetting started: ubiquitous access to technology and focus on literacyImplementation: easy to use reports of multiple measuresResults: 3 out of 4 Title I schools declared high achieving
CLEVELAND MUNICIPAL SCHOOL DISTRICTGetting started: data warehouse developed with site specialist accessImplementation: Data teams discuss and analyze results to apply interventionsResults: Reduced unexcused absences in one school from 9% to 2%
KEY THEMESImplementing a successful school district data-driven decision making process requires a collaborative team approach. The process is continual and cyclical moving from the collection of data , to  reporting and analysis and finally to using data for targeted interventions.Technology tools can be effectively utilized in the process.
TEAM APPROACH TO SUCCESSdesign and implementation involves the IT department, curriculum and instruction, assessment ,evaluation, and professional development with oversight by the superintendent. integration into classroom practice requires the buy-in of teachers, principals and site-based support staff
Technology ToolsDataInformation=TECHNOLOGY MATTERS
TECHNOLOGY MATTERSTechnology is constantly changing Information is the result of passing Data through Technology Tools Technology, by itself, has no value Results are primary goal
ApplicationsSISAssessmentFinanceInstructionComponents of a Data Based Decision Making SystemSchool Interoperability Framework & IMSReporting and Analysis ServicesTurning data into useful informationDisseminationSharing data with the community (ie: report cards)Data WarehouseReportsState and Federal ReportingMeeting reporting complianceTrainingLearning how to use data to make informed decisions.Personalized InstructionSource: US Department of Education, 2003.
DATA DRIVEN DECISION MAKING PROCESSA process of three functional areas:collection, integration and dissemination of data;analysis and reporting of data; and process and procedures for acting on the data.
DATA COLLECTION AND INTEGRATION CHECKLISTIs a data warehouse in place?
Are the technical and human support tools in place to move data from warehouse to schoolhouse?
Are systems developed to integrate data into instruction?

Data Collection

  • 1.
    WORKSHOP # 2Visionto Know and Do :Helping Educators Use Data EffectivelyASBO International 2005 Annual MeetingFRIDAY, OCTOBER 21, 2005Boston, MA
  • 2.
    WORKSHOP AGENDALearning aboutCoSN’s Data-driven Decision Making Initiative: Vision to Know and DoSmall Group ExerciseReporting Out and Reaching Consensus
  • 3.
    VISION TO KNOWAND DOwww.3d2know.org Launched in 2003 by CoSN to help educators use data effectively. This initiative is : a highly-respected source of up-to-date, unbiased information
  • 4.
    an easy touse mechanism for educating school leaders
  • 5.
    a nationally-recognized frameworkfor sharing knowledgeSupported by Founding Partners ETS, IBM and SAS with additional support from Co-nect, Dell, Pearson Education, Plato Learning; PowerSchool , SchoolNet, and Texas Instruments. Scholastic Administr@tor is the Media Partner.
  • 6.
    DEFINITIONData-Driven Decision Making Aprocess of making choices based on appropriate analysis of relevant information
  • 7.
    DATA DRIVEN DECISIONMAKING PROCESSDetermine your desired outcome Define your business processes Identify data available
  • 8.
    VISION TO KNOWAND DOReleased Vision to Know and Do: The Power of Data as a Tool in Educational Decision Making and From Vision to Action: How School Districts Use Data to Improve Performance ,in depth examinations of the issue Created a rich website, www.3d2know.orgDeveloped a self assessment tool to estimate a district’s readiness to use data-driven decision models Convened a Congressional Seminars in Washington, DC Issued quarterly newsletter, Vision to Know and Do newsletter
  • 9.
    CURRENT CONTEXTData collection,analysis and reporting are critical components of No Child Left Behind (NCLB).School districts must collect more data, in more detail and disaggregate them.State-level systems and support are being developed for collecting and integrating student assessment data with demographic information.
  • 10.
    NATIONAL EDUCATION TECHNOLOGYPLAN TowardA New Golden Age in American Educationcalls upon states, districts and schools to establish a plan to integrate data systems; use data from both administrative and instructional systems to understand relationships; ensure interoperability;  and use assessment results to inform instruction.
  • 11.
    NCLB "Information isthe key to holding schools accountable for improved performance every year among every student group…Data is our best management tool.  I often say that what gets measured, gets done.  If we know the contours of the problem, and who is affected, we can put forward a solution.  Teachers can adjust lesson plans.  Administrators can evaluate curricula.  Data can inform decision-making.  Thanks to No Child Left Behind, we're no longer flying blind."  Secretary of Education Margaret Spellings
  • 12.
    MOVING BEYOND THEMANDATECurrent environment is an opportunity to:use data to transform teaching, learning and administration. inform decisions about everything from class schedules to textbook reading levels to professional development budgets. provide a rationale for decisions that parents, teachers, taxpayers, and students can understand.
  • 13.
    TEN REASONS TOBRING DATA INTO DECISIONSAssess the current and future needs of studentsDecide what to changeDetermine if goals are being metEngage in continuous school improvementIdentify root causes of problemsAlign instruction to standards.Provide personalized instruction.Track professional developmentMeet accountability provisions of NCLBKeep constituents informed about progress.
  • 14.
    DATA AND HURRICANEKATRINAThe Mississippi Student Information System—which stores the past four years of student records—is serving as a backup for districts that have lost crucial equipment and software, and the information they contain. Mississippi districts receiving evacuated students from other districts in the state are tapping the state’s database for course records, grades, Carnegie units, and special classifications, thus smoothing those students’ transitions into new schools.
  • 15.
    Perceived Benefitsof Technology (Digital Leadership Divide,CoSN/Grunwald Associates Survey)
  • 16.
    SmallMediumLarge TotalDATA-DRIVEN DECISIONMAKINGDistricts That Employ A Data-driven Decision Making Process(Digital Leadership Divide: CoSN/Grunwald Survey)
  • 17.
    CHANGING THE MINDSETWhydoes education data make educators so uncomfortable? To only slightly exaggerate, for the past 150 years data was something a third party required you to gather about yourself so they could embarrass you with it three months later. Or so teachers and administrators believed. Data was something higher-ups would use to catch you doing something wrong. No longer. As Montgomery County MD Superintendent Jerry Weast elegantly says, in his district, he uses data to catch you doing something right. That’s the good news. The better news is that the idea is catching on.
  • 18.
    Vision to Knowand DoThe Power of Data as a Tool inEducational Decision MakingHighlights school districts using data analysis systems to improve student outcomes
  • 19.
    Identifies factors forsuccessfully integrating data into decision making processes
  • 20.
    Calls for moreemphasis on data-driven decision making as a way to prepare students with 21st century educational skillsData Rich DistrictsBaldrige winners are examples of school districts moving a step beyond of NCLB requirements by integrating data reporting into a culture of continuous improvement.
  • 21.
    Data Rich District:RuralResponse to Local ExpectationsName: Chugach School DistrictLocation: Prince William Sound, AlaskaEnrollment: 214 students
  • 22.
    Chugach Improvement ProcessCreatea snapshot of the current status
  • 23.
    Hold town meetingsto shape a shared vision
  • 24.
  • 25.
    Write standards ina continuum from pre-kindergarten through 16
  • 26.
  • 27.
    Change reporting processfor children, parents, teachers
  • 28.
    Phase in withcontinuous improvementData Rich District:Integrated PlanningName: Community Consolidated School District 15Location: Palatine, Illinois, northwest of ChicagoEnrollment: 13,000 students
  • 29.
    CCSD15 Improvement ProcessSetmeasurable goals and targets
  • 30.
    Collect data usingelectronic methods
  • 31.
    Deliver information todecision makers (classroom, building, district)
  • 32.
    Identify clearly levelsof performance and opportunities for improvementData Rich District:Students Choose Public SchoolsName: Pearl River School DistrictLocation: Rockland County, New York Enrollment: 2,467 students
  • 33.
    Define district goals,objectives and projectsCollect data using format and informal check pointsCheck stakeholder satisfactionAnalyze promptly and share resultsCompile analyses annuallyEvaluate performance and achievementPearl River Improvement Process
  • 34.
    Data Rich Districts:LessonsLearnedIt takes time.
  • 35.
    It has tostart at the top.
  • 36.
    Progress has tobe measurable
  • 37.
    Business models arestarting points.
  • 38.
  • 39.
    Data –driven decisionmaking can be a powerful tool in changing student outcomes and promoting continuous improvement. NEW!!From Vision to Action: How School Districts Use Data to Improve Performancefor school district leaders and K-12 educators seeking ways to implement a data-driven decision making process
  • 40.
    DATA RICH DISTRICTSFromVision to Action draws from interviews with more than 30 experts around the country Detailed profiles of Lemon Grove School District (CA), Fulton County Schools (GA) and Cleveland Municipal School District (OH). Profiles and examples in From Vision to Action provide others with examples and techniques.
  • 41.
  • 42.
    FULTON COUNTY, GAGettingstarted: District wide strategic planning process in placeImplementation: Cross functional teams help school site with data use and analysisResults: All elementary schools met AYP targets in 2003-4
  • 43.
    LEMON GROVEGetting started:ubiquitous access to technology and focus on literacyImplementation: easy to use reports of multiple measuresResults: 3 out of 4 Title I schools declared high achieving
  • 44.
    CLEVELAND MUNICIPAL SCHOOLDISTRICTGetting started: data warehouse developed with site specialist accessImplementation: Data teams discuss and analyze results to apply interventionsResults: Reduced unexcused absences in one school from 9% to 2%
  • 45.
    KEY THEMESImplementing asuccessful school district data-driven decision making process requires a collaborative team approach. The process is continual and cyclical moving from the collection of data , to reporting and analysis and finally to using data for targeted interventions.Technology tools can be effectively utilized in the process.
  • 46.
    TEAM APPROACH TOSUCCESSdesign and implementation involves the IT department, curriculum and instruction, assessment ,evaluation, and professional development with oversight by the superintendent. integration into classroom practice requires the buy-in of teachers, principals and site-based support staff
  • 47.
  • 48.
    TECHNOLOGY MATTERSTechnology isconstantly changing Information is the result of passing Data through Technology Tools Technology, by itself, has no value Results are primary goal
  • 49.
    ApplicationsSISAssessmentFinanceInstructionComponents of aData Based Decision Making SystemSchool Interoperability Framework & IMSReporting and Analysis ServicesTurning data into useful informationDisseminationSharing data with the community (ie: report cards)Data WarehouseReportsState and Federal ReportingMeeting reporting complianceTrainingLearning how to use data to make informed decisions.Personalized InstructionSource: US Department of Education, 2003.
  • 50.
    DATA DRIVEN DECISIONMAKING PROCESSA process of three functional areas:collection, integration and dissemination of data;analysis and reporting of data; and process and procedures for acting on the data.
  • 51.
    DATA COLLECTION ANDINTEGRATION CHECKLISTIs a data warehouse in place?
  • 52.
    Are the technicaland human support tools in place to move data from warehouse to schoolhouse?
  • 53.
    Are systems developedto integrate data into instruction?
  • 54.
    Are teachers usingassessments to measure progress?
  • 55.
    Are curriculum andassessments aligned to standards? DATA ANALYSIS CHECKLISTDo teachers have access to data in an easy-to-use format soon after assessment?
  • 56.
    Does the districtsupport the process with analytical tools and trained staff to give decision makers confidence in the data and tools?
  • 57.
    Are teachers trainedto use item analysis to understand student outcomes and instructional effectiveness?USING DATA CHECKLISTDoes the district provide the tools and training to interpret and query data?
  • 58.
    Have data teamsdeveloped a process for identifying, recommending and implementing intervention based on data?
  • 59.
    Do district andschool-site change agents support teachers and their use of targeted interventions?PROGRESS IN DATA DRIVEN DECISION MAKINGMajority of districts are making progress in collection of data and most are working towards analysis and reporting. Challenging task remains providing teachers with proven strategies for targeted interventions in the classroom.
  • 60.
  • 61.
  • 62.
    Lack of understandingabout what to do with the data 39%
  • 63.
    Absence of clearpriorities 36%
  • 64.
    Failure to collectdata uniformly 35% FAILURE TO COLLECT DATA UNIFORMLYCapture data to meet requirements7% no action, 28% early, 20% proficientExtract data for analysis 12% no action, 35% early, 15% proficientProcess for intervention strategies12% no action, 35% early, 13% proficientNot just a tech issue: alignment and leadership are essential*CoSN Self Assessment Tool.
  • 66.
    LESSONS LEARNEDSelect yourtechnology team based on expertise and ability to perform Technologies employed must be based on the business goals and not the other way around Let the technology team do their job with frequent check points to the business model
  • 67.
    ONLINE ASSESSMENT TOOLTakea simple 10-question assessment is available at 3d2know.cosn.org/assessment/survey.cfmReceive an immediate response Learn where you are in the process of becoming a data rich district
  • 68.
    NEW: FAQ’SVisit www.3d2know.orgViewthe full list of FAQ’sComing Soon: Moderated discussion around these questions
  • 69.
  • 70.
  • 71.
  • 72.
  • 73.
    Subscribe to theNewsletterGROUP EXERCISE # 1Select a problem that you are currently facing in your school or school districtIndicate the types of data you will need to make a decision Identify how you will proceed Come up with an implementation plan, including barriers encountered
  • 74.
    GROUP EXERCISE #2Reportout your findingsShare your experiencesCapture the findings ---We want to present these to a larger audience and post on www.3d2know.org
  • 75.
    ABOUT COSNCoSN Mission To promote the use of information technologies and the Internet to ensure technology has a positive effect on learning by focusing on leadership development, coalition building, advocacy and emerging technologies. Audience Key technology leaders at the school district, state and national level
  • 76.
    CoSN GOALSLeadership Development:supporting school leaders to ensure technology has a positive effect on learning Advocacy: creating an effective voice on education technology issuesCoalition Building: building partnerships and collaborative efforts around the use of technology in schoolsEmerging Technology: exploring meaningful uses for new technologies in education
  • 77.
    COSN LEADERSHIP INITIATIVENew!!Accessible Technologies for All Students Projecthttp://www.accessibletech4all.org/increasing achievement and success for all students through the unlimited and effective use of accessible technologies Taking Total Cost of Ownership (TCO) to the Classroom http://classroomtco.cosn.org/ Helping School Leaders Budget More Accurately for Education TechnologySafeguarding the Wired Schoolhousehttp://safewiredschools.cosn.org/ Resources to Help School Administrators Understand Internet Safety Strategies3D: Vision to Know & Dohttp://3d2know.cosn.org/ Enabling Educators to Think Strategically about the Use of Data Driven Decision-MakingCyber Security for the Digital Districthttp://securedistrict.cosn.org/ Ensuring Security of School Networks
  • 78.
    Irene K. Speroirene@cosn.orgVicePresident202-861-2676 x112 1710 Rhode Island Ave., NW #900Washington, DC 20036www.cosn.org