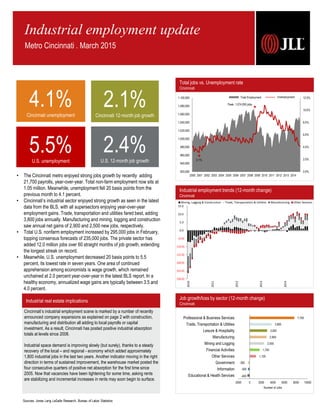
The Cincinnati metro enjoyed strong jobs growth by recently adding 21,700 payrolls, year-over-year. Total non-farm employment now sits at 1.05 million. Meanwhile, unemployment fell 20 basis points from the previous month to 4.1 percent.
Kohinoor Courtyard One Wakad Pune | Elegant Living Spaces
Cincinnati JLL Industrial Employment Update March 2015
1. Industrial employment trends (12-month change)
Cincinnati
Sources: Jones Lang LaSalle Research, Bureau of Labor Statistics
Industrial employment update
Metro Cincinnati . March 2015
Cincinnati’s industrial employment scene is marked by a number of recently
announced company expansions as explained on page 2 with construction,
manufacturing and distribution all adding to local payrolls or capital
investment. As a result, Cincinnati has posted positive industrial absorption
totals at levels since 2008.
Industrial space demand is improving slowly (but surely), thanks to a steady
recovery of the local – and regional - economy which added approximately
1,800 industrial jobs in the last two years. Another indicator moving in the right
direction in terms of sustained improvement, the warehouse market posted the
four consecutive quarters of positive net absorption for the first time since
2005. Now that vacancies have been tightening for some time, asking rents
are stabilizing and incremental increases in rents may soon begin to surface.
Industrial real estate implications
4.1%Cincinnati unemployment
2.1%Cincinnati 12-month job growth
5.5%U.S. unemployment
2.4%U.S. 12-month job growth
• The Cincinnati metro enjoyed strong jobs growth by recently adding
21,700 payrolls, year-over-year. Total non-farm employment now sits at
1.05 million. Meanwhile, unemployment fell 20 basis points from the
previous month to 4.1 percent.
• Cincinnati’s industrial sector enjoyed strong growth as seen in the latest
data from the BLS, with all supersectors enjoying year-over-year
employment gains. Trade, transportation and utilities fared best, adding
3,800 jobs annually. Manufacturing and mining, logging and construction
saw annual net gains of 2,900 and 2,500 new jobs, respectively.
• Total U.S. nonfarm employment increased by 295,000 jobs in February,
topping consensus forecasts of 235,000 jobs. The private sector has
added 12.0 million jobs over 60 straight months of job growth, extending
the longest streak on record.
• Meanwhile, U.S. unemployment decreased 20 basis points to 5.5
percent, its lowest rate in seven years. One area of continued
apprehension among economists is wage growth, which remained
unchained at 2.0 percent year-over-year in the latest BLS report. In a
healthy economy, annualized wage gains are typically between 3.5 and
4.0 percent.
Total jobs vs. Unemployment rate
Cincinnati
Unemployment
3.1%
0.0%
2.0%
4.0%
6.0%
8.0%
10.0%
12.0%
920,000
940,000
960,000
980,000
1,000,000
1,020,000
1,040,000
1,060,000
1,080,000
1,100,000
2000 2001 2002 2003 2004 2005 2006 2007 2008 2009 2010 2011 2012 2013 2014
Peak: 1,074,050 jobs
Total Employment
3.1%
Job growth/loss by sector (12-month change)
Cincinnati
-400
-300
-300
1,100
1,700
2,500
2,900
3,000
3,800
7,700
-2000 0 2000 4000 6000 8000 10000
Educational & Health Services
Information
Government
Other Services
Financial Activities
Mining and Logging
Manufacturing
Leisure & Hospitality
Trade, Transportation & Utilities
Professional & Business Services
Number of Jobs
(30.0)
(25.0)
(20.0)
(15.0)
(10.0)
(5.0)
0.0
5.0
10.0
15.0
2010
2011
2012
2013
2014
Mining, Logging & Construction Trade, Transportation & Utilities Manufacturing Other Services