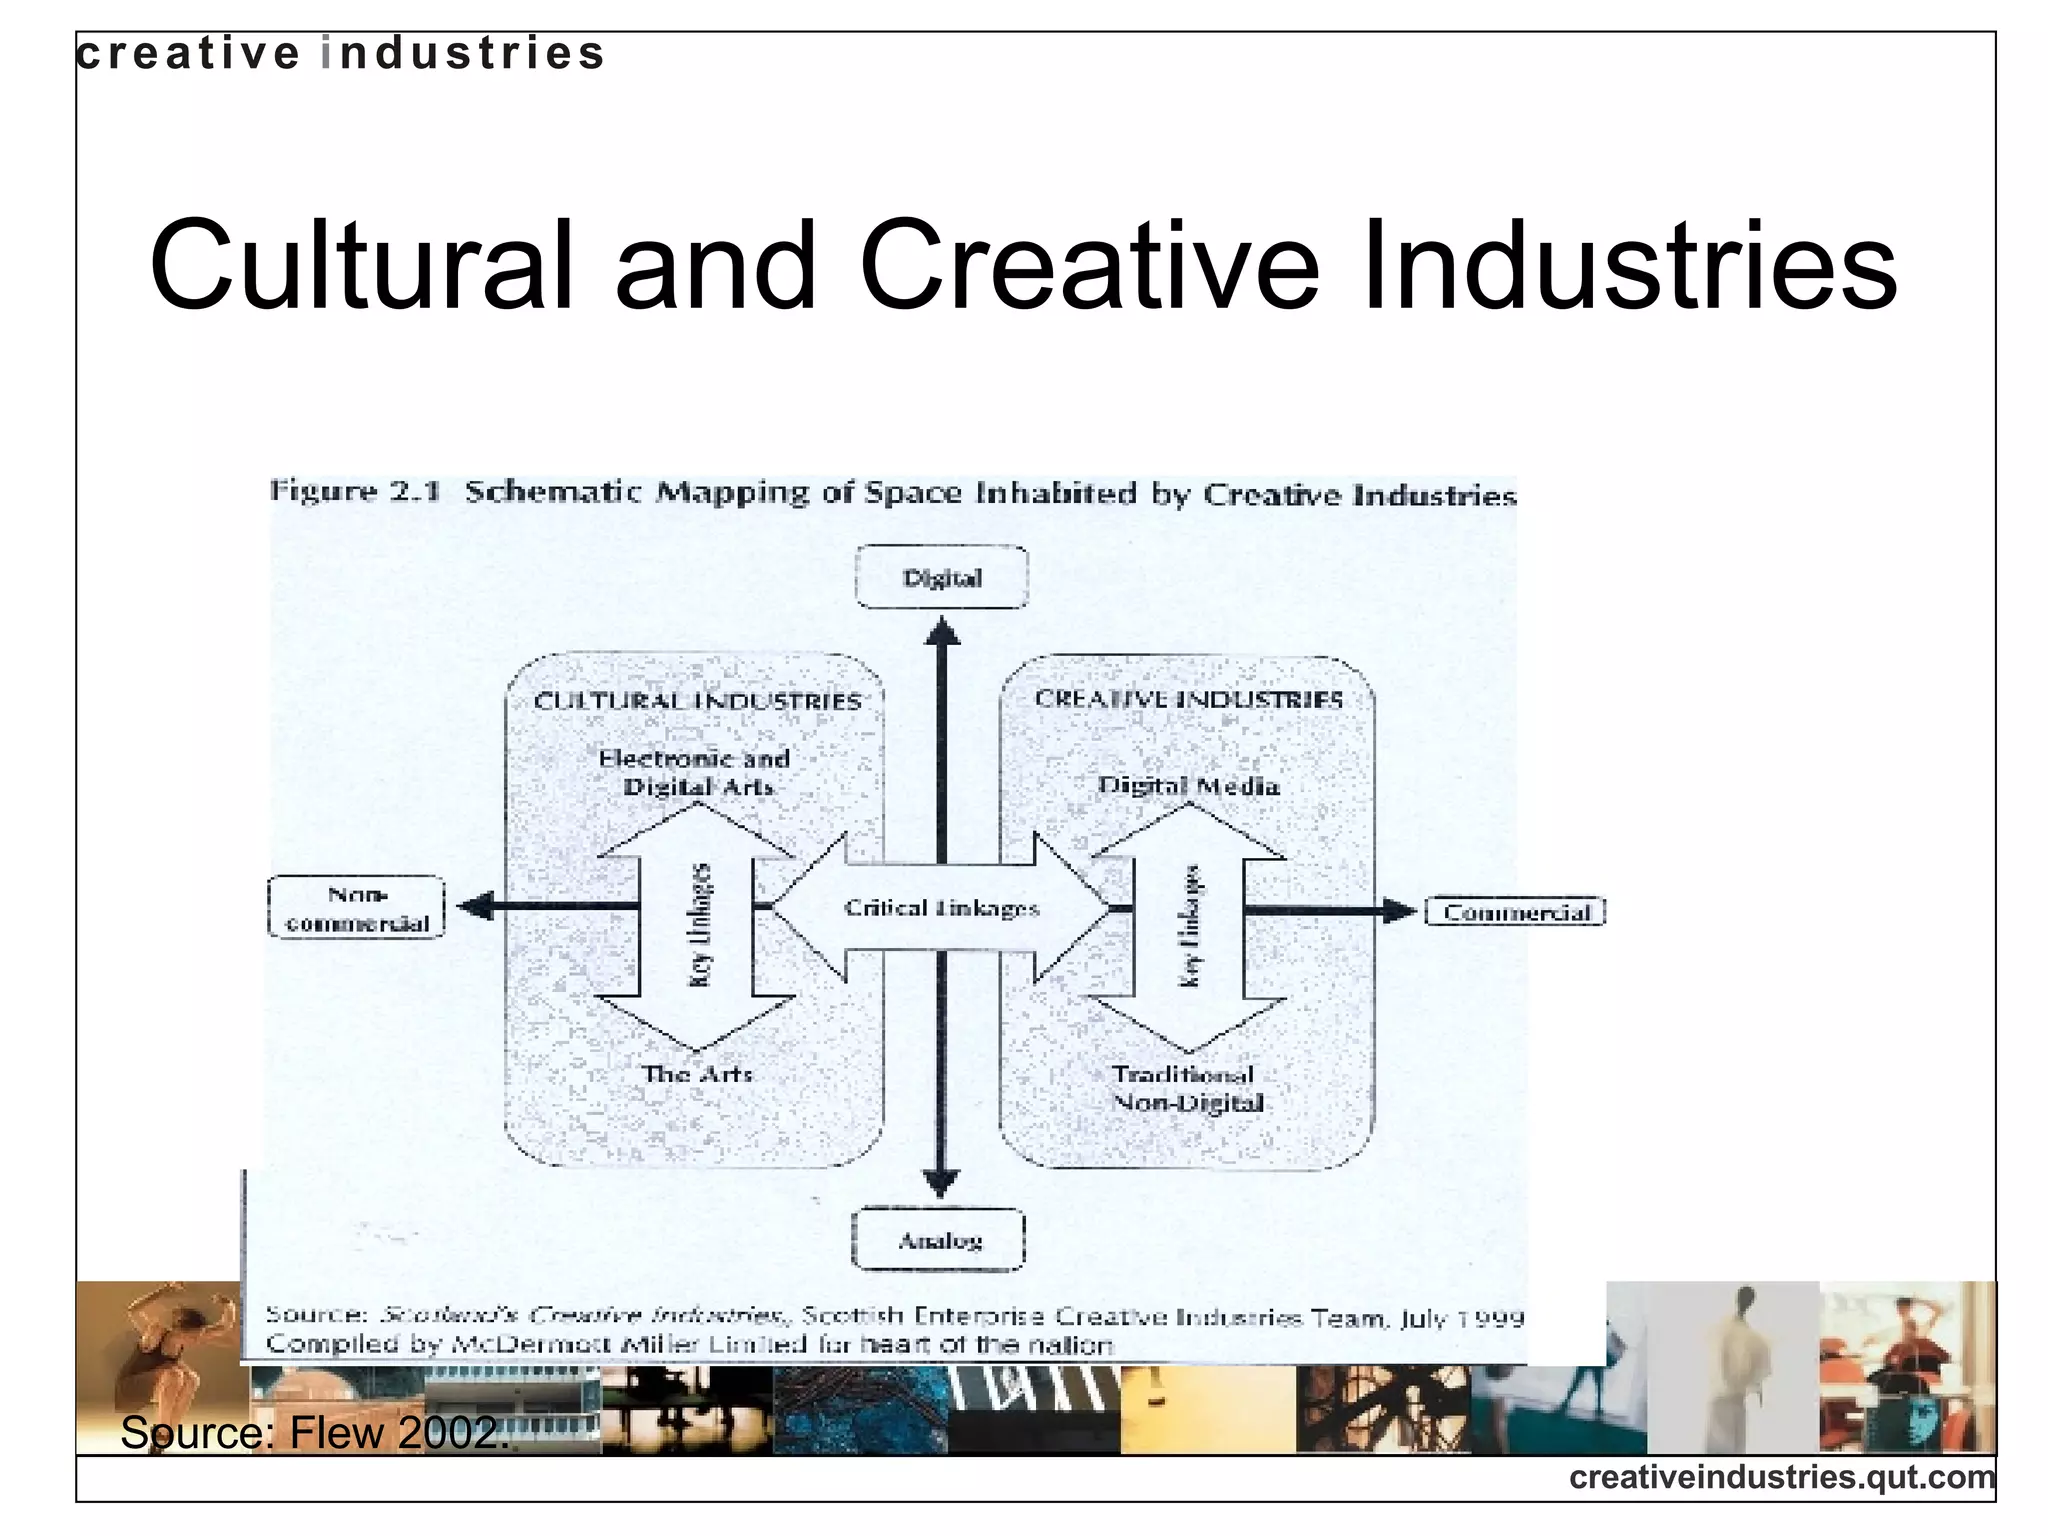
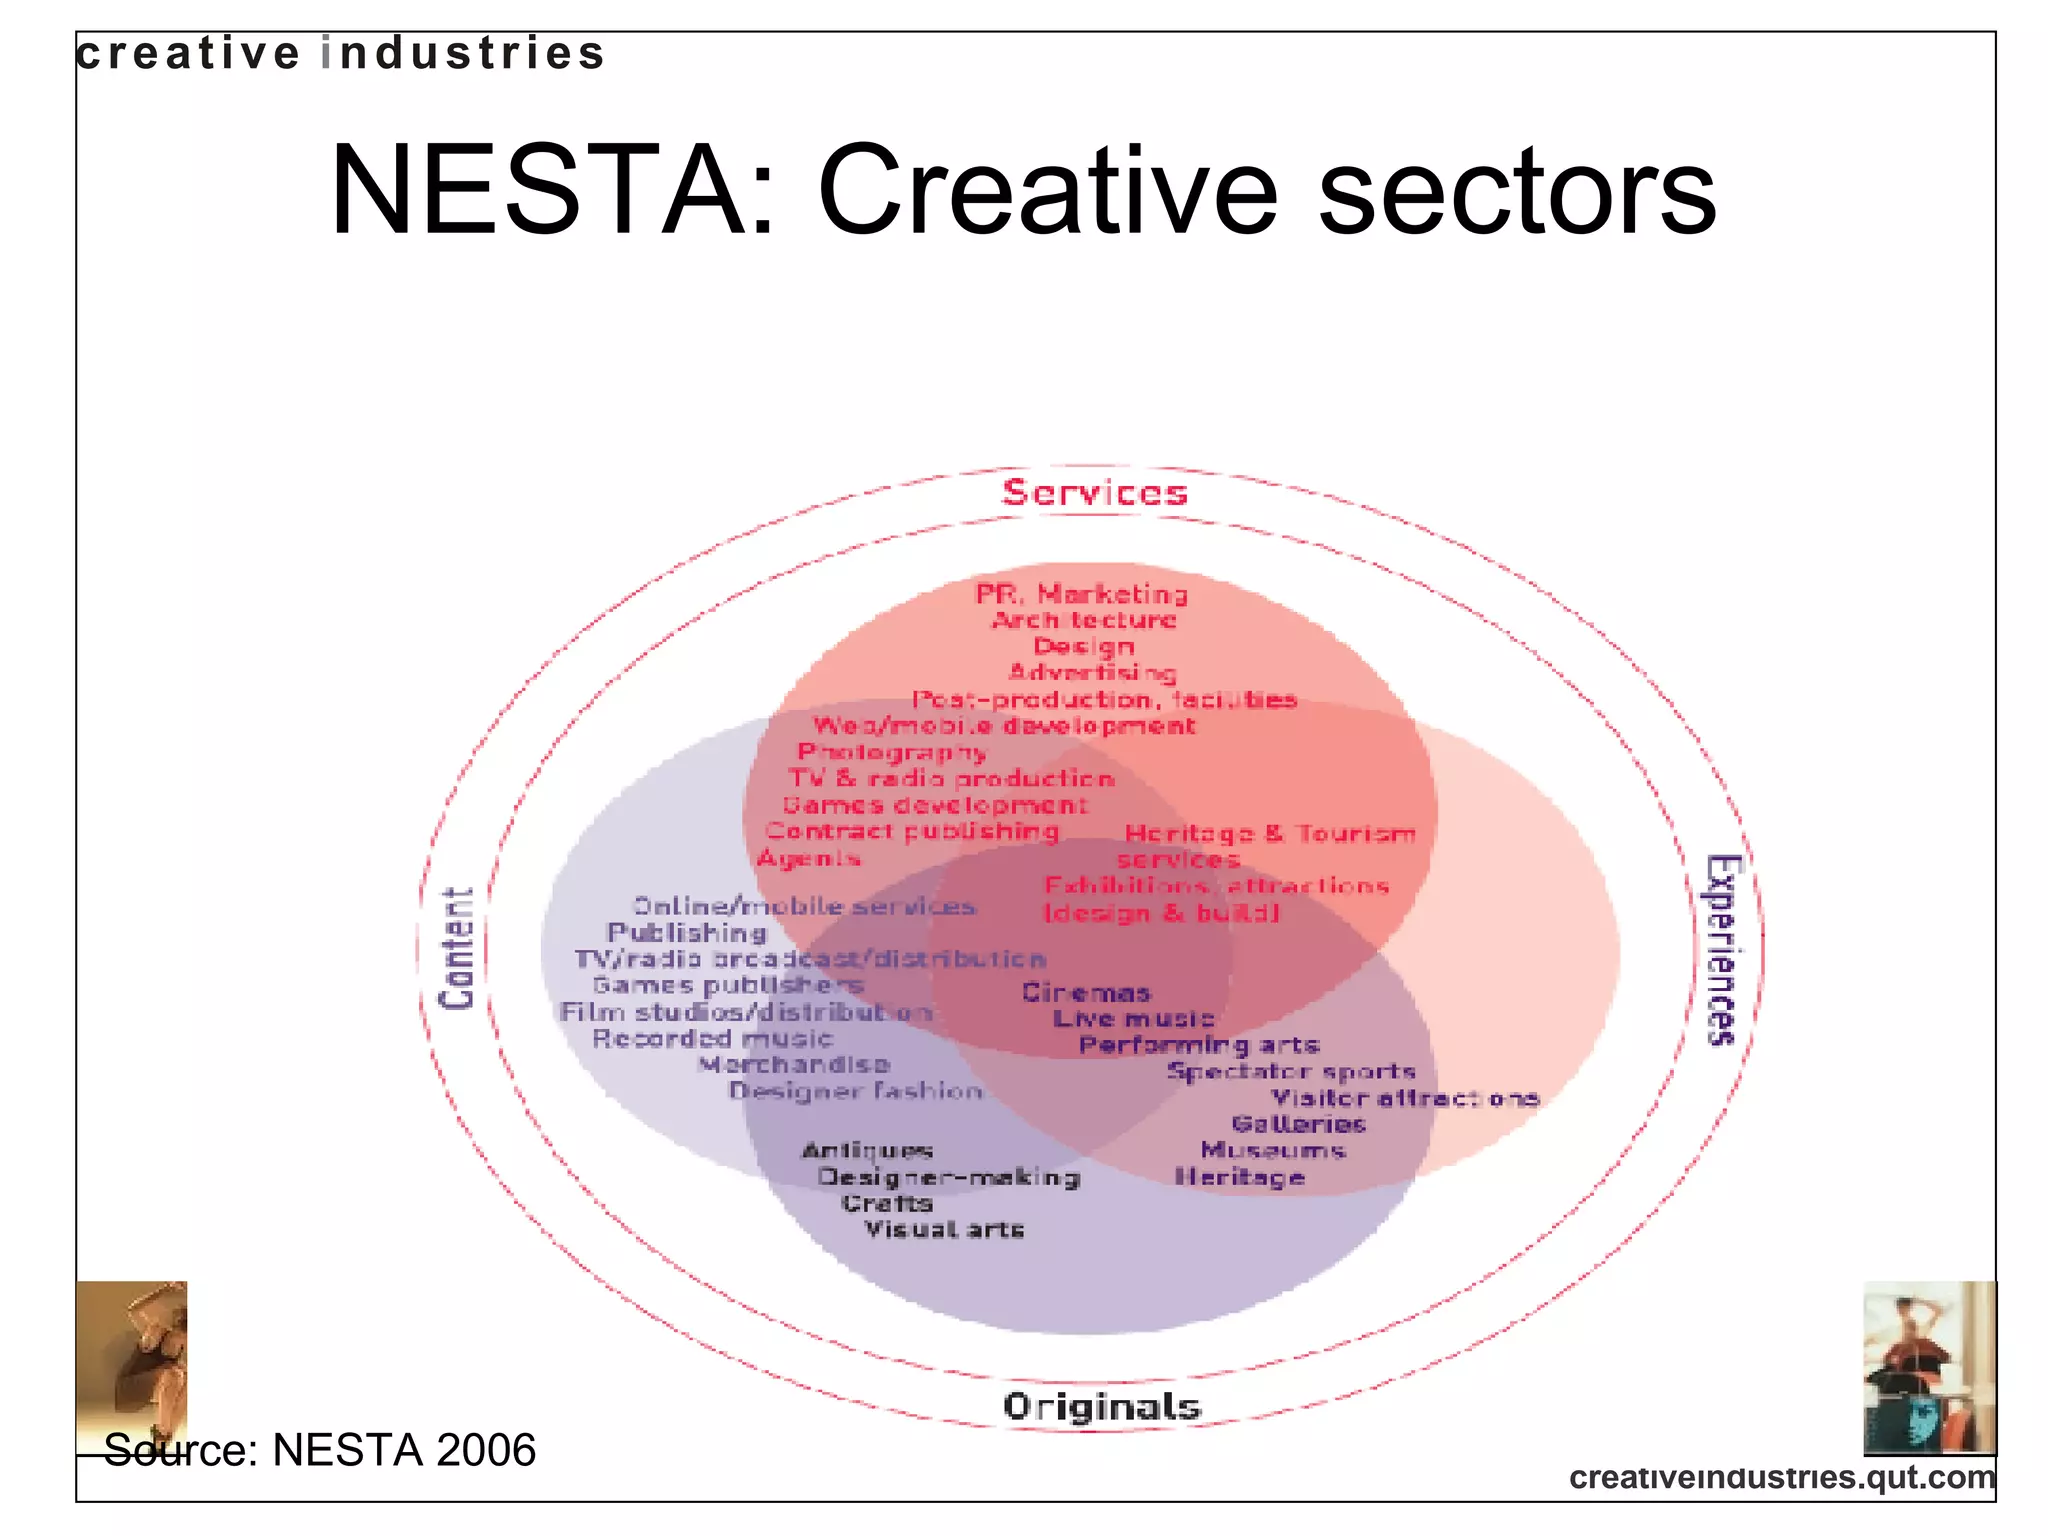
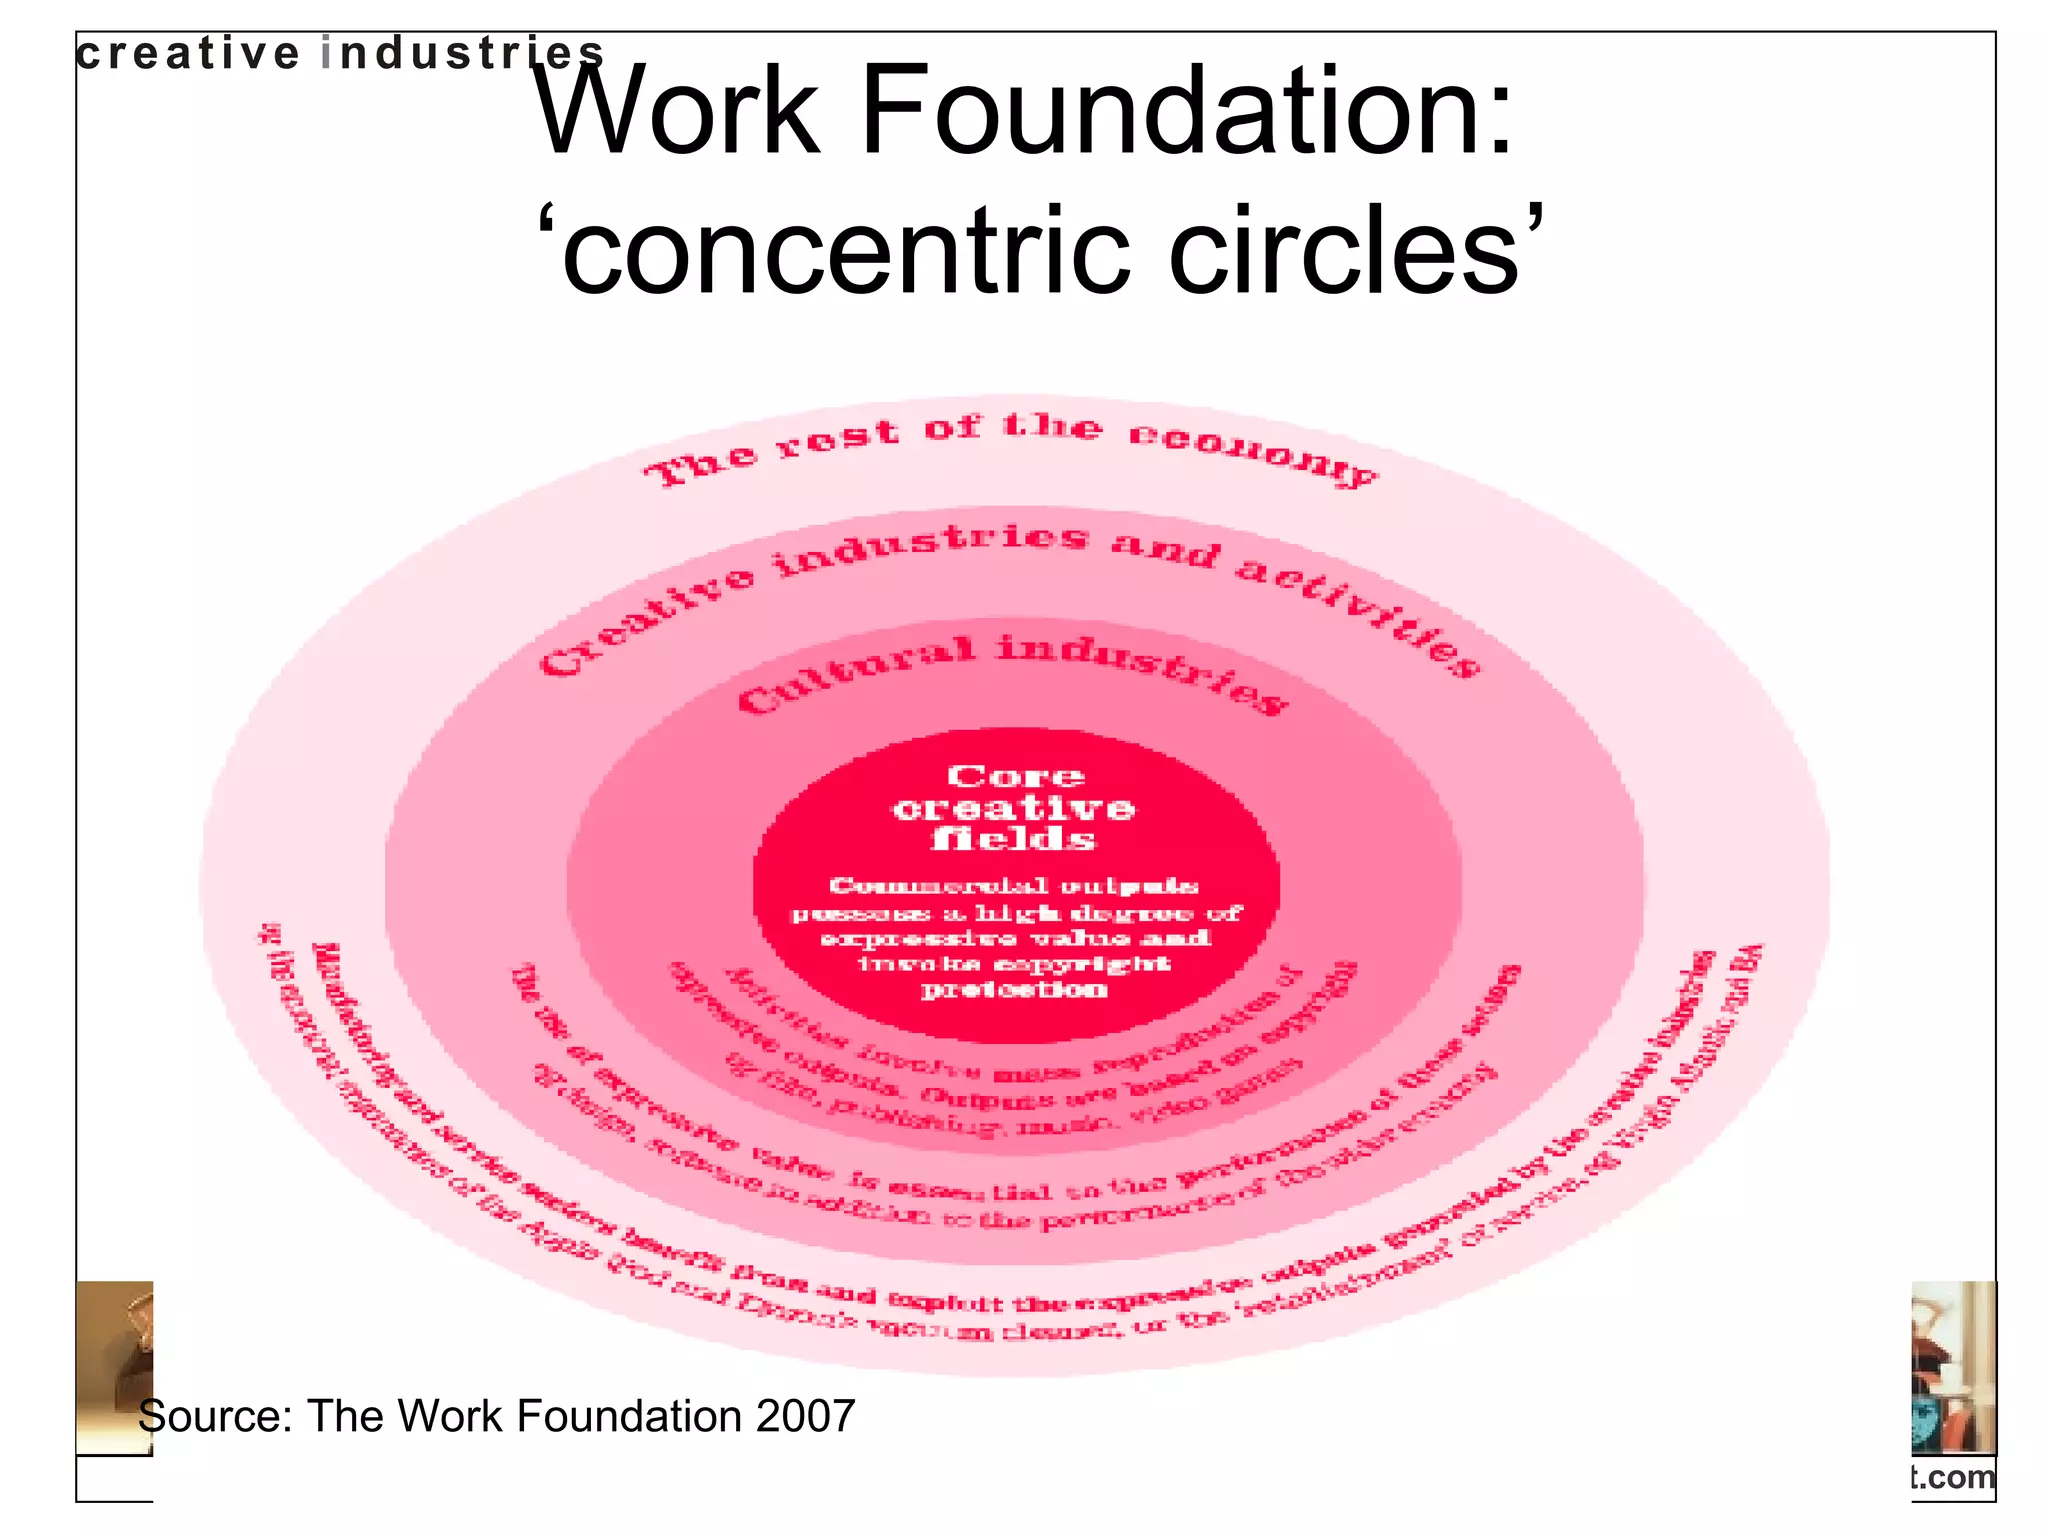
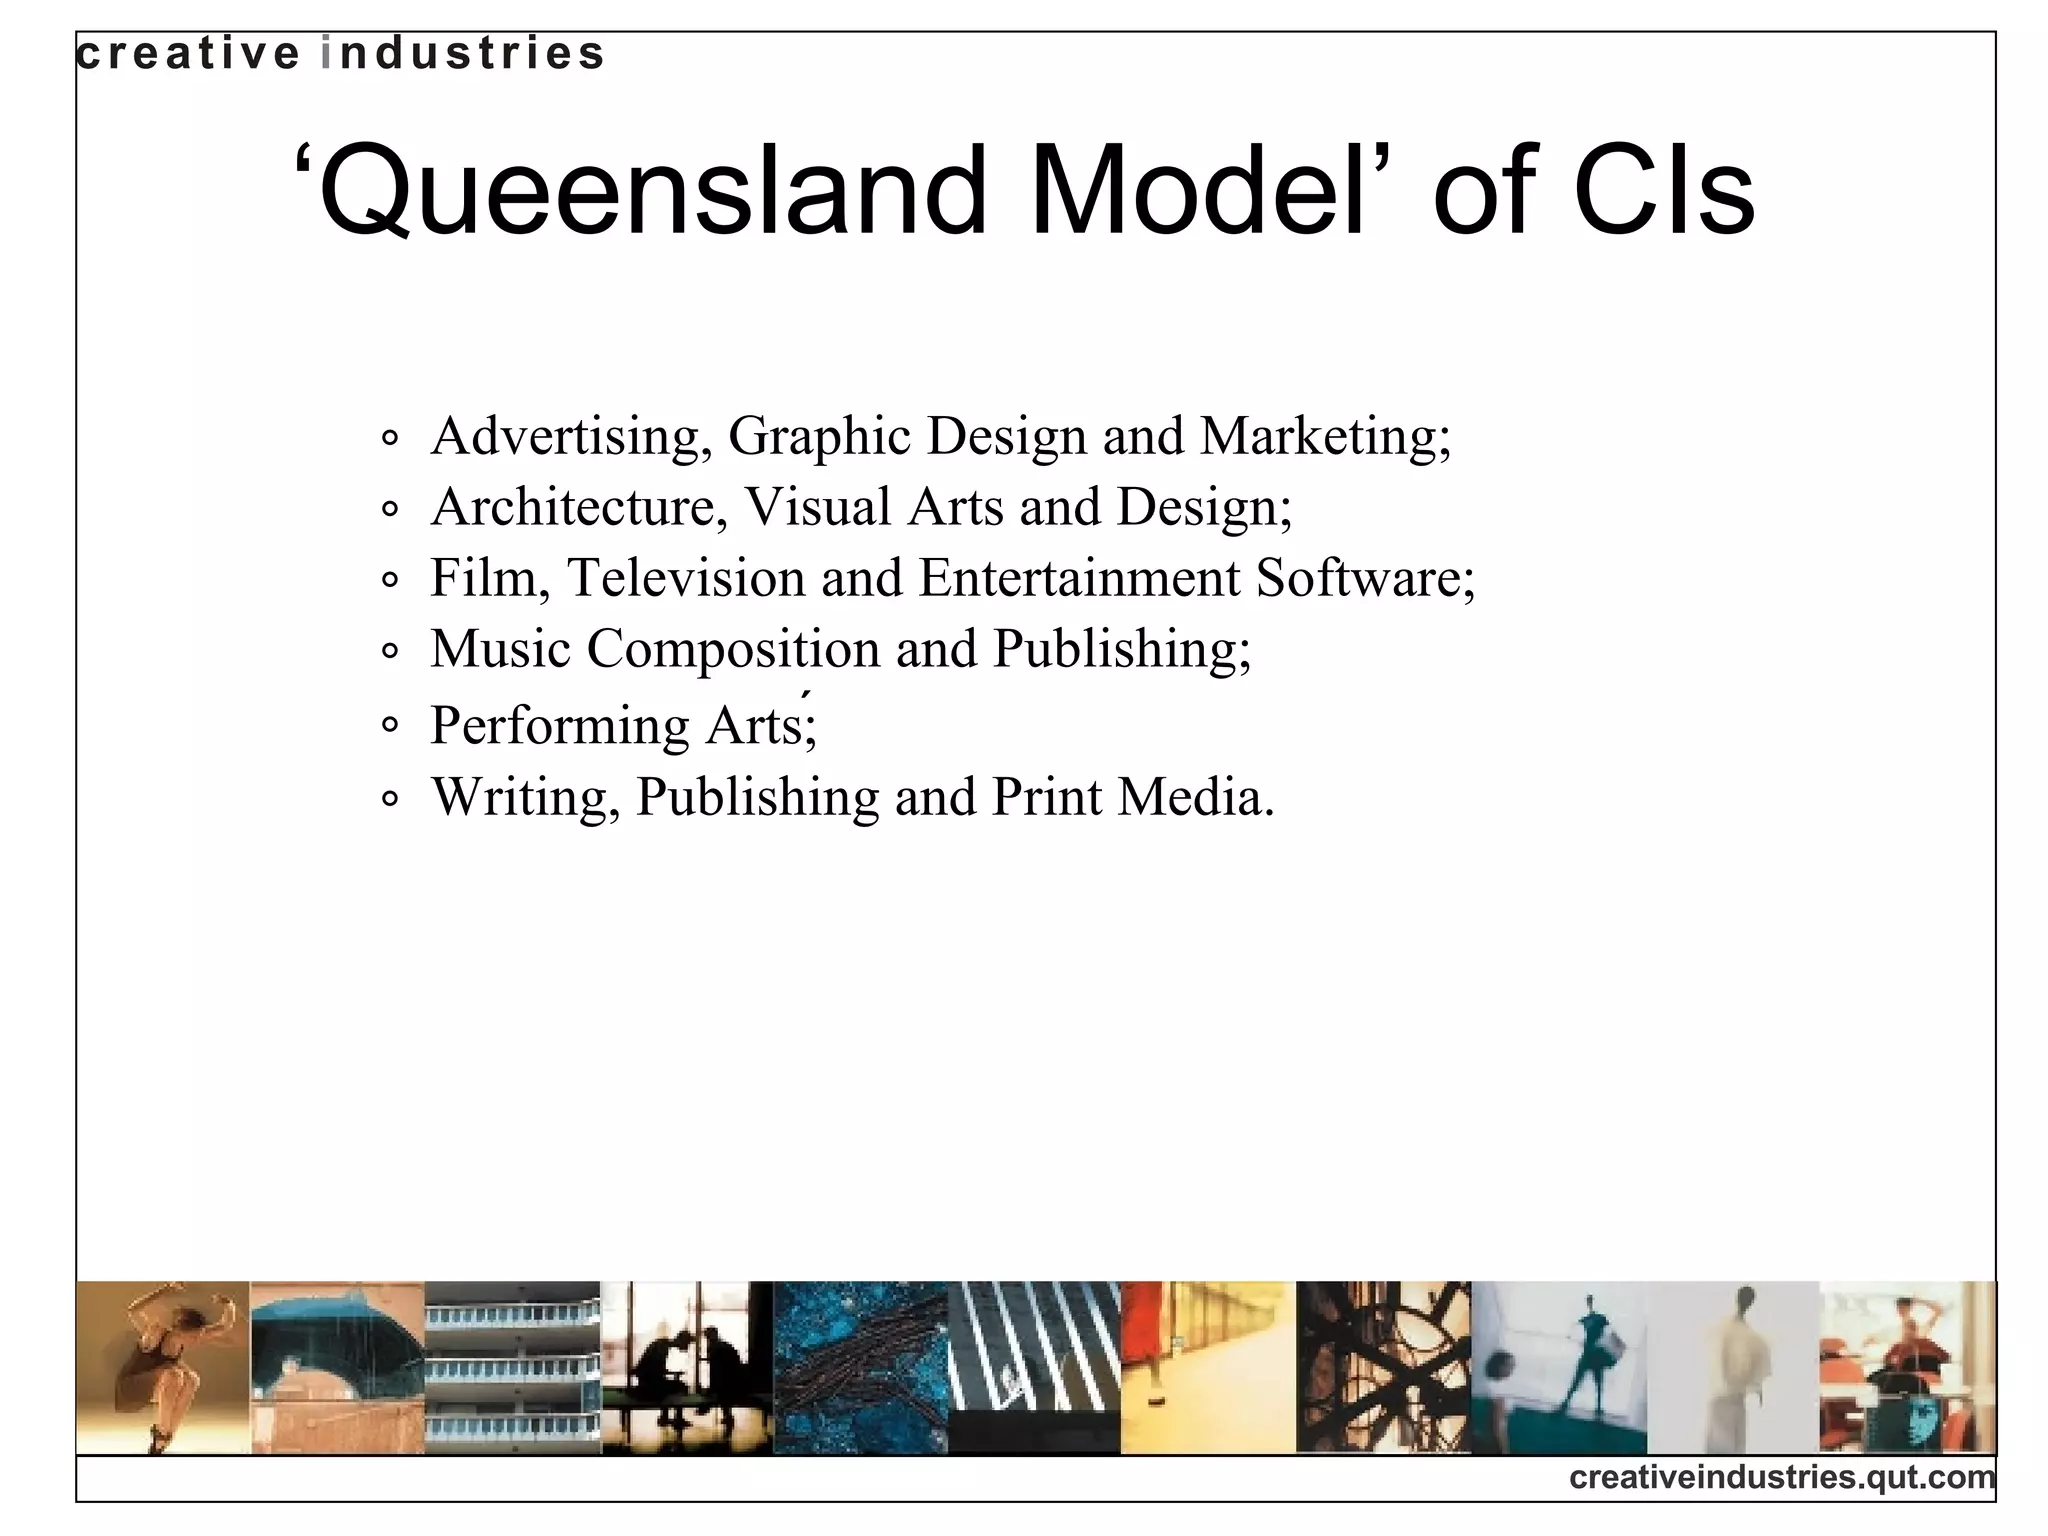
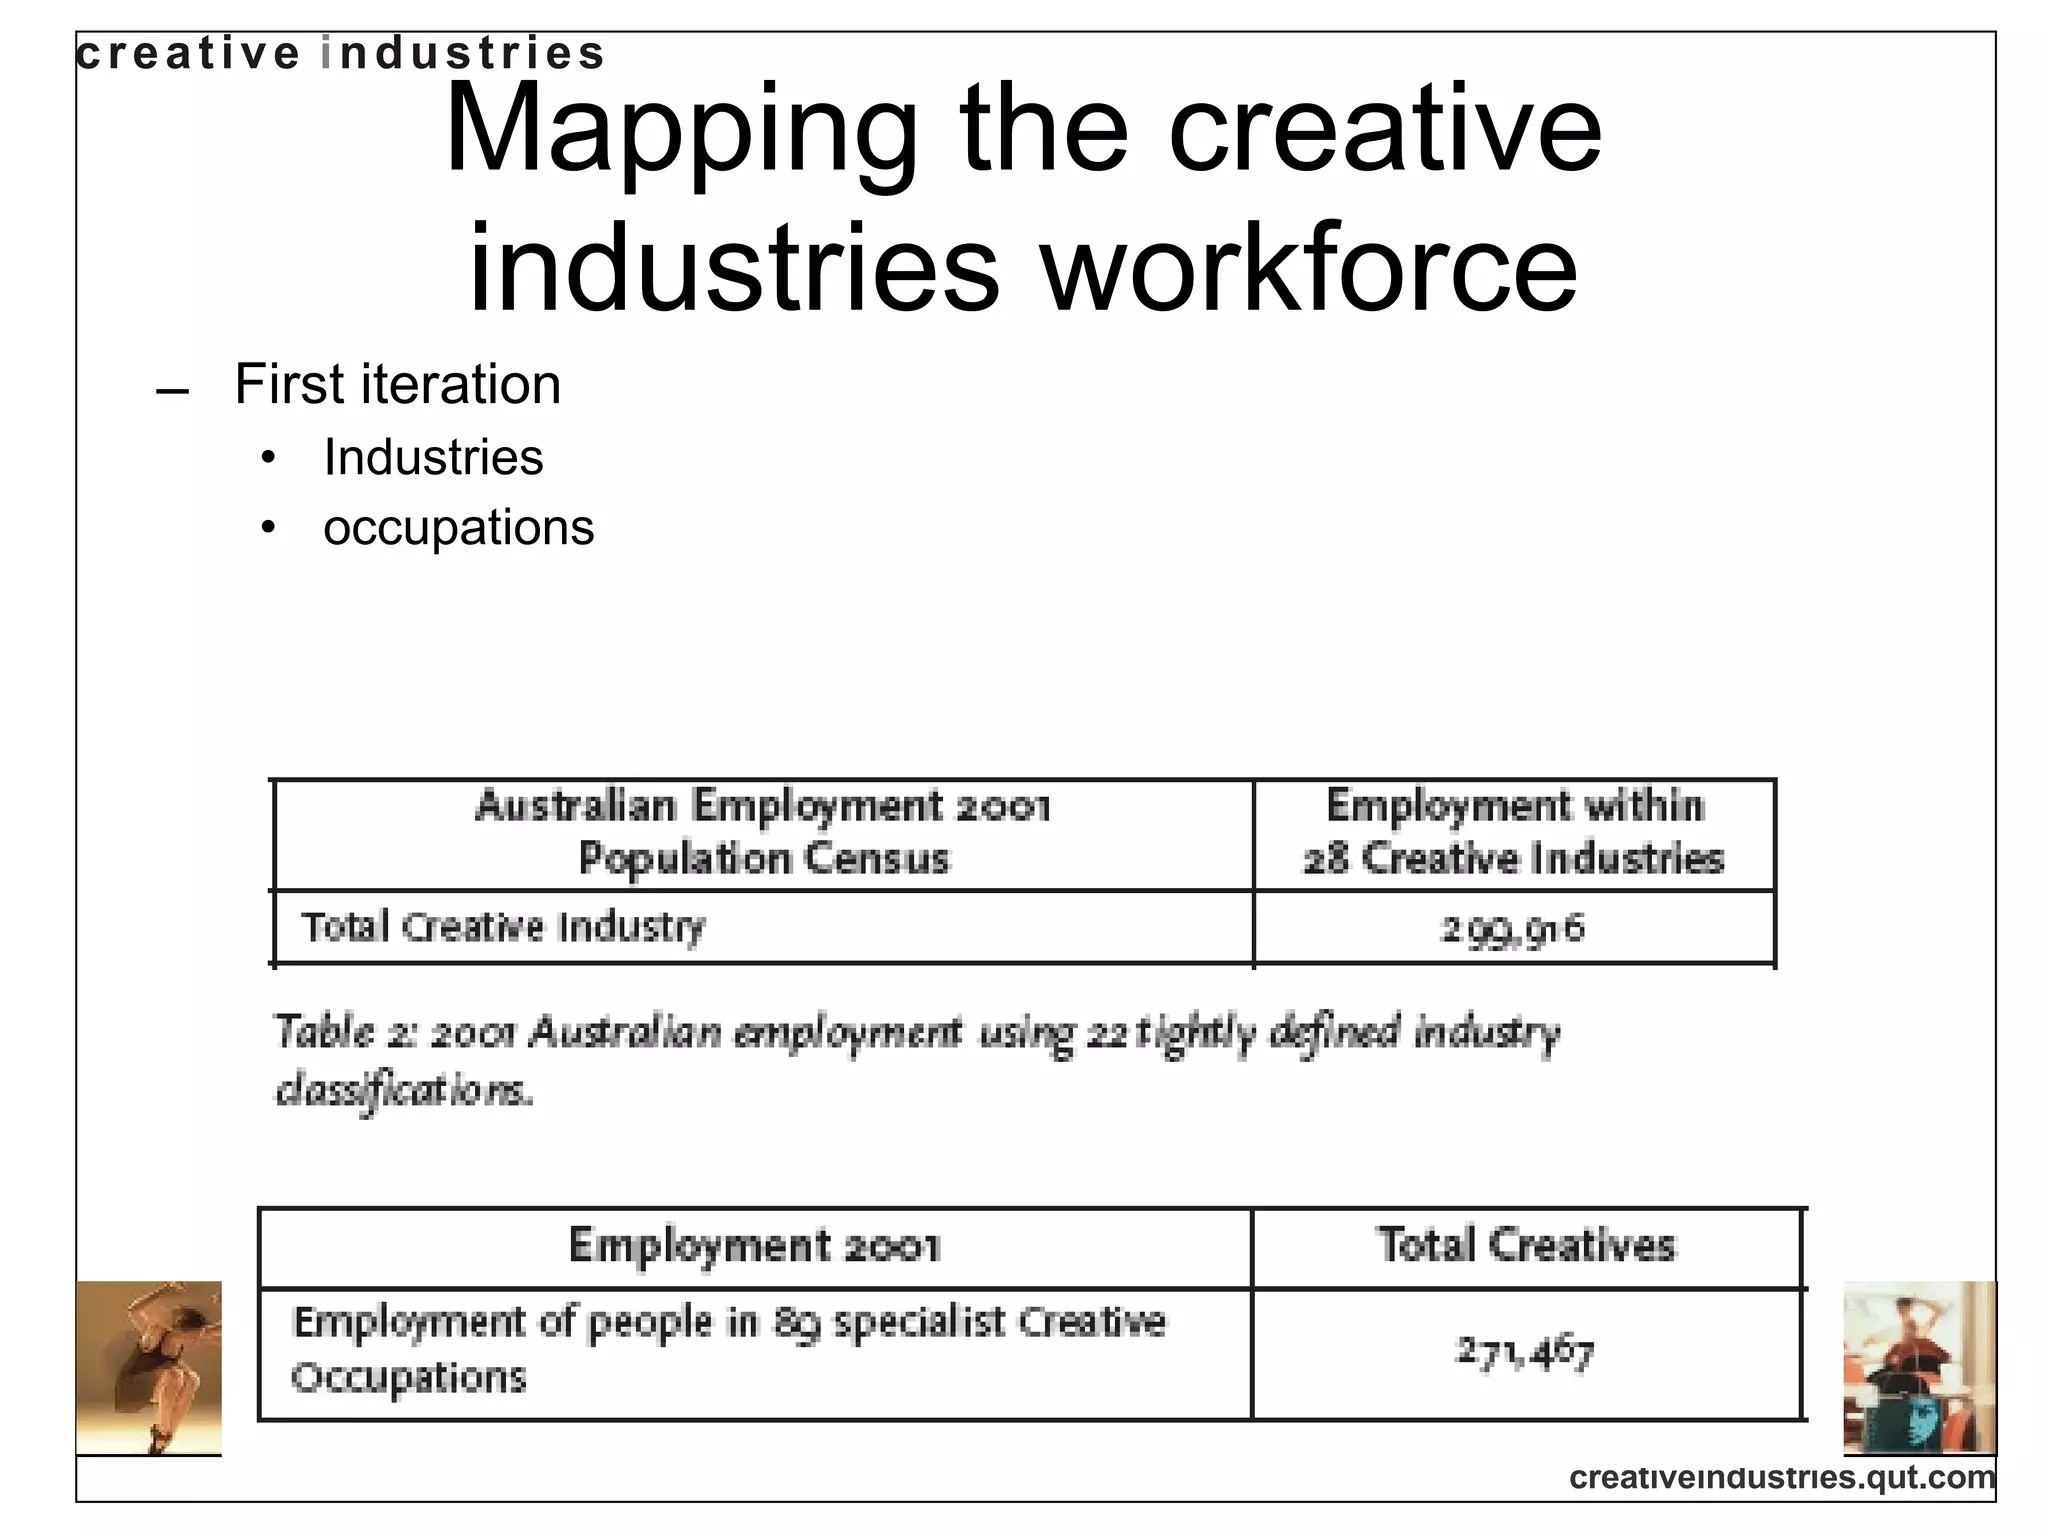
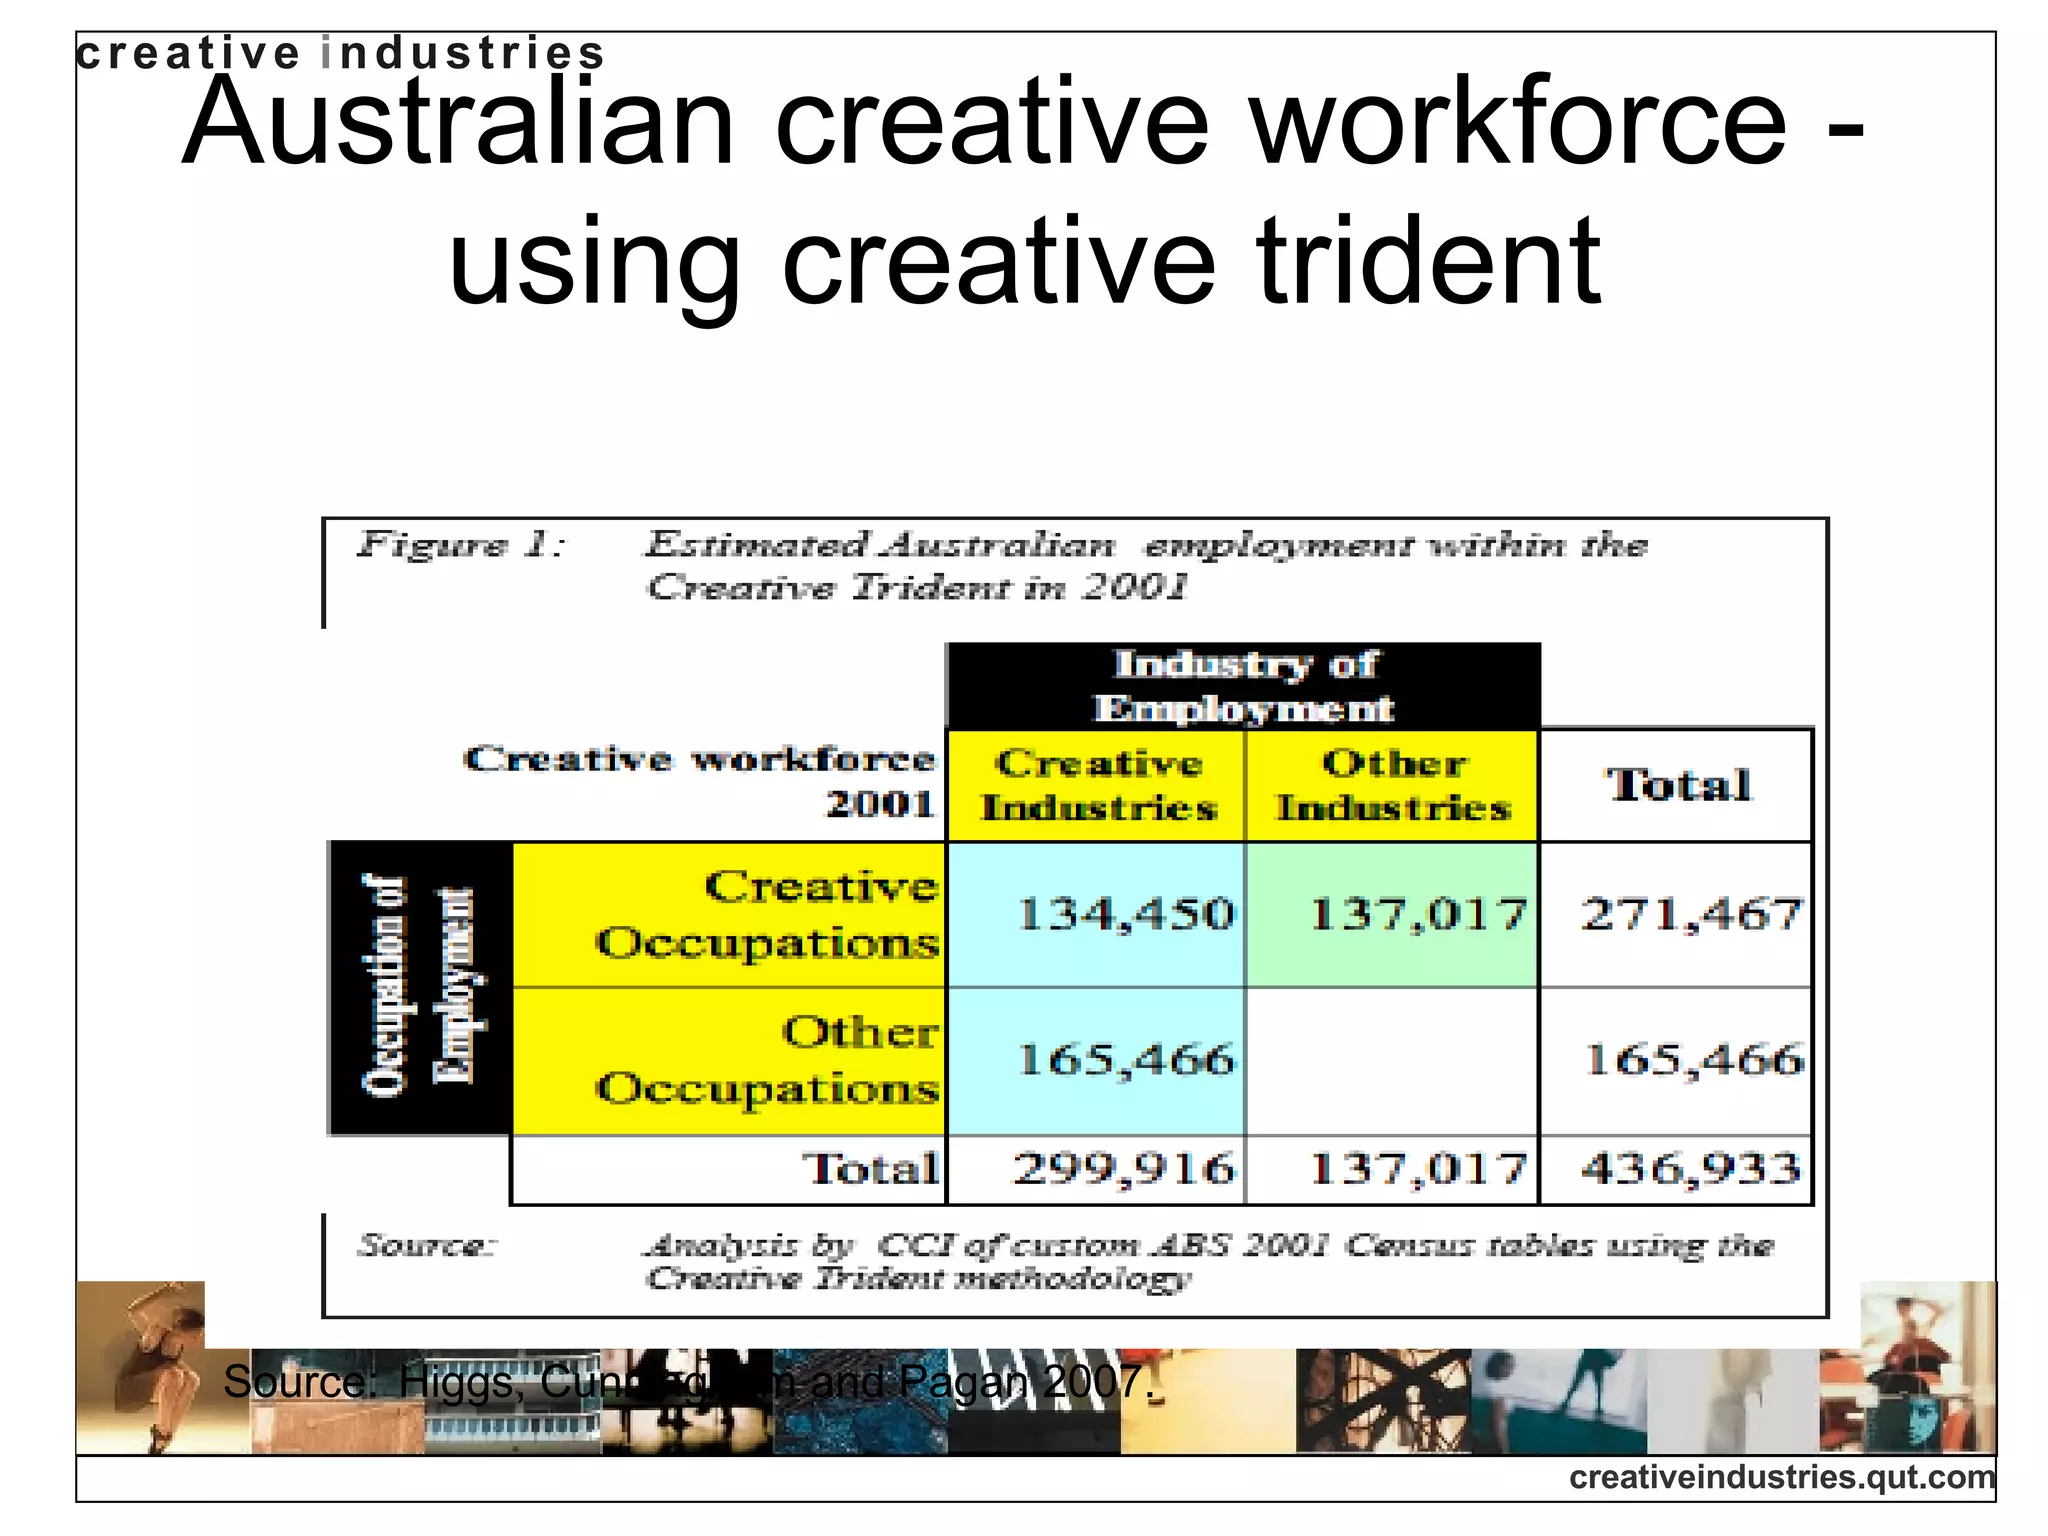
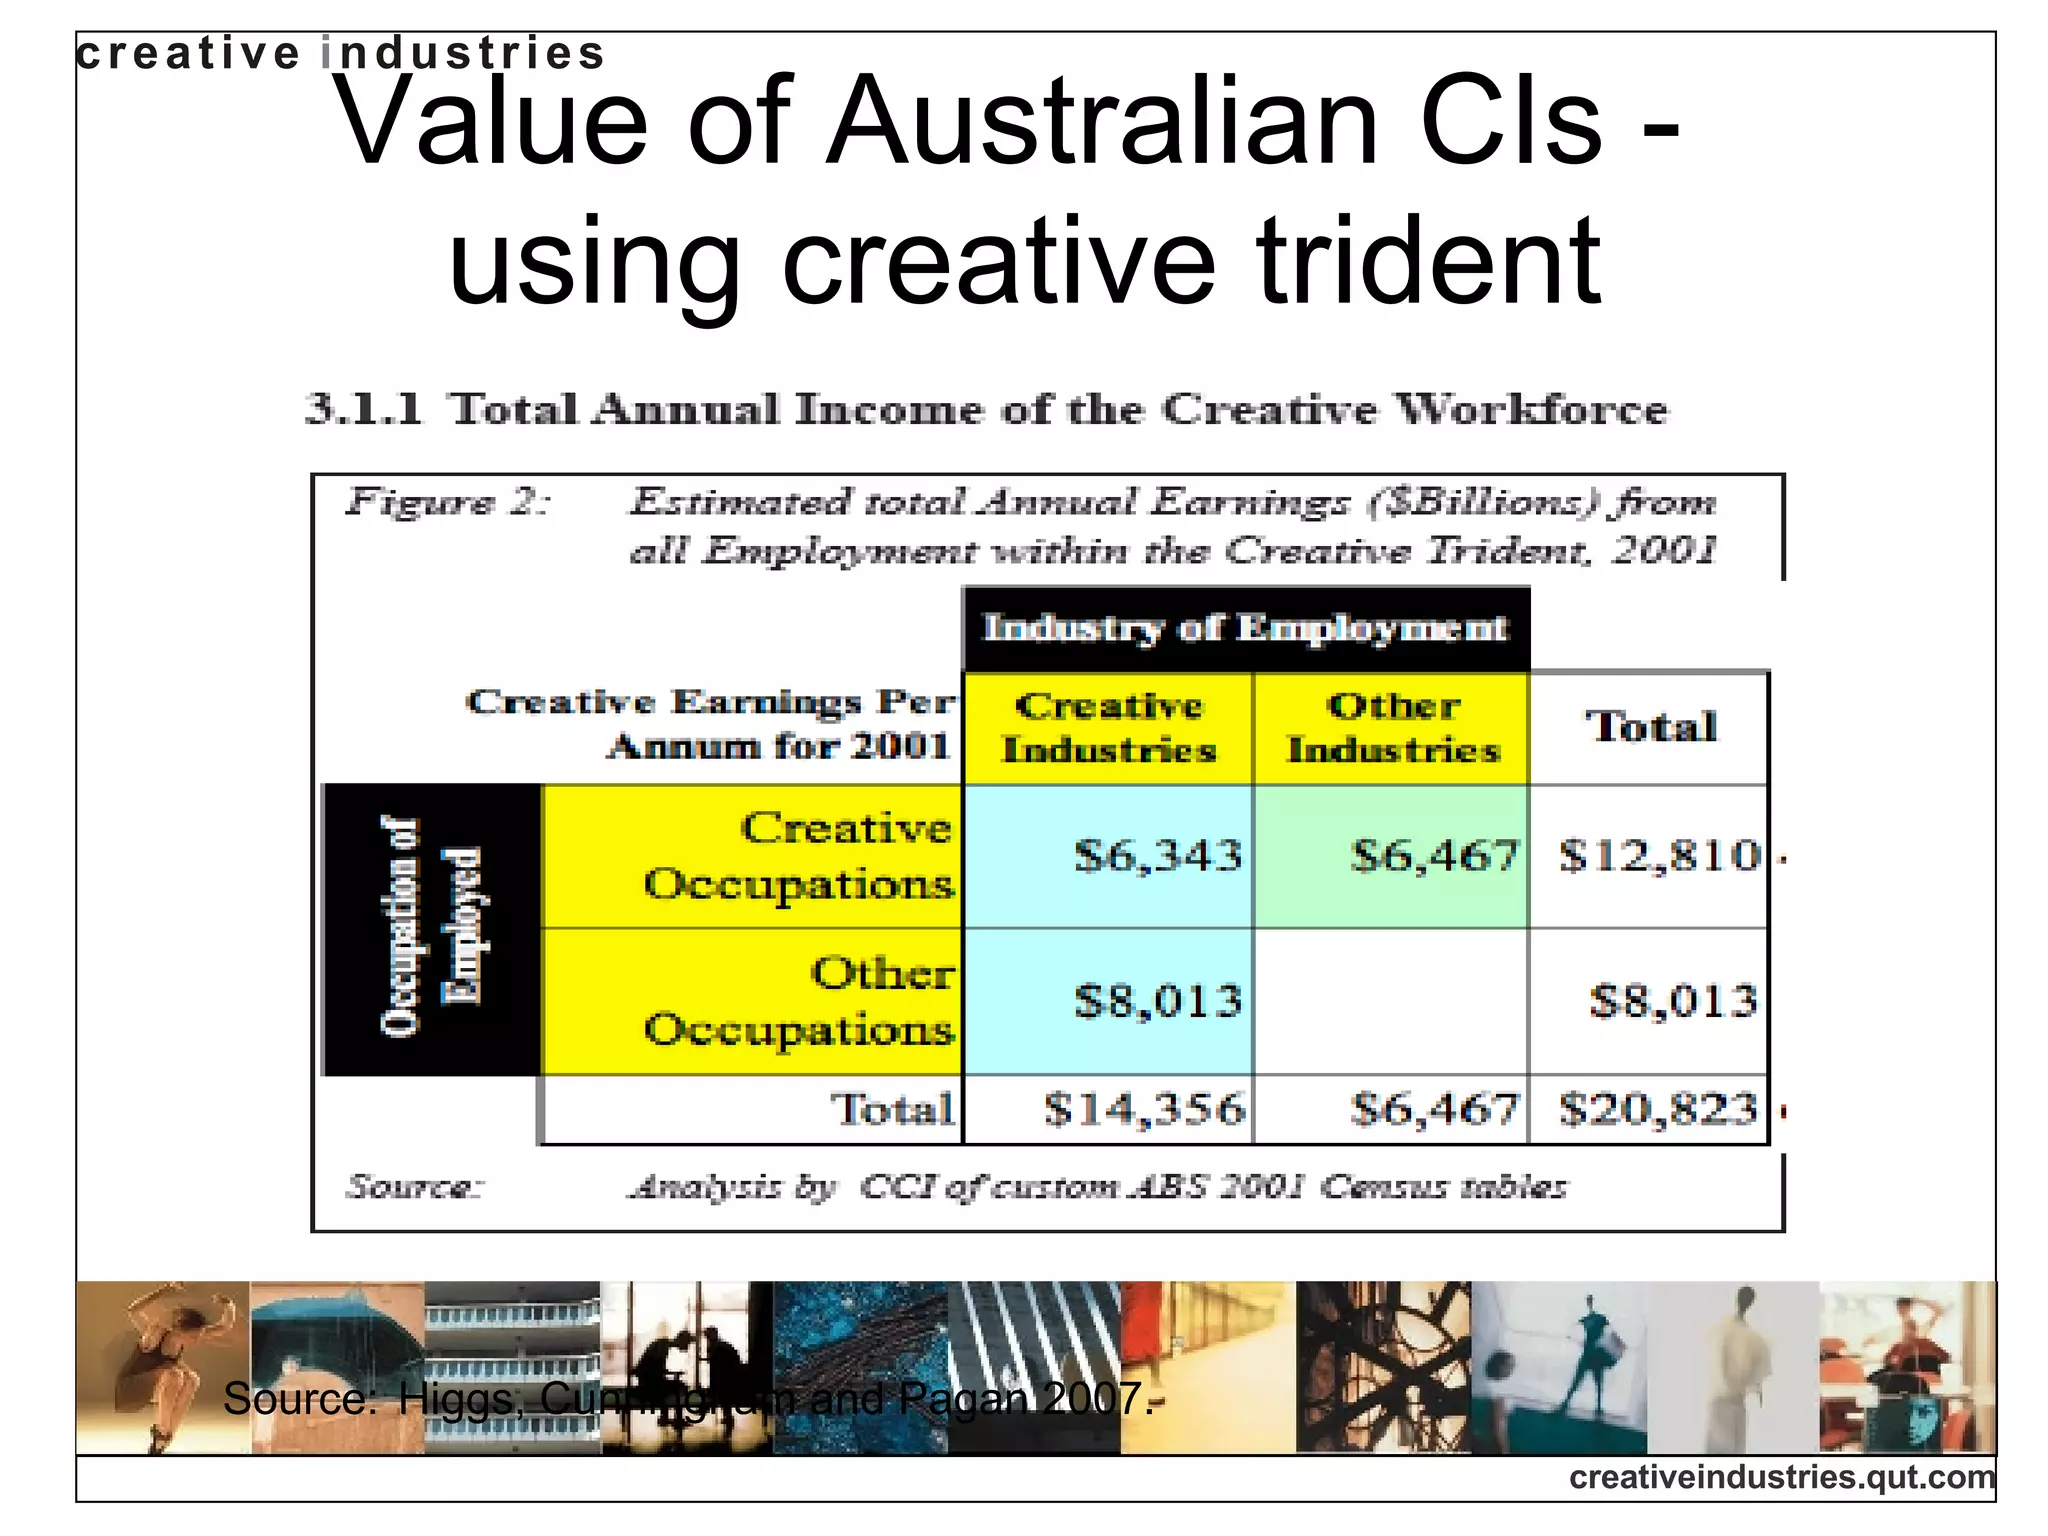
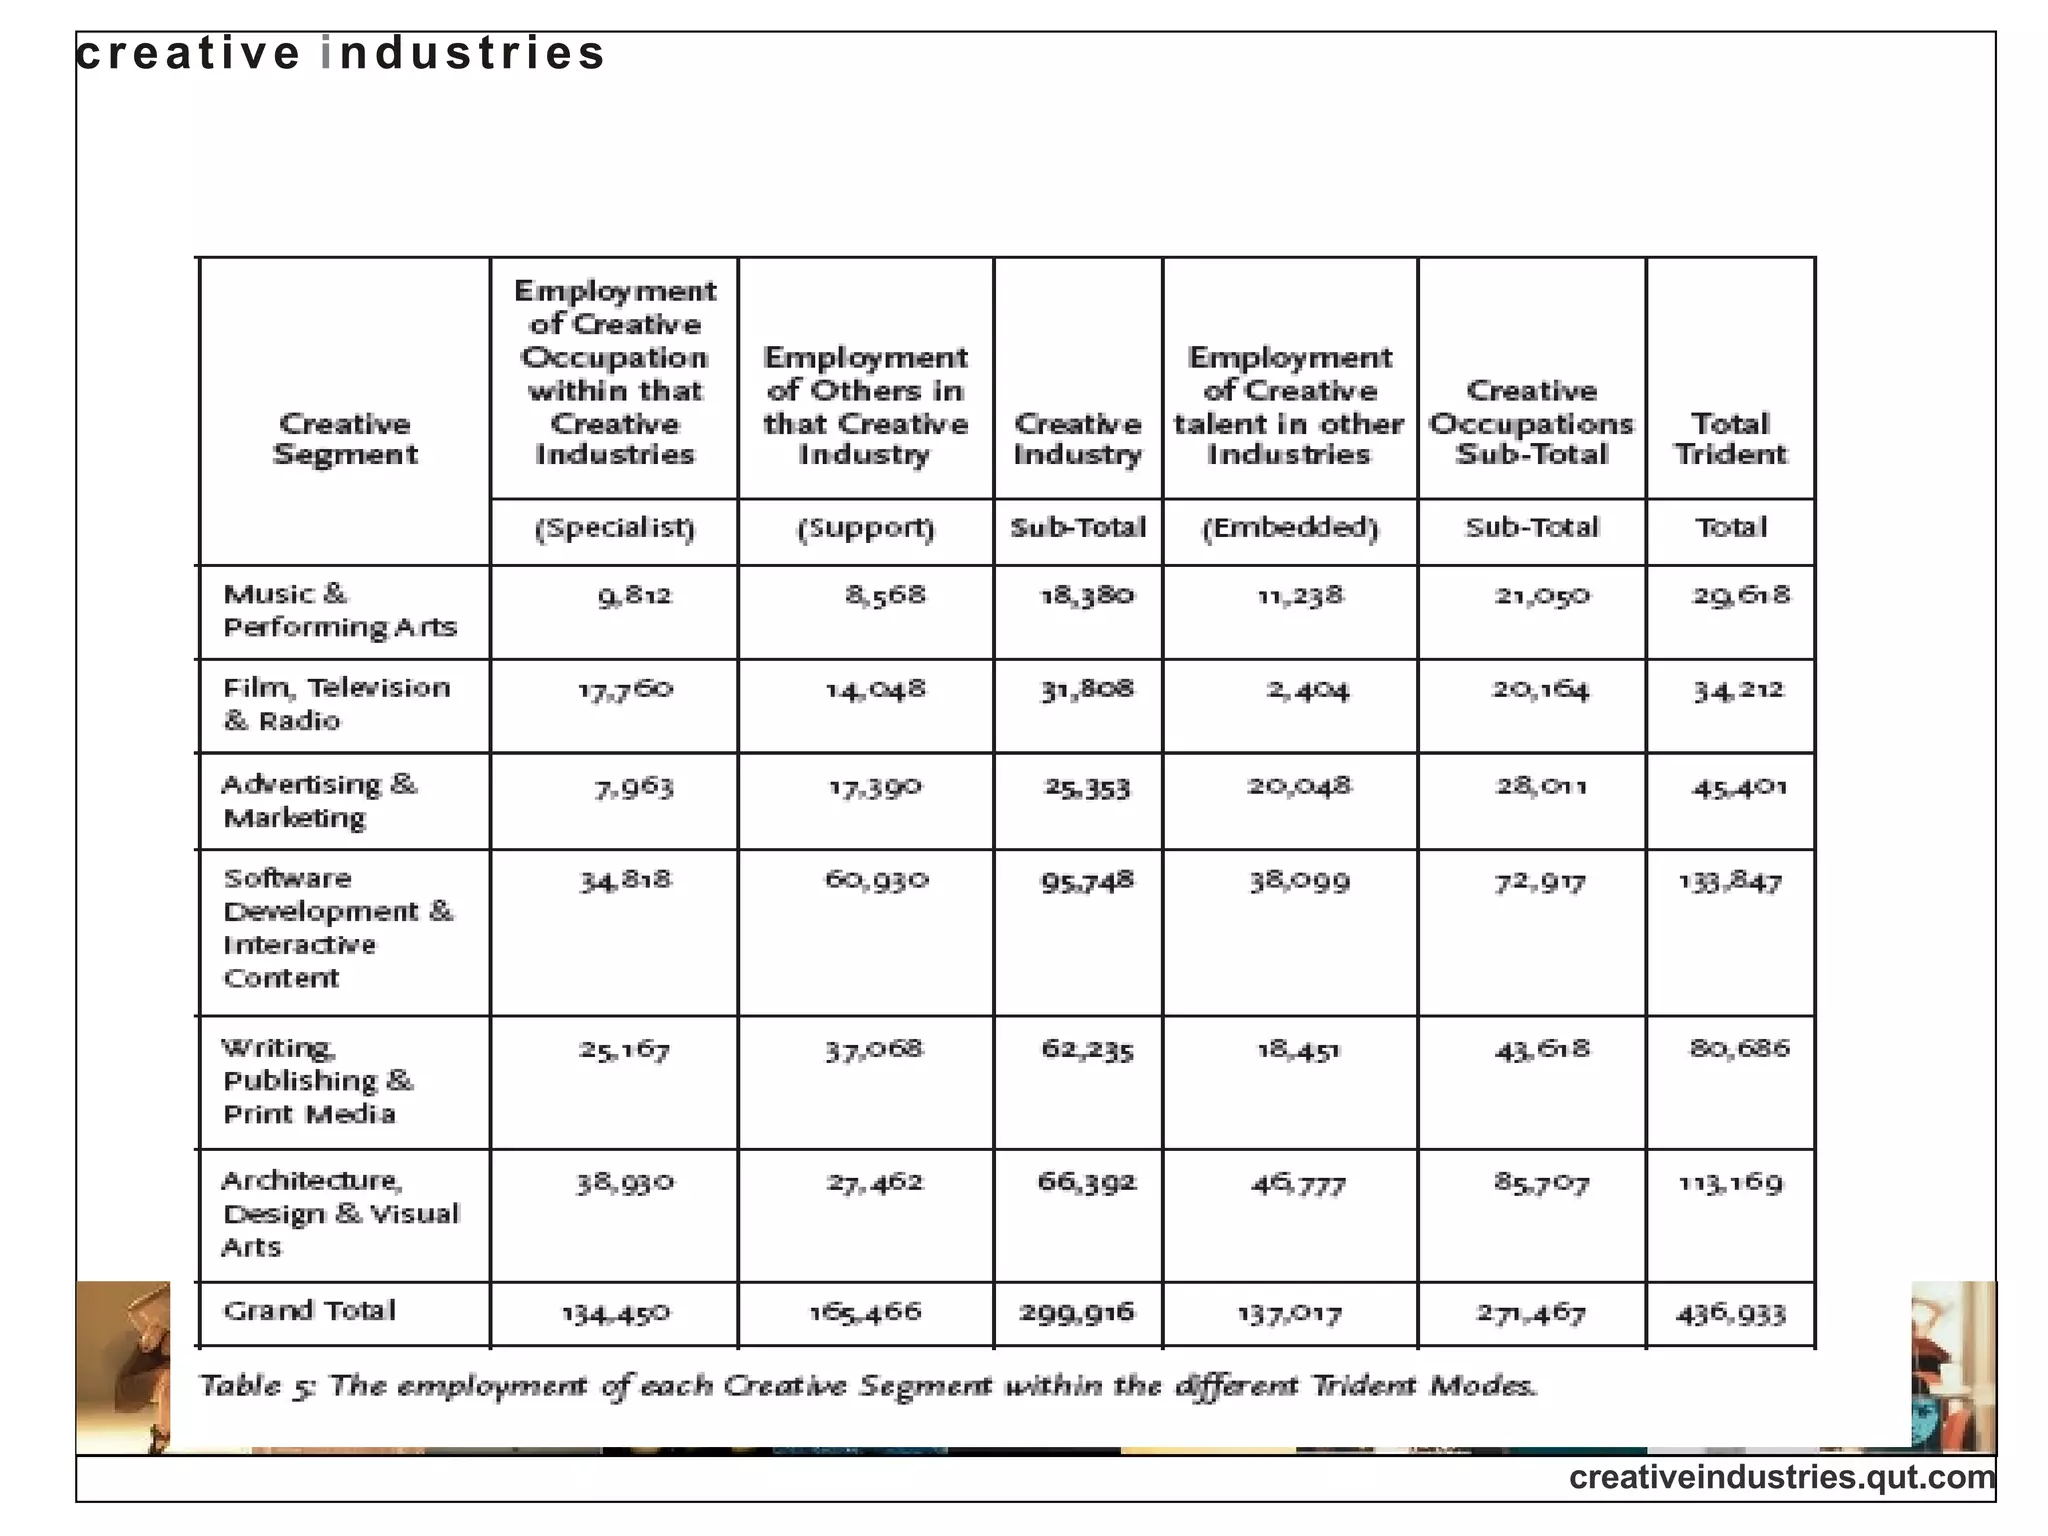
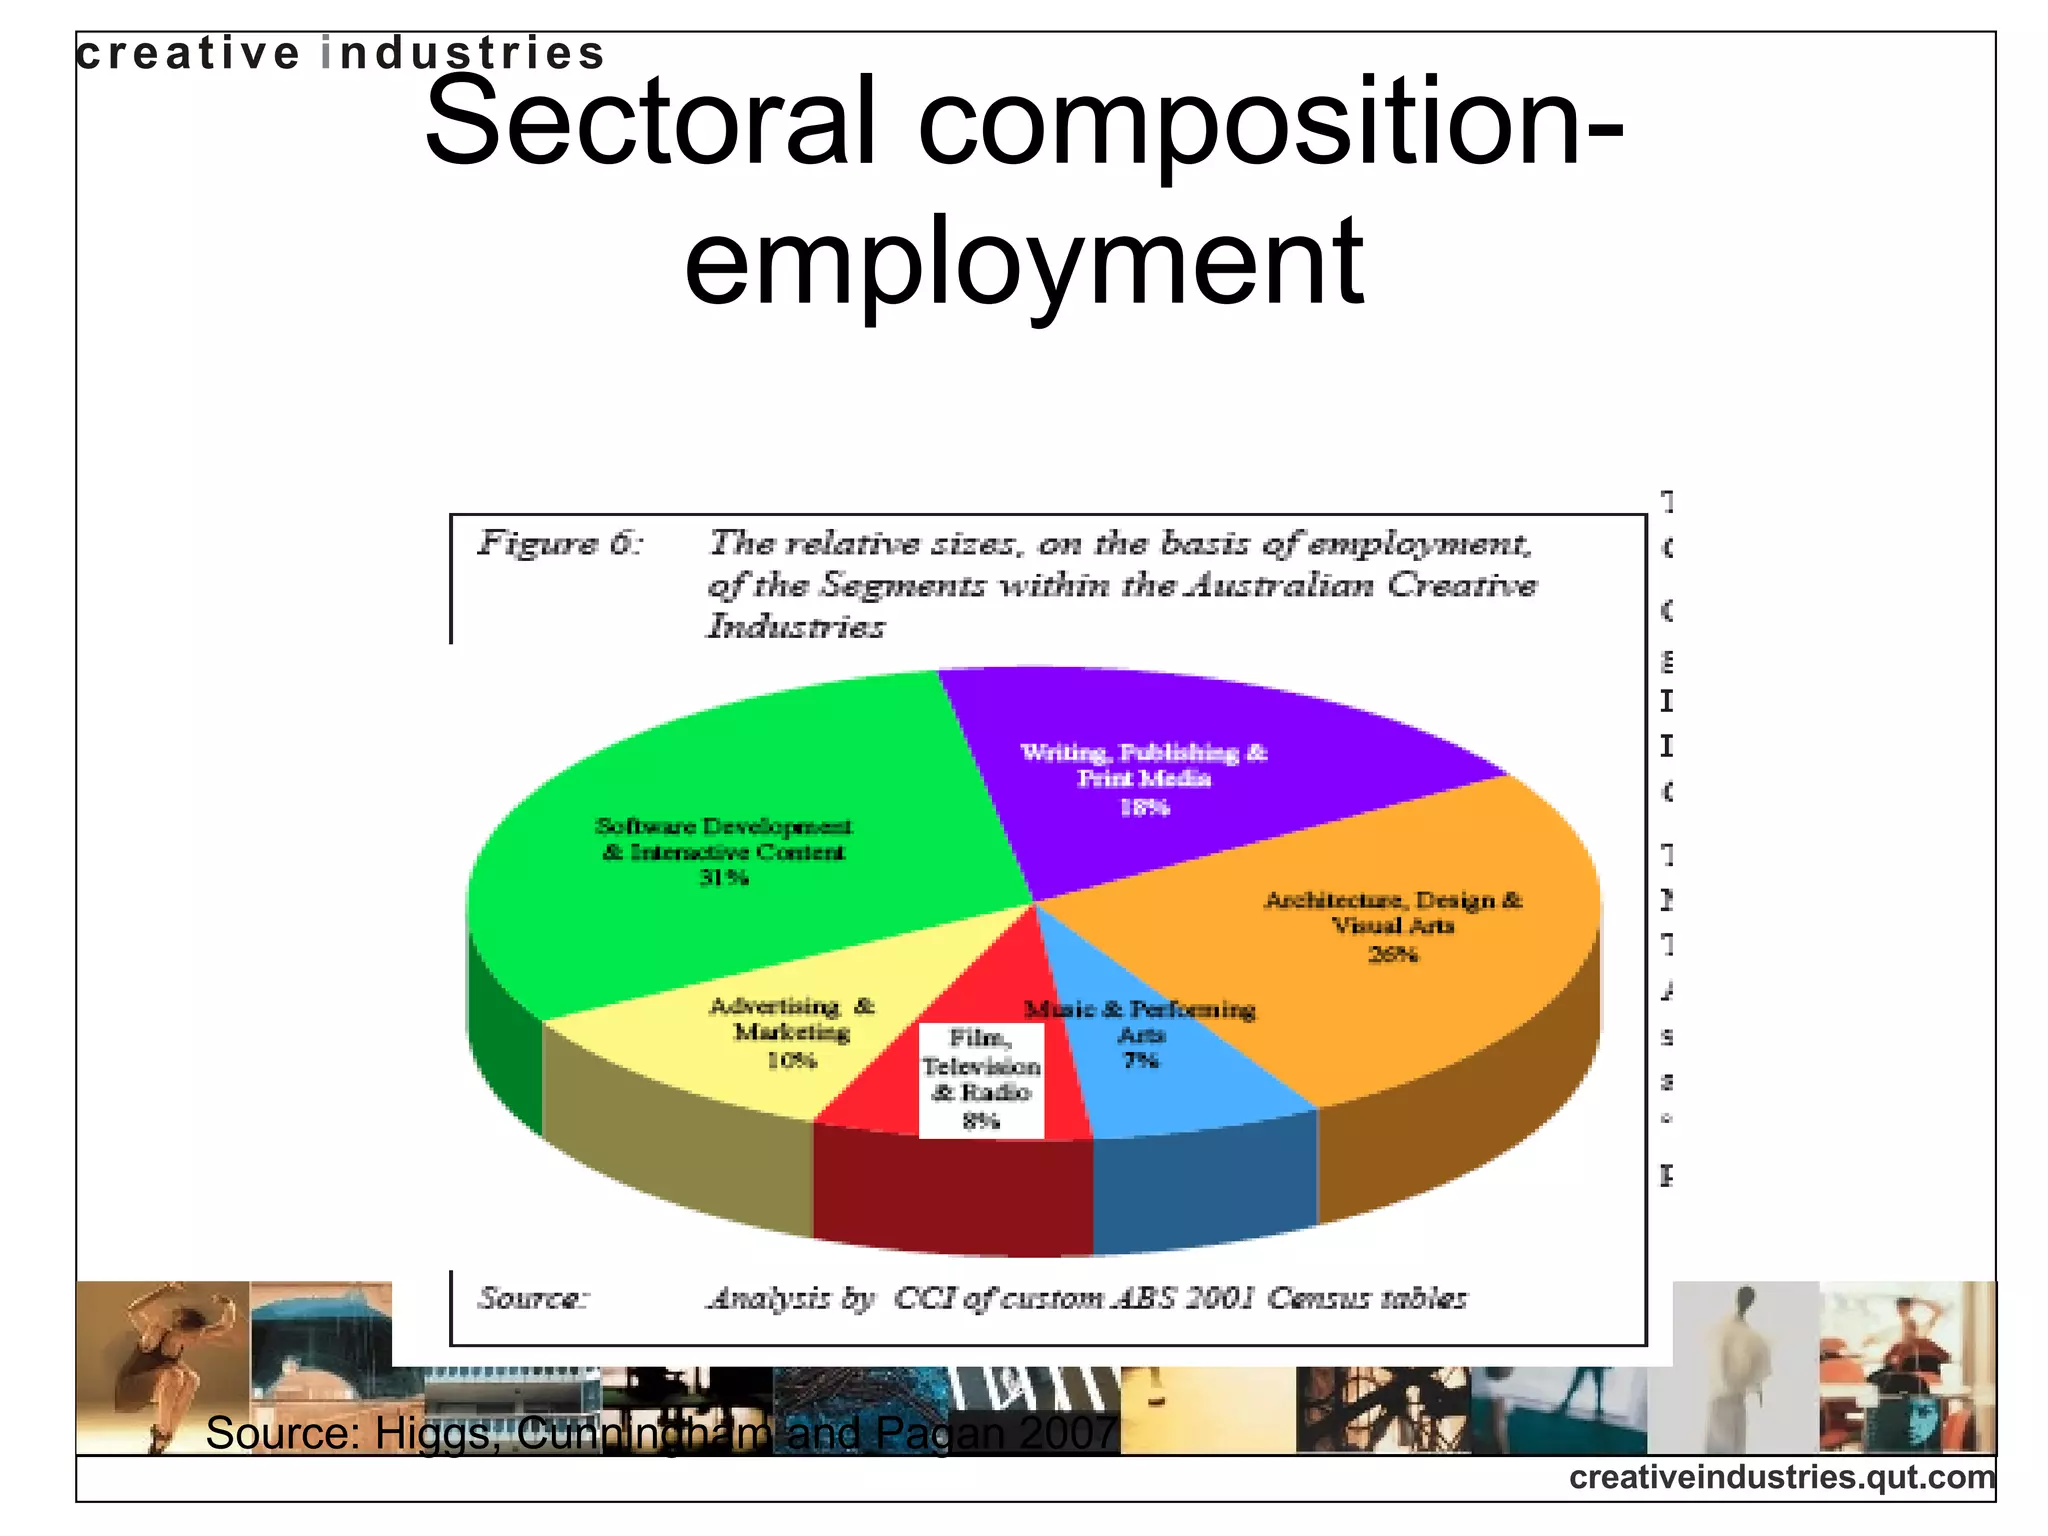
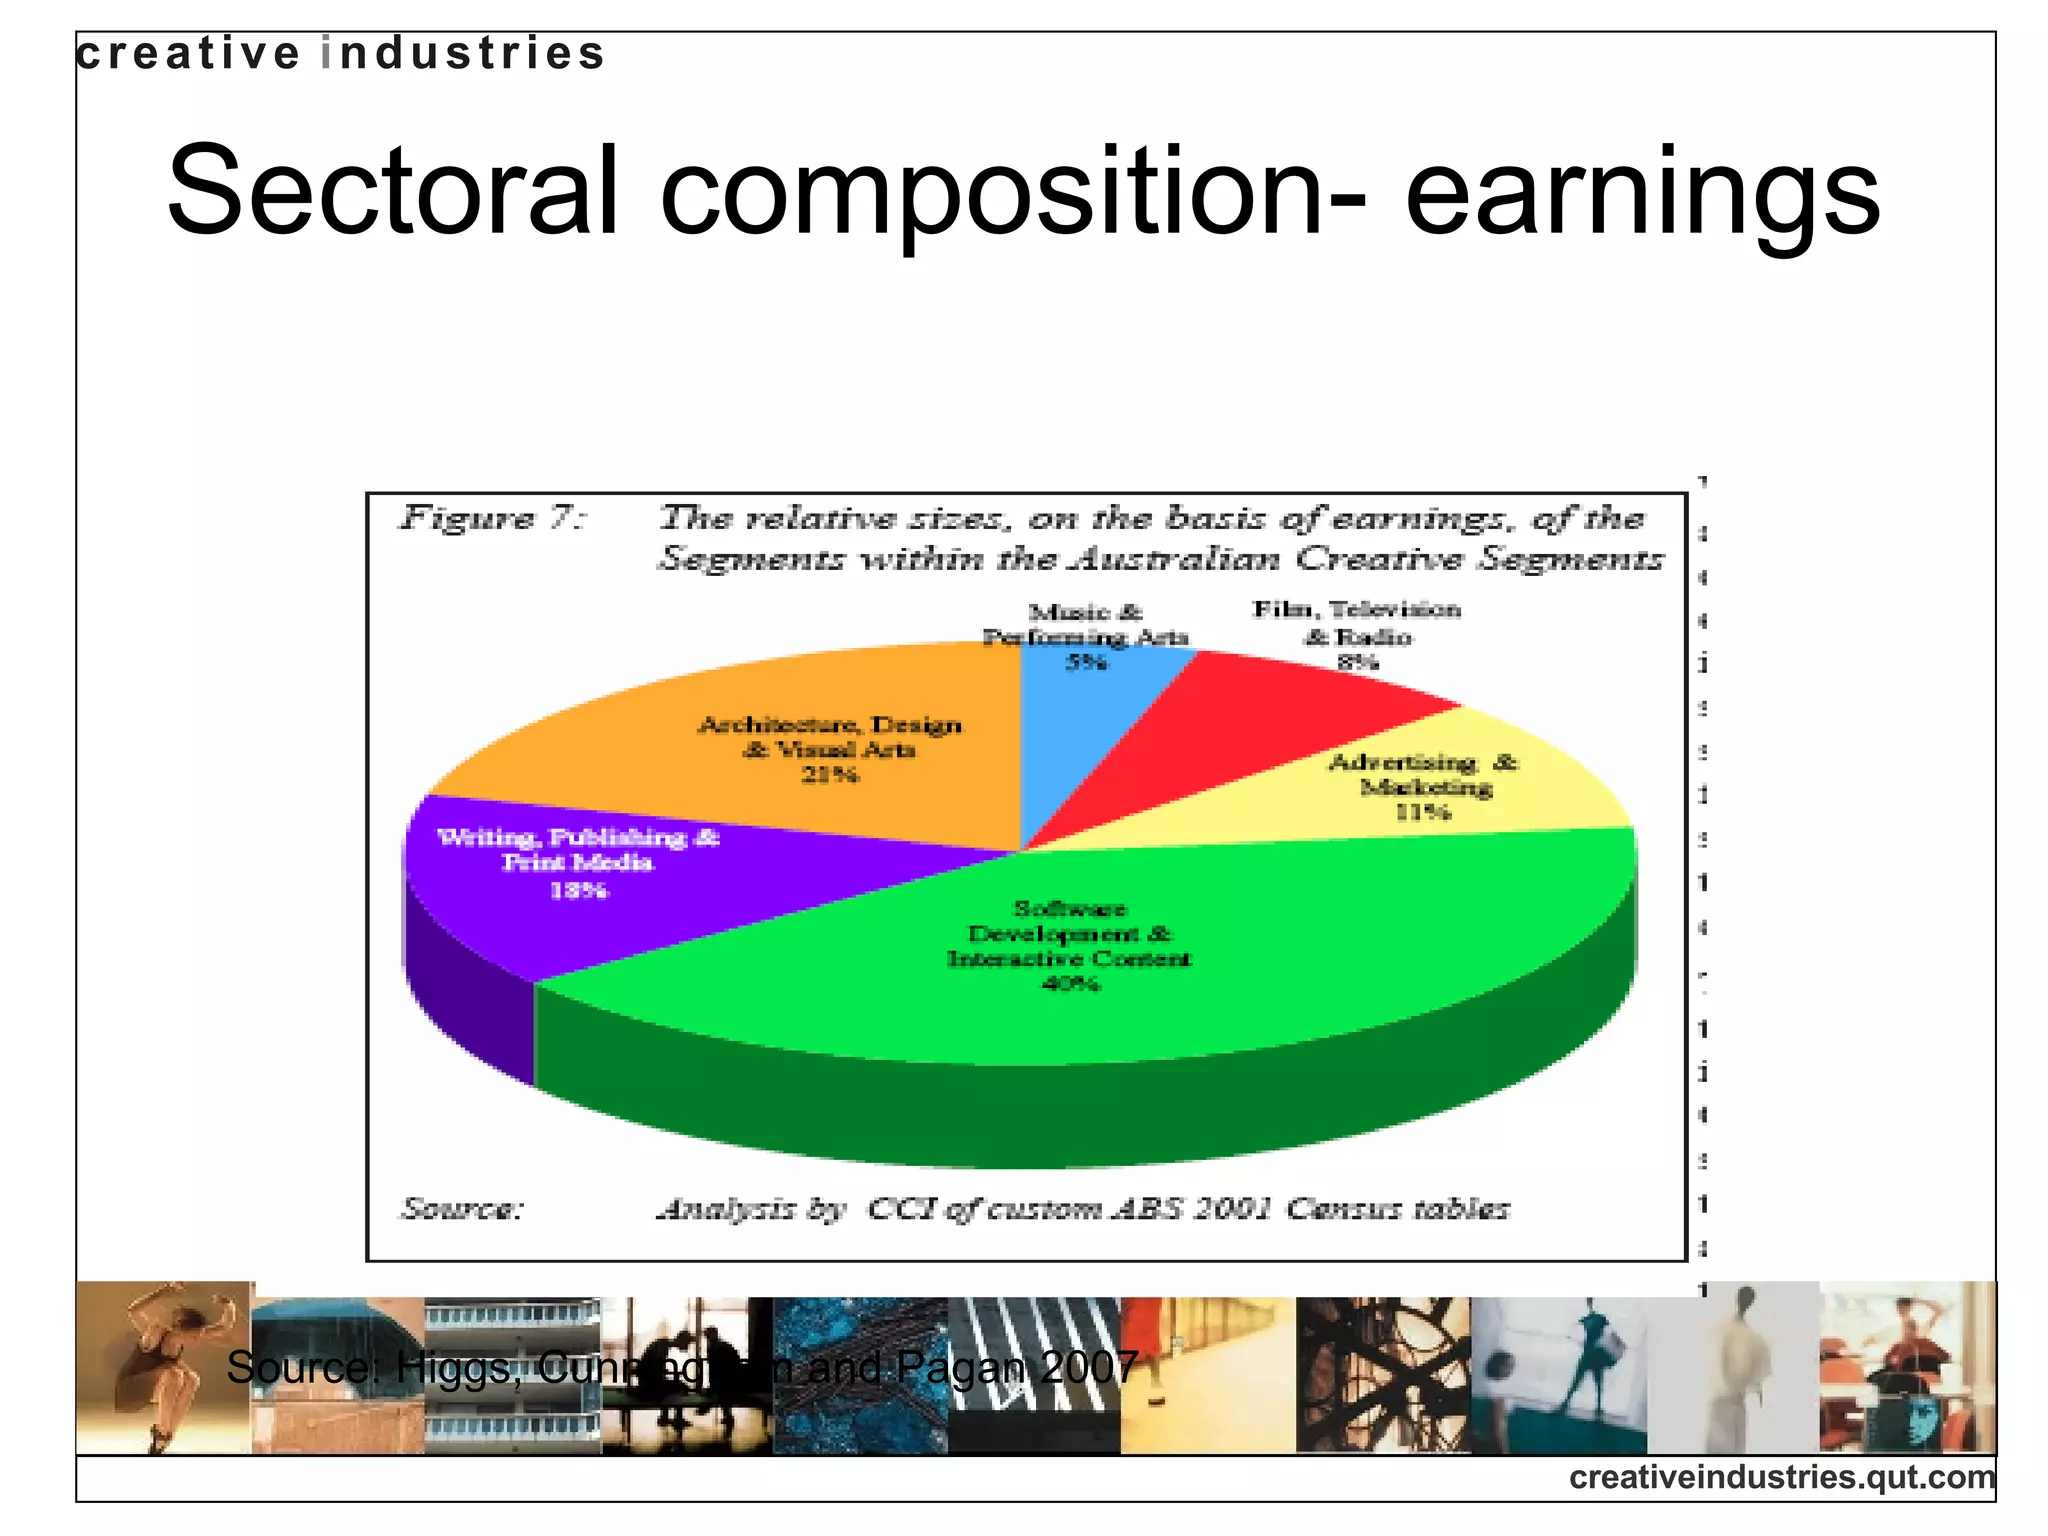
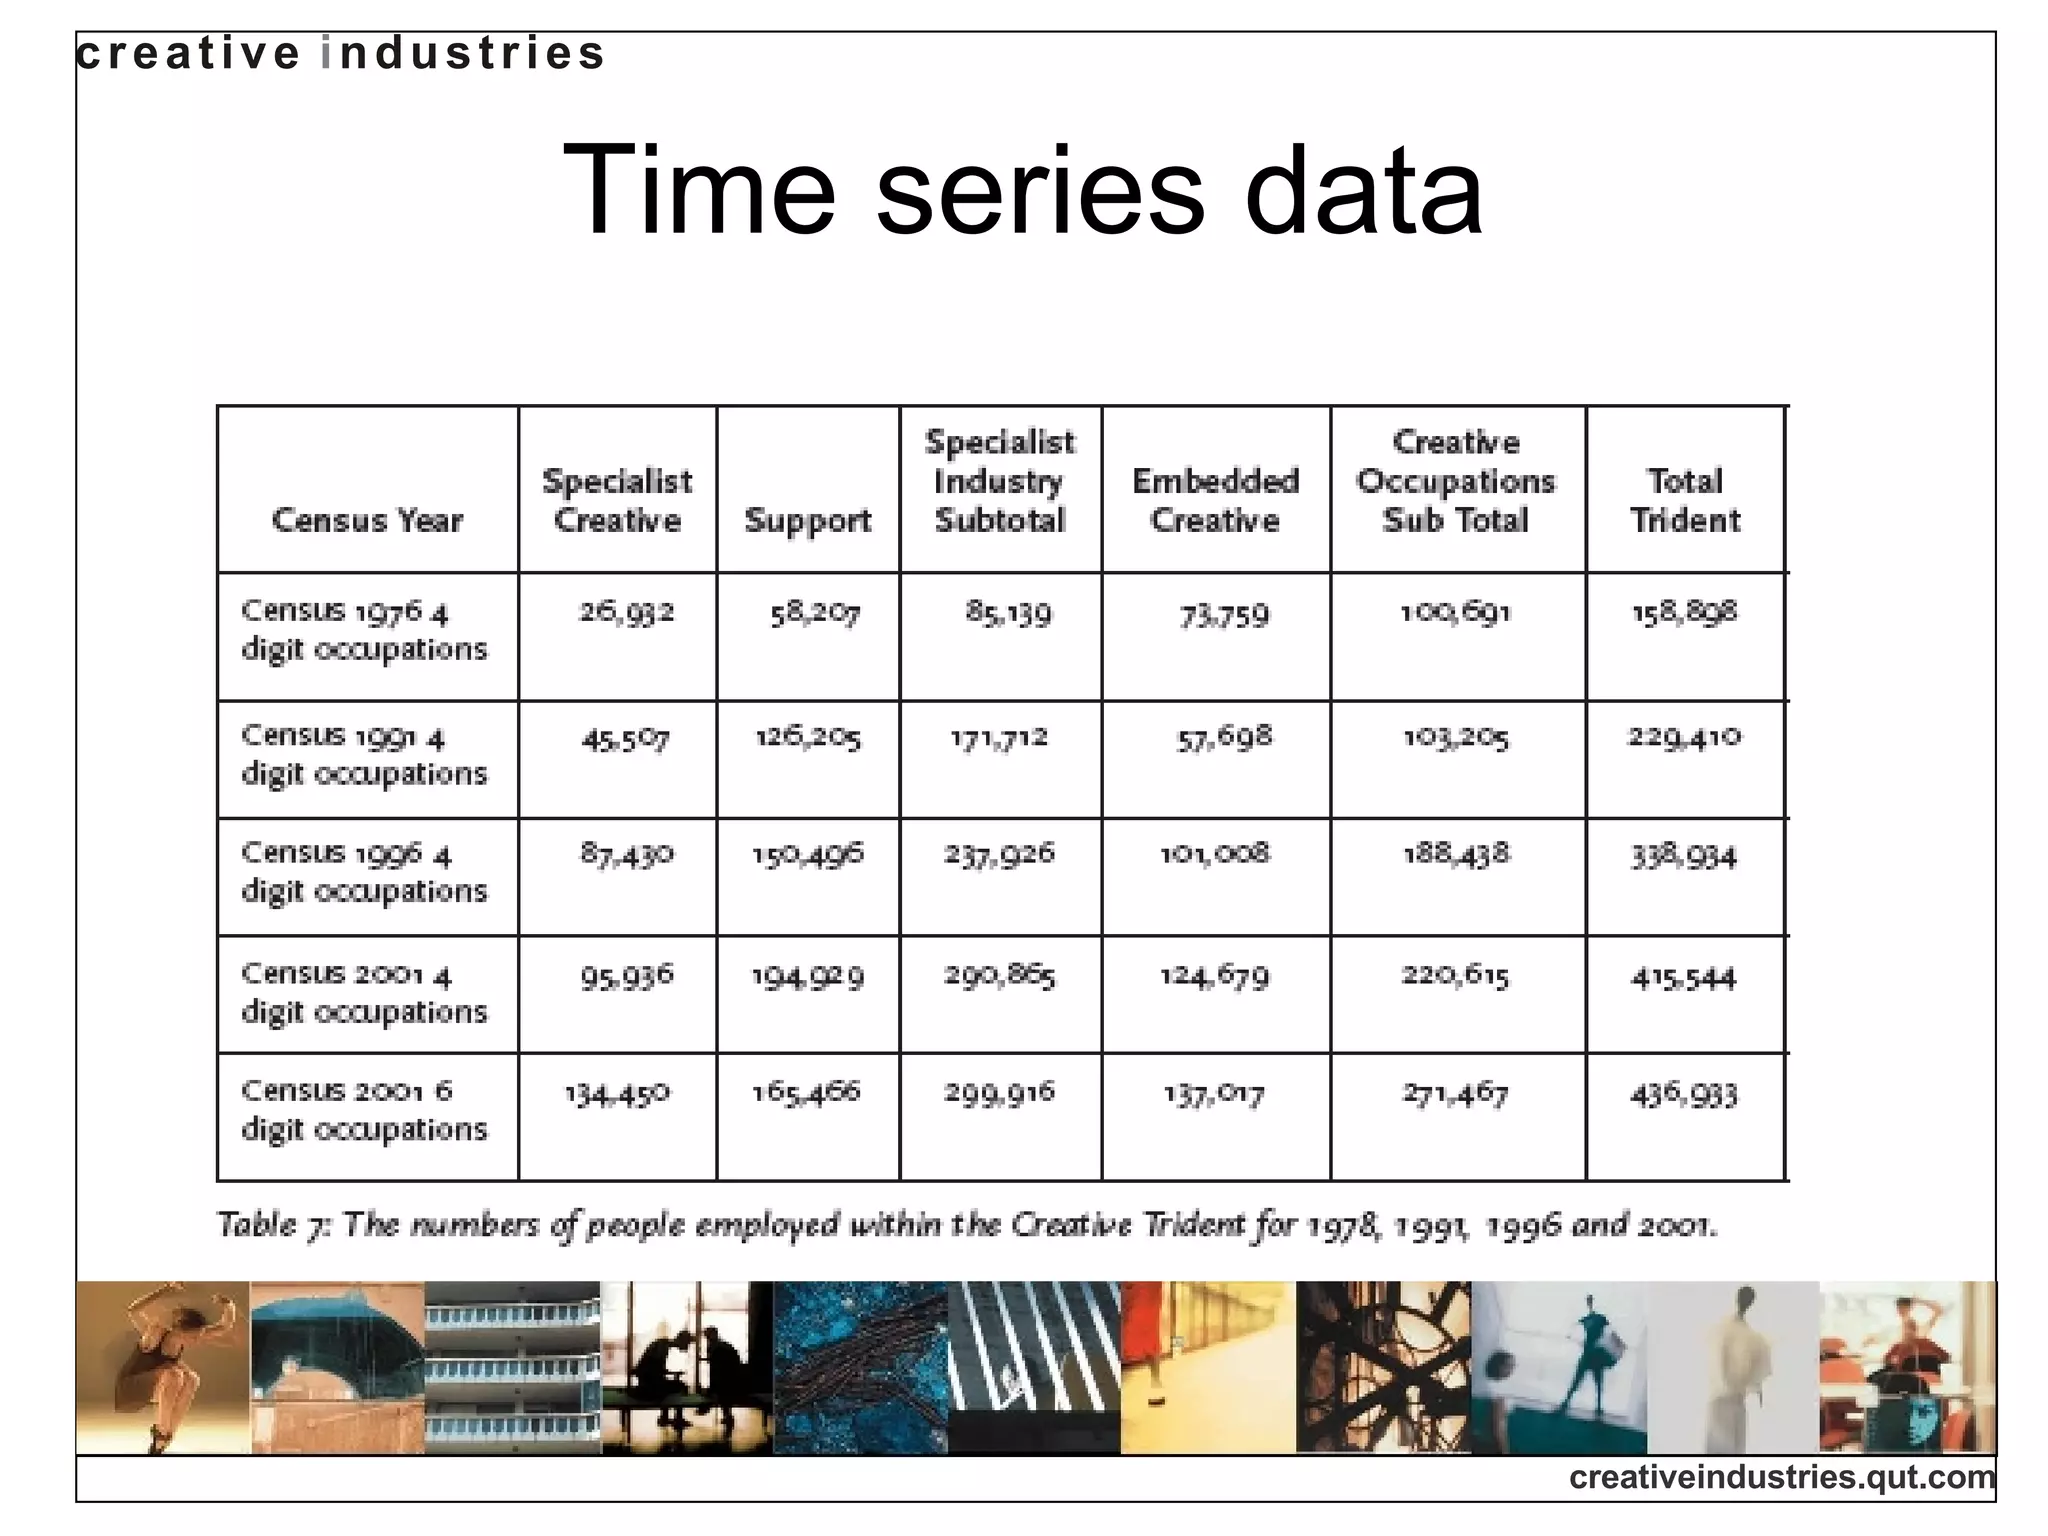
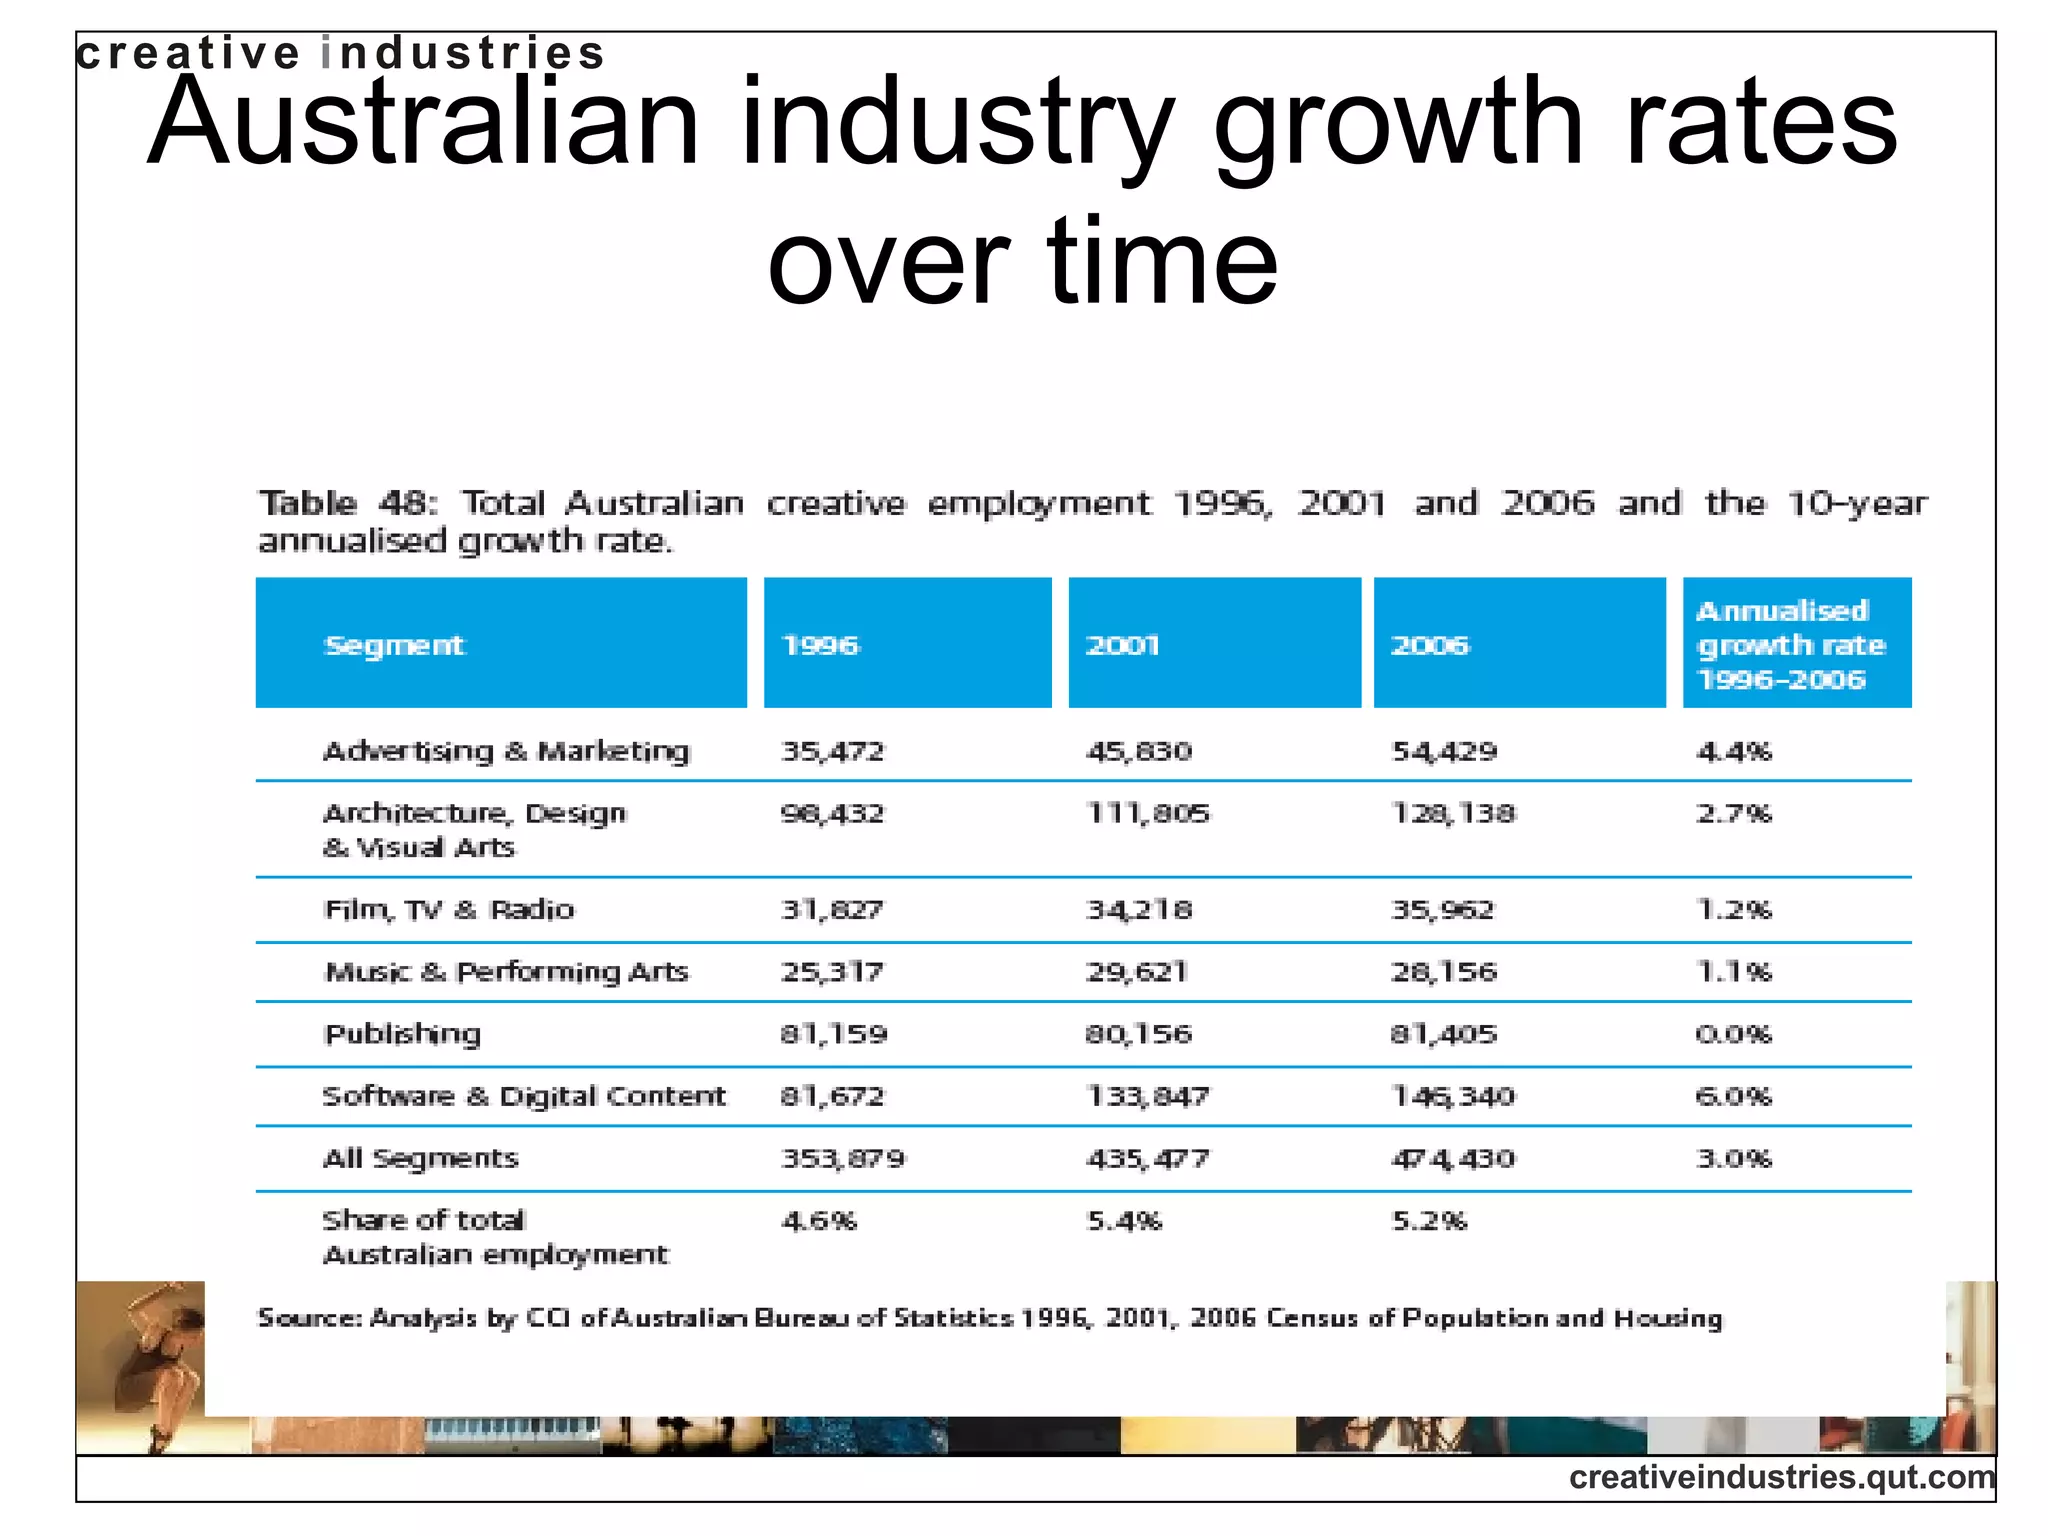
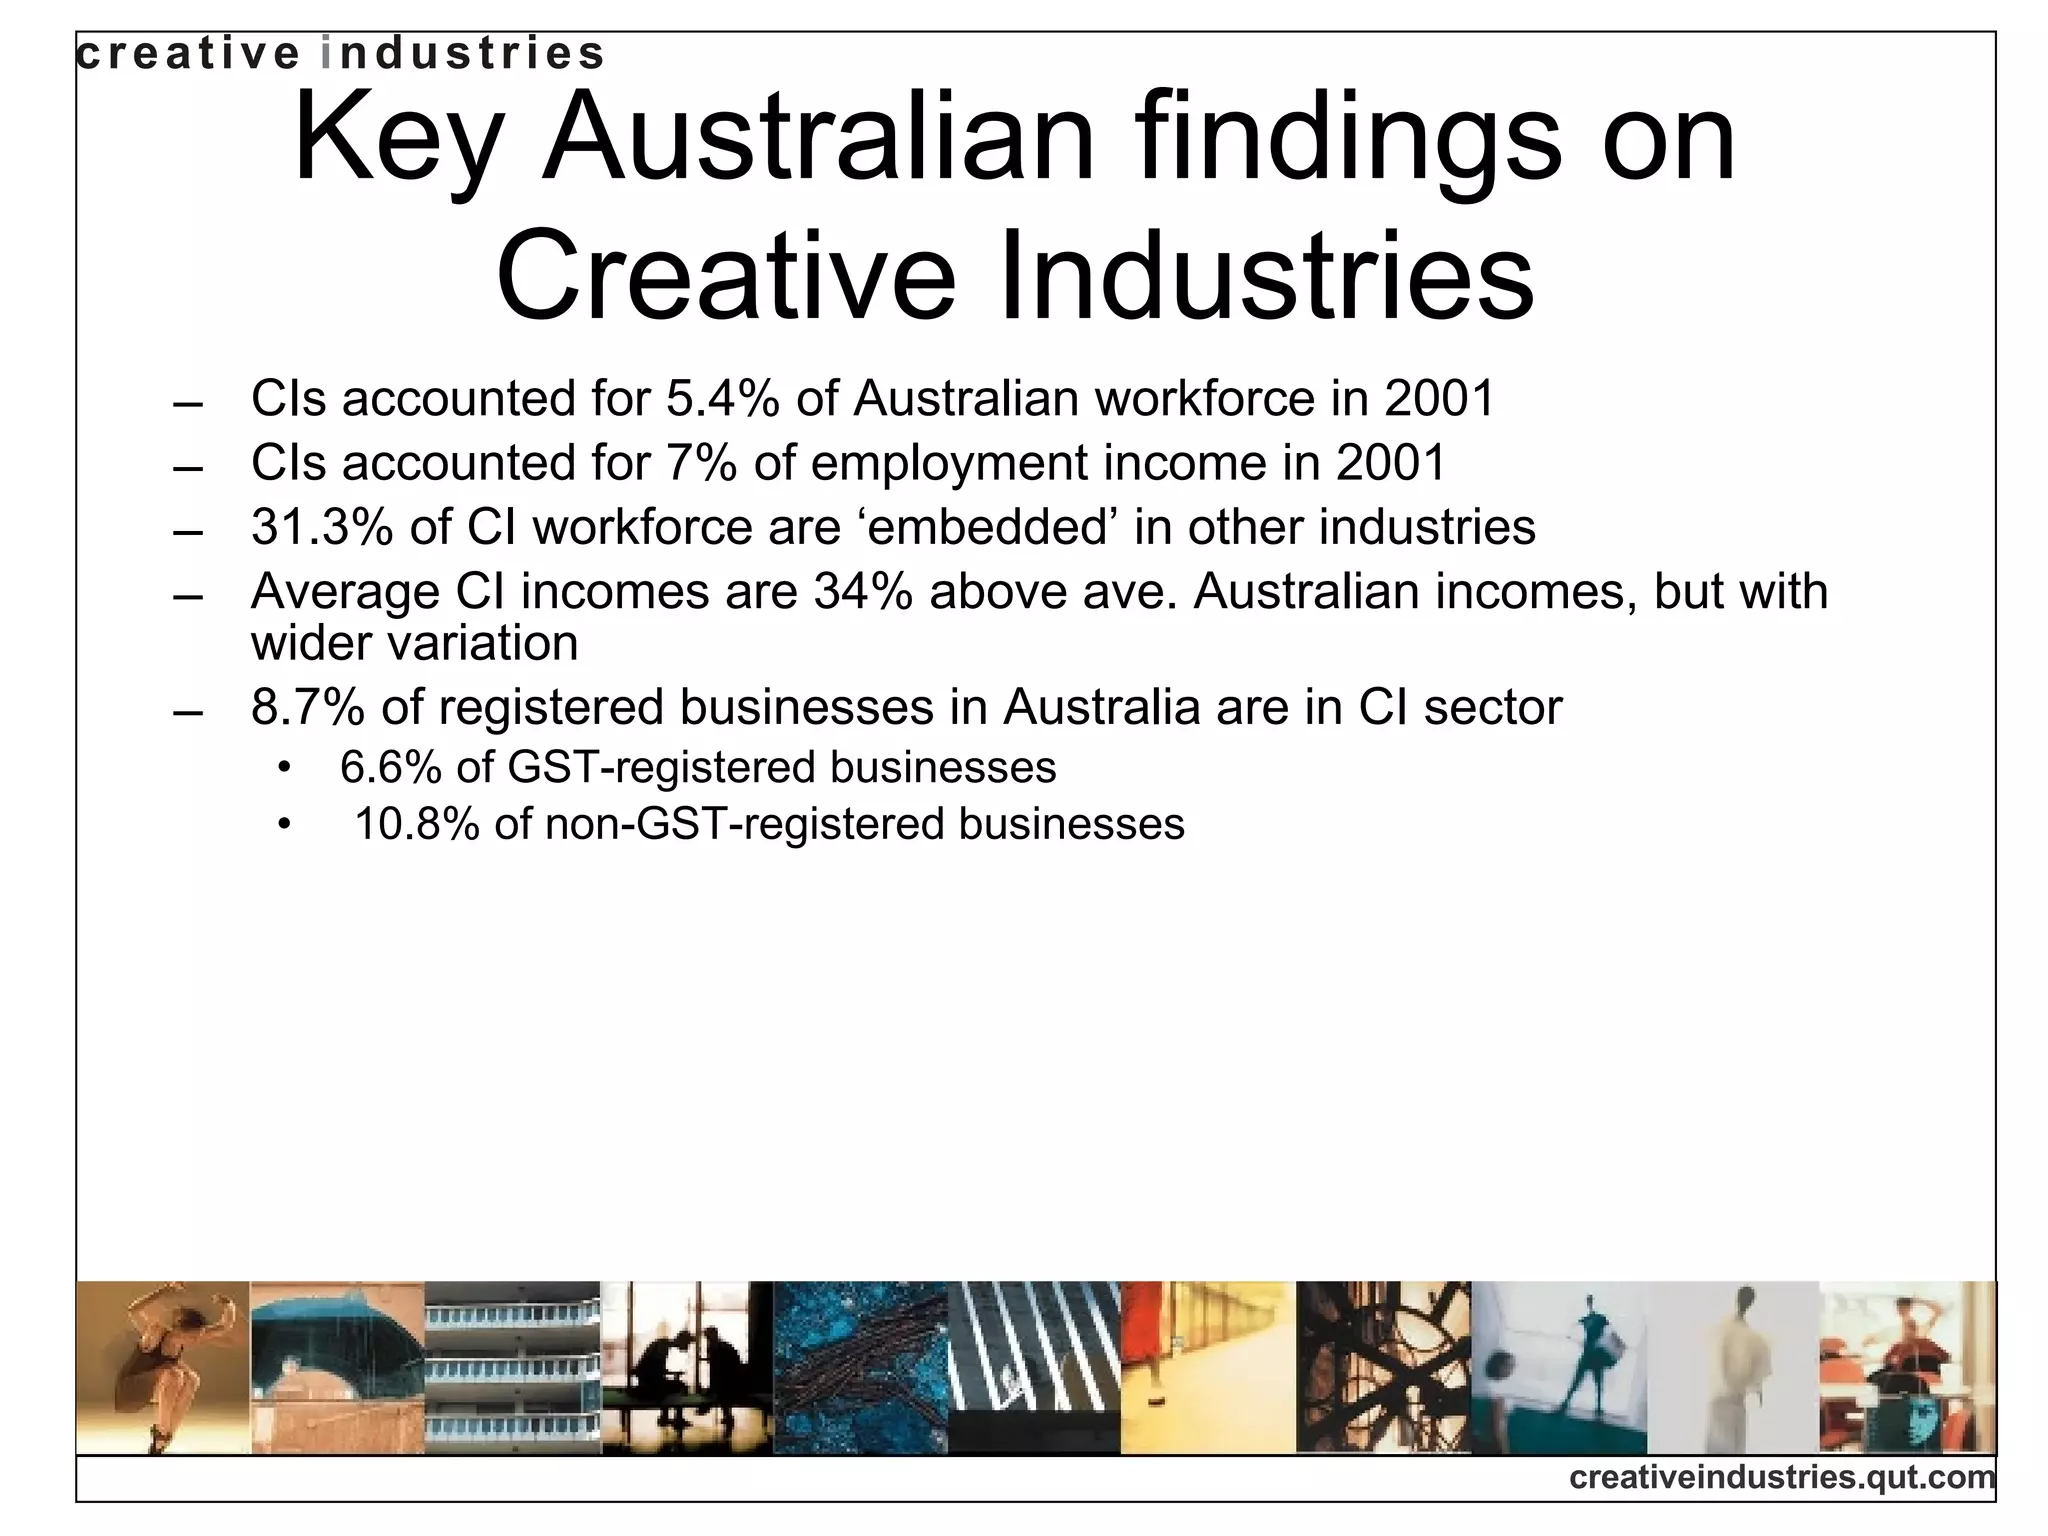
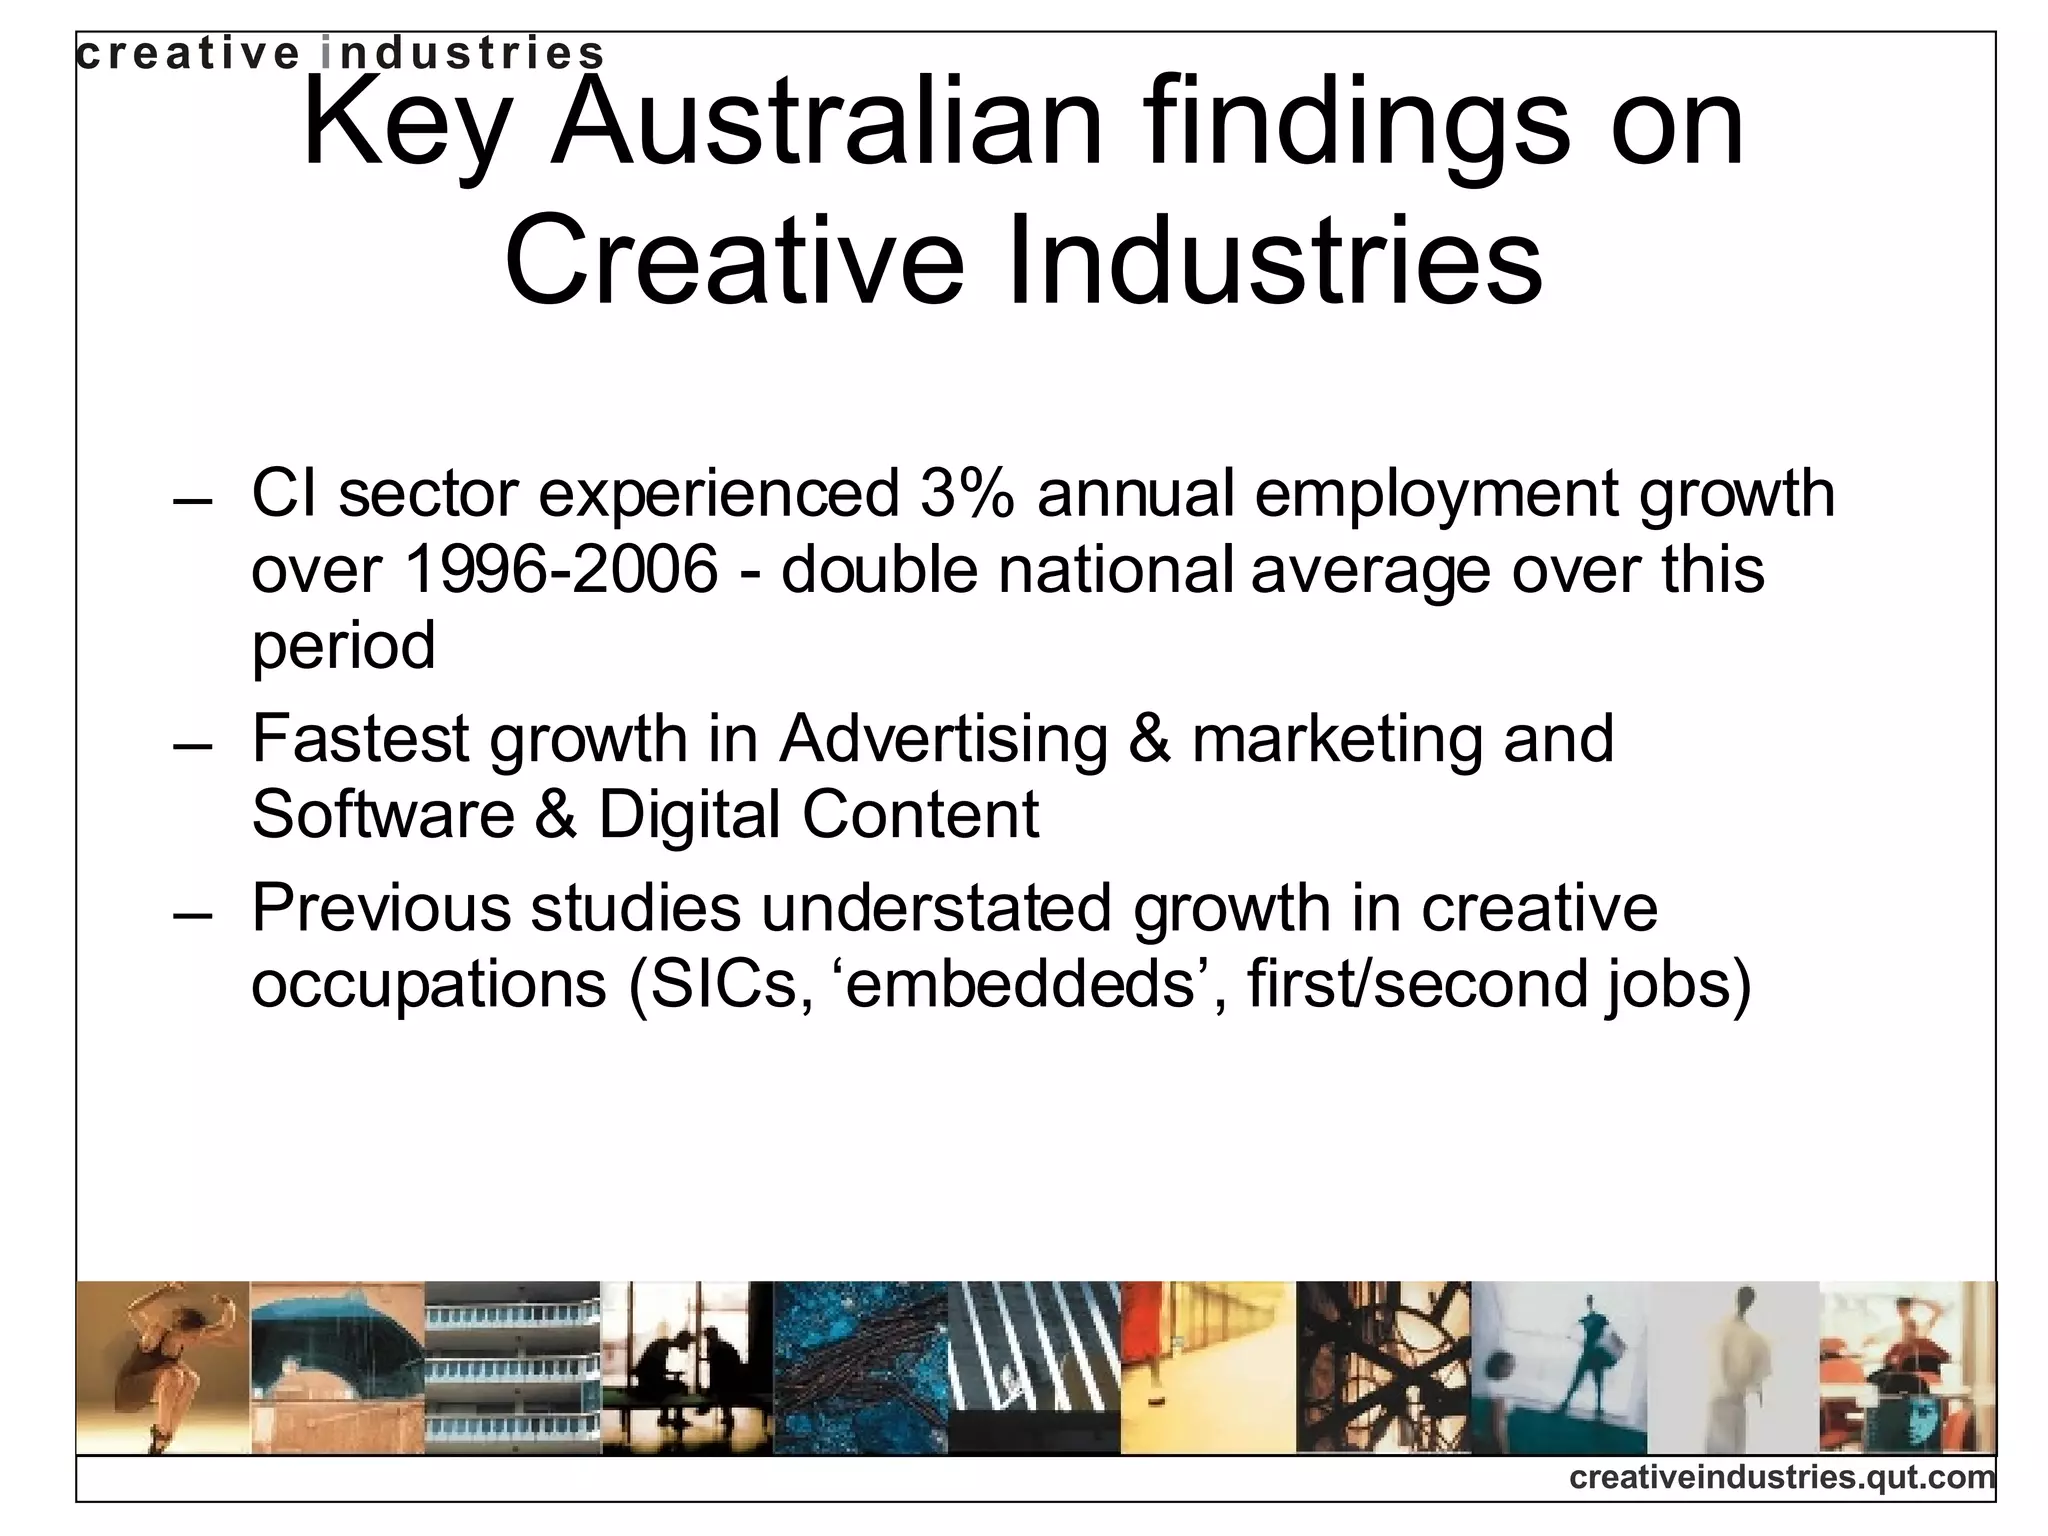
Creative Industries after a Decade: An Australian Perspective Professor Terry Flew Creative Industries Faculty, Q.U.T., Brisbane, Australia Guest lecture for  Creative Industries: Theory and Policy , 14 August 2008
UK DCMS 13 CI sectors Source: DCMS 1998
US: Copyright and Creative Industries COPYRIGHT INDUSTRIES 6% of GDP CREATIVE  (ARTS) INDUSTRIES 2.9% of GDP ? Source: IIPA 2006; Americans for the Arts 2008
Economic contribution of UK Creative Industries, 2004 Source: DCMS 2006
Cultural and Creative Industries Source: Flew 2002.
NESTA: Creative sectors Source: NESTA 2006
Work Foundation:  ‘concentric circles’ Source: The Work Foundation 2007
‘ Queensland Model’ of CIs Advertising, Graphic Design and Marketing; Architecture, Visual Arts and Design; Film, Television and Entertainment Software; Music Composition and Publishing; Performing Arts;  Writing, Publishing and Print Media.
 
Arts and Cultural Policy under the Howard Liberal Govt. 1996-2007
New Zealand: The ‘Lord of the Rings’ effect NZ Screen Production Investment 1994-2005
Uneven Development:  CIs as % of  total workforce  AUSTRALIAN CITIES Sydney: 3.9% Melbourne: 2.9% Brisbane: 2.4% Perth: 2.2% Adelaide: 2.1% NATIONAL AVE: 2.35% NEW ZEALAND CITIES Auckland: 5.1% Wellington: 4.1% Christchurch: 2% NATIONAL AVERAGE: 3.1%
Drivers of Creative Industries Demand (UNCTAD) Deregulation of media an cultural policies Rising average incomes DEMAND: ‘discretionary’ goods & services with higher cultural/symbolic content SUPPLY: younger people identifying non-monetary as well as monetary motivations Technological change Rise of the service economy International trade
Market Features of the Creative Industries (Caves) Demand uncertainty for ‘experience goods’ Mix of non-monetary motivations and need for ‘humdrum’ activities Collective production - creative teams with diverse skills Infinite variety of creative products Vertically differentiated skills (‘A list’/ ‘B list’) Need to coordinate diverse creative activities in limited time frame Durability of cultural products and scope for economic rents over time (copyright value)
Clustering Dynamics  in the Creative Industries Allen Scott: five clustering drivers Importance of specific labor inputs and tacit knowledge Dense SME networks Intermittent project-based work Synergistic benefits of collective learning Development of associated services and infrastructure; supportive government policies Charles Landry:  soft infrastructure  of creative cities Richard Florida:  power of place  and value of tolerance, diversity and openness
Mapping the creative industries workforce First iteration Industries occupations
Problems Disaggregation across value chain Creation Manufacturing Distribution Retailing Archiving & institutional support (e.g. libraies, museums, galleries) Education & infrastructural support Problems with use of SIC data Over-reach between ‘core’ and ‘support’ activities Under-stating of ‘embedded’ creatives
Creative Trident Specialist creatives (cultural occupation/cultural industry Embedded creatives (cultural occupation/non-cultural industry Support activities (non-cultural occupation/cultural industry
Australian creative workforce - using creative trident Source:   Higgs, Cunningham and Pagan 2007.
Value of Australian CIs -  using creative trident Source:   Higgs, Cunningham and Pagan 2007.
 
Sectoral composition- employment Source: Higgs, Cunningham and Pagan 2007
Sectoral composition- earnings Source: Higgs, Cunningham and Pagan 2007
Time series data
Density (no. per 100,000 workers)
Digital creative/cultural industries workforce
Australian industry growth rates over time
Further issues: income variations
Further issues: self-employment
Further issues: first and second jobs - UK data
Key Australian findings on Creative Industries CIs accounted for 5.4% of Australian workforce in 2001 CIs accounted for 7% of employment income in 2001 31.3% of CI workforce are ‘embedded’ in other industries Average CI incomes are 34% above ave. Australian incomes, but with wider variation 8.7% of registered businesses in Australia are in CI sector 6.6% of GST-registered businesses 10.8% of non-GST-registered businesses
Key Australian findings on Creative Industries CI sector experienced 3% annual employment growth over 1996-2006 - double national average over this period Fastest growth in Advertising & marketing and Software & Digital Content Previous studies understated growth in creative occupations (SICs, ‘embeddeds’, first/second jobs)
Wider implications of the rise of creative industries 1. The size and significance of the creative industries is greater than we have previously acknowledged, although its exact size and significance remains hard to pin down; 2. Definitional frameworks are being clarified, albeit slowly and unevenly; 3. The sector is heterogeneous, and is difficult to self-represent as a sector; 4. Wider trends in the economy and labour market are reflected in the creative industries; 5. Creative industries is a policy discourse, and marks a turn from critique to policy orientations in critical humanities scholarship;
Wider implications of the rise of creative industries Policies to develop creative industries will not be the same in different places; Creative industries are not a universal policy panacea; Creative industries are not a proxy category for the arts; Creative industries education points to interdisciplinarity e.g. business and legal knowledge as well as creative and contextual; Creative industries education needs to pay attention to the ‘embedded’ as well as the ‘specialist’ creatives.
Further references Australian Research Council Centre of Excellence for Creative Industries and Innovation <   http://www. cci .edu.au/ >. Caves, Richard (2001)  Creative Industries: Contracts Between Art and Commerce . Harvard University Press.  Cunningham, Stuart, and Higgs, Peter (2008) Creative Industries Mapping: Where have we come from and where are we going?  Creative Industries Journal  1(1), pp. 7-30.   Florida, Richard (2002)  The Rise of the Creative Class . New York: Basic Books. Higgs, Peter, Cunningham, Stuart and Pagan, Janet (2007)  Australia’s creative economy: Basic evidence on size, growth, income and employment.  Technical Report , Faculty Research Office, CCI. Higgs, Peter, Cunningham, Stuart and Bakhshi, Hasan (2008)  Beyond the Creative Industries: Mapping the Creative Economy in the United Kingdom . Technical Report. NESTA. February.
Further references Scott, Allen (2004) Cultural-Products Industries and Urban Economic Development: Prospect for Growth and Market Contestation in Global Context.  Urban Affairs Review  39(1), pp. 461-90.  Siwek, Stephen (2006)  Copyright Industries in the U.S. Economy  –  The 2006 Report . International Intellectual Property Alliance. November.  The Work Foundation (2007)  Staying Ahead: The Economic Performance of the UK’s Creative Industries .  < www. theworkfoundation . com/products/publications/azpublications/creativeindustries . aspx >. Accessed 1 May 2008.   United Nations Commission for Trade, Aid and Development (2008)  Creative Economy Report 2008 . United Nations: Geneva.

Ci Theory And Policy Guest Lecture 14 Aug 08

  • 1.
    Creative Industries aftera Decade: An Australian Perspective Professor Terry Flew Creative Industries Faculty, Q.U.T., Brisbane, Australia Guest lecture for Creative Industries: Theory and Policy , 14 August 2008
  • 2.
    UK DCMS 13CI sectors Source: DCMS 1998
  • 3.
    US: Copyright andCreative Industries COPYRIGHT INDUSTRIES 6% of GDP CREATIVE (ARTS) INDUSTRIES 2.9% of GDP ? Source: IIPA 2006; Americans for the Arts 2008
  • 4.
    Economic contribution ofUK Creative Industries, 2004 Source: DCMS 2006
  • 5.
    Cultural and CreativeIndustries Source: Flew 2002.
  • 6.
    NESTA: Creative sectorsSource: NESTA 2006
  • 7.
    Work Foundation: ‘concentric circles’ Source: The Work Foundation 2007
  • 8.
    ‘ Queensland Model’of CIs Advertising, Graphic Design and Marketing; Architecture, Visual Arts and Design; Film, Television and Entertainment Software; Music Composition and Publishing; Performing Arts;  Writing, Publishing and Print Media.
  • 9.
  • 10.
    Arts and CulturalPolicy under the Howard Liberal Govt. 1996-2007
  • 11.
    New Zealand: The‘Lord of the Rings’ effect NZ Screen Production Investment 1994-2005
  • 12.
    Uneven Development: CIs as % of total workforce AUSTRALIAN CITIES Sydney: 3.9% Melbourne: 2.9% Brisbane: 2.4% Perth: 2.2% Adelaide: 2.1% NATIONAL AVE: 2.35% NEW ZEALAND CITIES Auckland: 5.1% Wellington: 4.1% Christchurch: 2% NATIONAL AVERAGE: 3.1%
  • 13.
    Drivers of CreativeIndustries Demand (UNCTAD) Deregulation of media an cultural policies Rising average incomes DEMAND: ‘discretionary’ goods & services with higher cultural/symbolic content SUPPLY: younger people identifying non-monetary as well as monetary motivations Technological change Rise of the service economy International trade
  • 14.
    Market Features ofthe Creative Industries (Caves) Demand uncertainty for ‘experience goods’ Mix of non-monetary motivations and need for ‘humdrum’ activities Collective production - creative teams with diverse skills Infinite variety of creative products Vertically differentiated skills (‘A list’/ ‘B list’) Need to coordinate diverse creative activities in limited time frame Durability of cultural products and scope for economic rents over time (copyright value)
  • 15.
    Clustering Dynamics in the Creative Industries Allen Scott: five clustering drivers Importance of specific labor inputs and tacit knowledge Dense SME networks Intermittent project-based work Synergistic benefits of collective learning Development of associated services and infrastructure; supportive government policies Charles Landry: soft infrastructure of creative cities Richard Florida: power of place and value of tolerance, diversity and openness
  • 16.
    Mapping the creativeindustries workforce First iteration Industries occupations
  • 17.
    Problems Disaggregation acrossvalue chain Creation Manufacturing Distribution Retailing Archiving & institutional support (e.g. libraies, museums, galleries) Education & infrastructural support Problems with use of SIC data Over-reach between ‘core’ and ‘support’ activities Under-stating of ‘embedded’ creatives
  • 18.
    Creative Trident Specialistcreatives (cultural occupation/cultural industry Embedded creatives (cultural occupation/non-cultural industry Support activities (non-cultural occupation/cultural industry
  • 19.
    Australian creative workforce- using creative trident Source: Higgs, Cunningham and Pagan 2007.
  • 20.
    Value of AustralianCIs - using creative trident Source: Higgs, Cunningham and Pagan 2007.
  • 21.
  • 22.
    Sectoral composition- employmentSource: Higgs, Cunningham and Pagan 2007
  • 23.
    Sectoral composition- earningsSource: Higgs, Cunningham and Pagan 2007
  • 24.
  • 25.
    Density (no. per100,000 workers)
  • 26.
  • 27.
  • 28.
  • 29.
  • 30.
    Further issues: firstand second jobs - UK data
  • 31.
    Key Australian findingson Creative Industries CIs accounted for 5.4% of Australian workforce in 2001 CIs accounted for 7% of employment income in 2001 31.3% of CI workforce are ‘embedded’ in other industries Average CI incomes are 34% above ave. Australian incomes, but with wider variation 8.7% of registered businesses in Australia are in CI sector 6.6% of GST-registered businesses 10.8% of non-GST-registered businesses
  • 32.
    Key Australian findingson Creative Industries CI sector experienced 3% annual employment growth over 1996-2006 - double national average over this period Fastest growth in Advertising & marketing and Software & Digital Content Previous studies understated growth in creative occupations (SICs, ‘embeddeds’, first/second jobs)
  • 33.
    Wider implications ofthe rise of creative industries 1. The size and significance of the creative industries is greater than we have previously acknowledged, although its exact size and significance remains hard to pin down; 2. Definitional frameworks are being clarified, albeit slowly and unevenly; 3. The sector is heterogeneous, and is difficult to self-represent as a sector; 4. Wider trends in the economy and labour market are reflected in the creative industries; 5. Creative industries is a policy discourse, and marks a turn from critique to policy orientations in critical humanities scholarship;
  • 34.
    Wider implications ofthe rise of creative industries Policies to develop creative industries will not be the same in different places; Creative industries are not a universal policy panacea; Creative industries are not a proxy category for the arts; Creative industries education points to interdisciplinarity e.g. business and legal knowledge as well as creative and contextual; Creative industries education needs to pay attention to the ‘embedded’ as well as the ‘specialist’ creatives.
  • 35.
    Further references AustralianResearch Council Centre of Excellence for Creative Industries and Innovation < http://www. cci .edu.au/ >. Caves, Richard (2001) Creative Industries: Contracts Between Art and Commerce . Harvard University Press. Cunningham, Stuart, and Higgs, Peter (2008) Creative Industries Mapping: Where have we come from and where are we going? Creative Industries Journal 1(1), pp. 7-30. Florida, Richard (2002) The Rise of the Creative Class . New York: Basic Books. Higgs, Peter, Cunningham, Stuart and Pagan, Janet (2007) Australia’s creative economy: Basic evidence on size, growth, income and employment. Technical Report , Faculty Research Office, CCI. Higgs, Peter, Cunningham, Stuart and Bakhshi, Hasan (2008) Beyond the Creative Industries: Mapping the Creative Economy in the United Kingdom . Technical Report. NESTA. February.
  • 36.
    Further references Scott,Allen (2004) Cultural-Products Industries and Urban Economic Development: Prospect for Growth and Market Contestation in Global Context. Urban Affairs Review 39(1), pp. 461-90. Siwek, Stephen (2006) Copyright Industries in the U.S. Economy – The 2006 Report . International Intellectual Property Alliance. November. The Work Foundation (2007) Staying Ahead: The Economic Performance of the UK’s Creative Industries . < www. theworkfoundation . com/products/publications/azpublications/creativeindustries . aspx >. Accessed 1 May 2008. United Nations Commission for Trade, Aid and Development (2008) Creative Economy Report 2008 . United Nations: Geneva.