Download to read offline

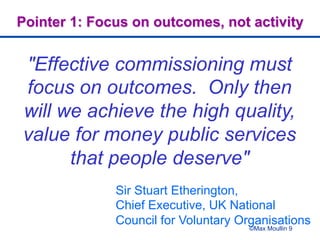

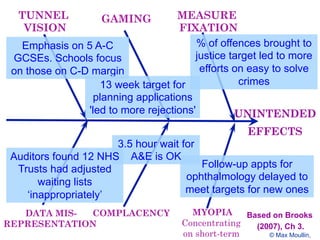

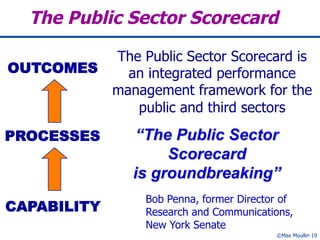
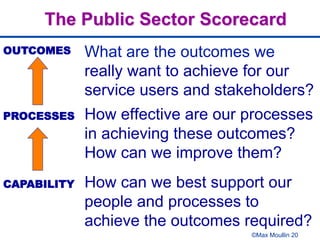
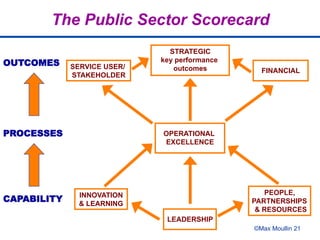
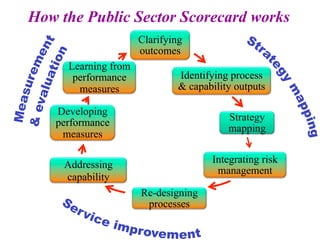
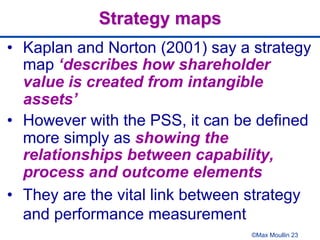
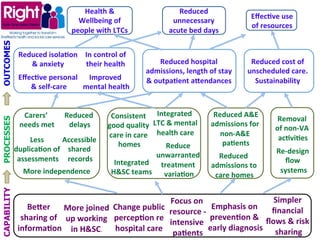

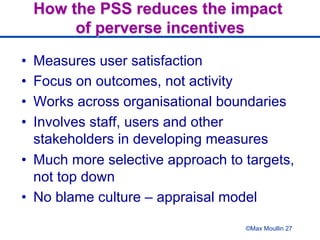
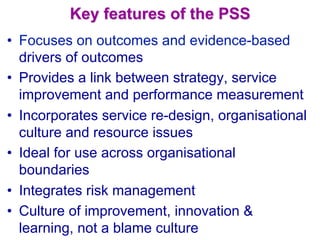
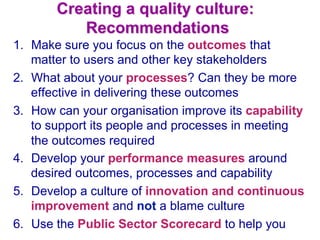
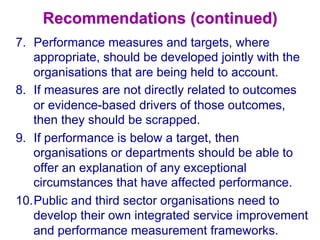


The document summarizes a presentation about creating a quality culture in the public sector. It discusses definitions of quality, examples of how targets can have unintended consequences, and recommendations for developing a quality culture. Key points include focusing on outcomes rather than activity, managing performance across organizational boundaries, integrating risk management, and developing a culture of continuous improvement rather than blame. The Public Sector Scorecard is presented as a framework that can help by clarifying outcomes, identifying processes and capabilities, developing strategy maps, and integrating performance measurement into learning and improvement.


