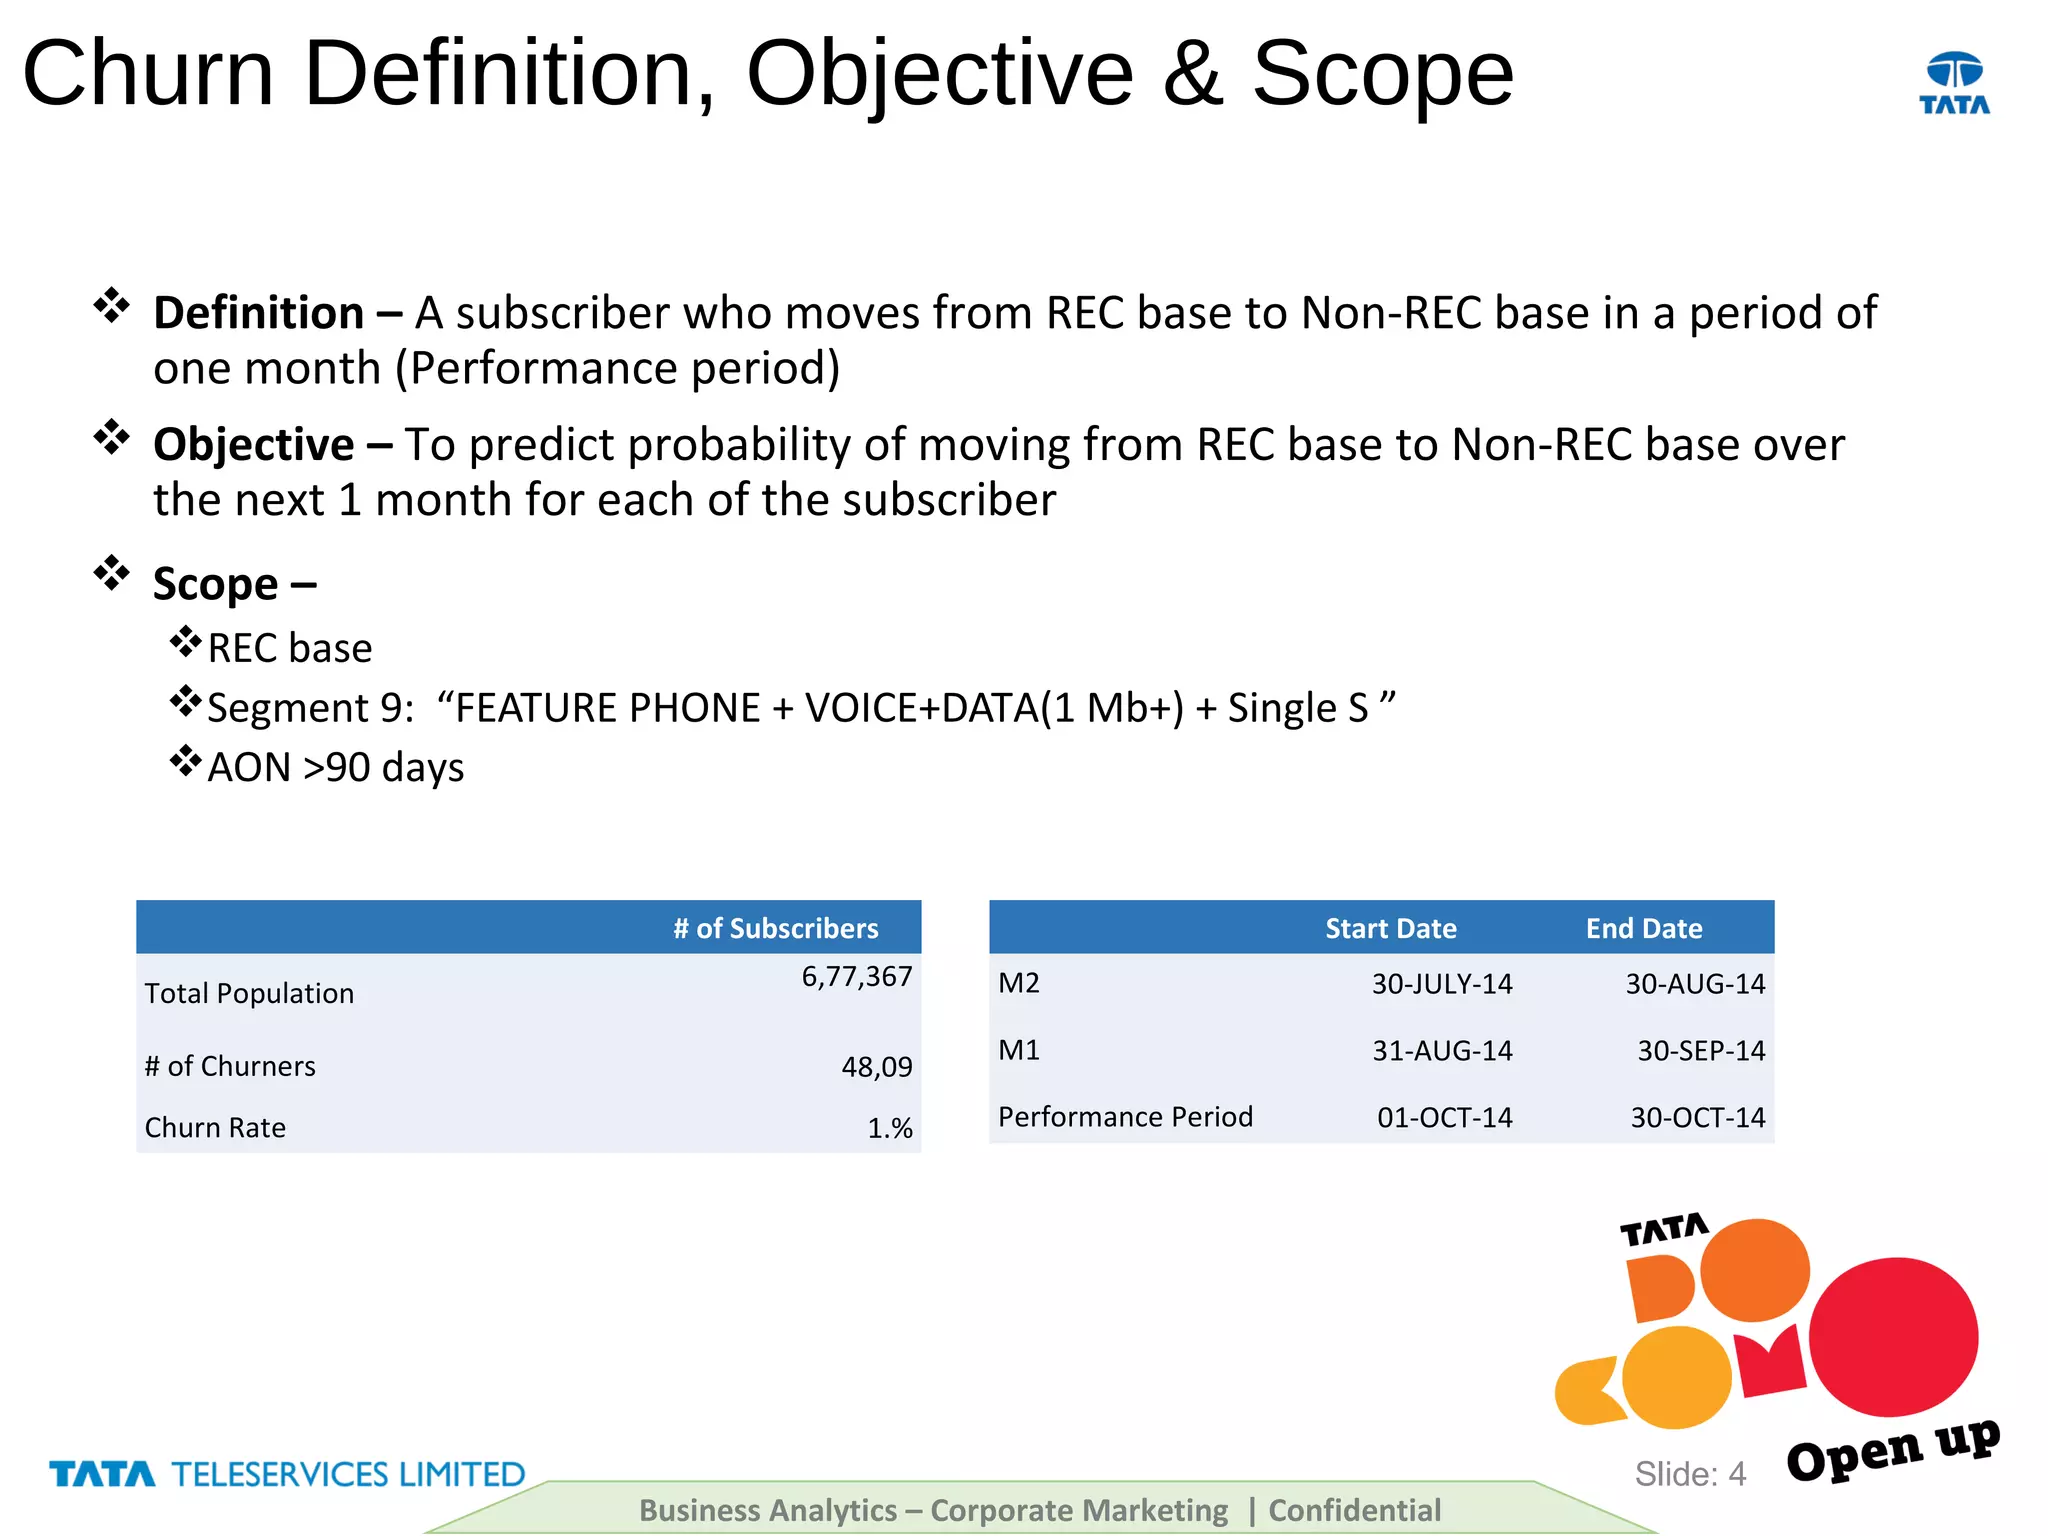
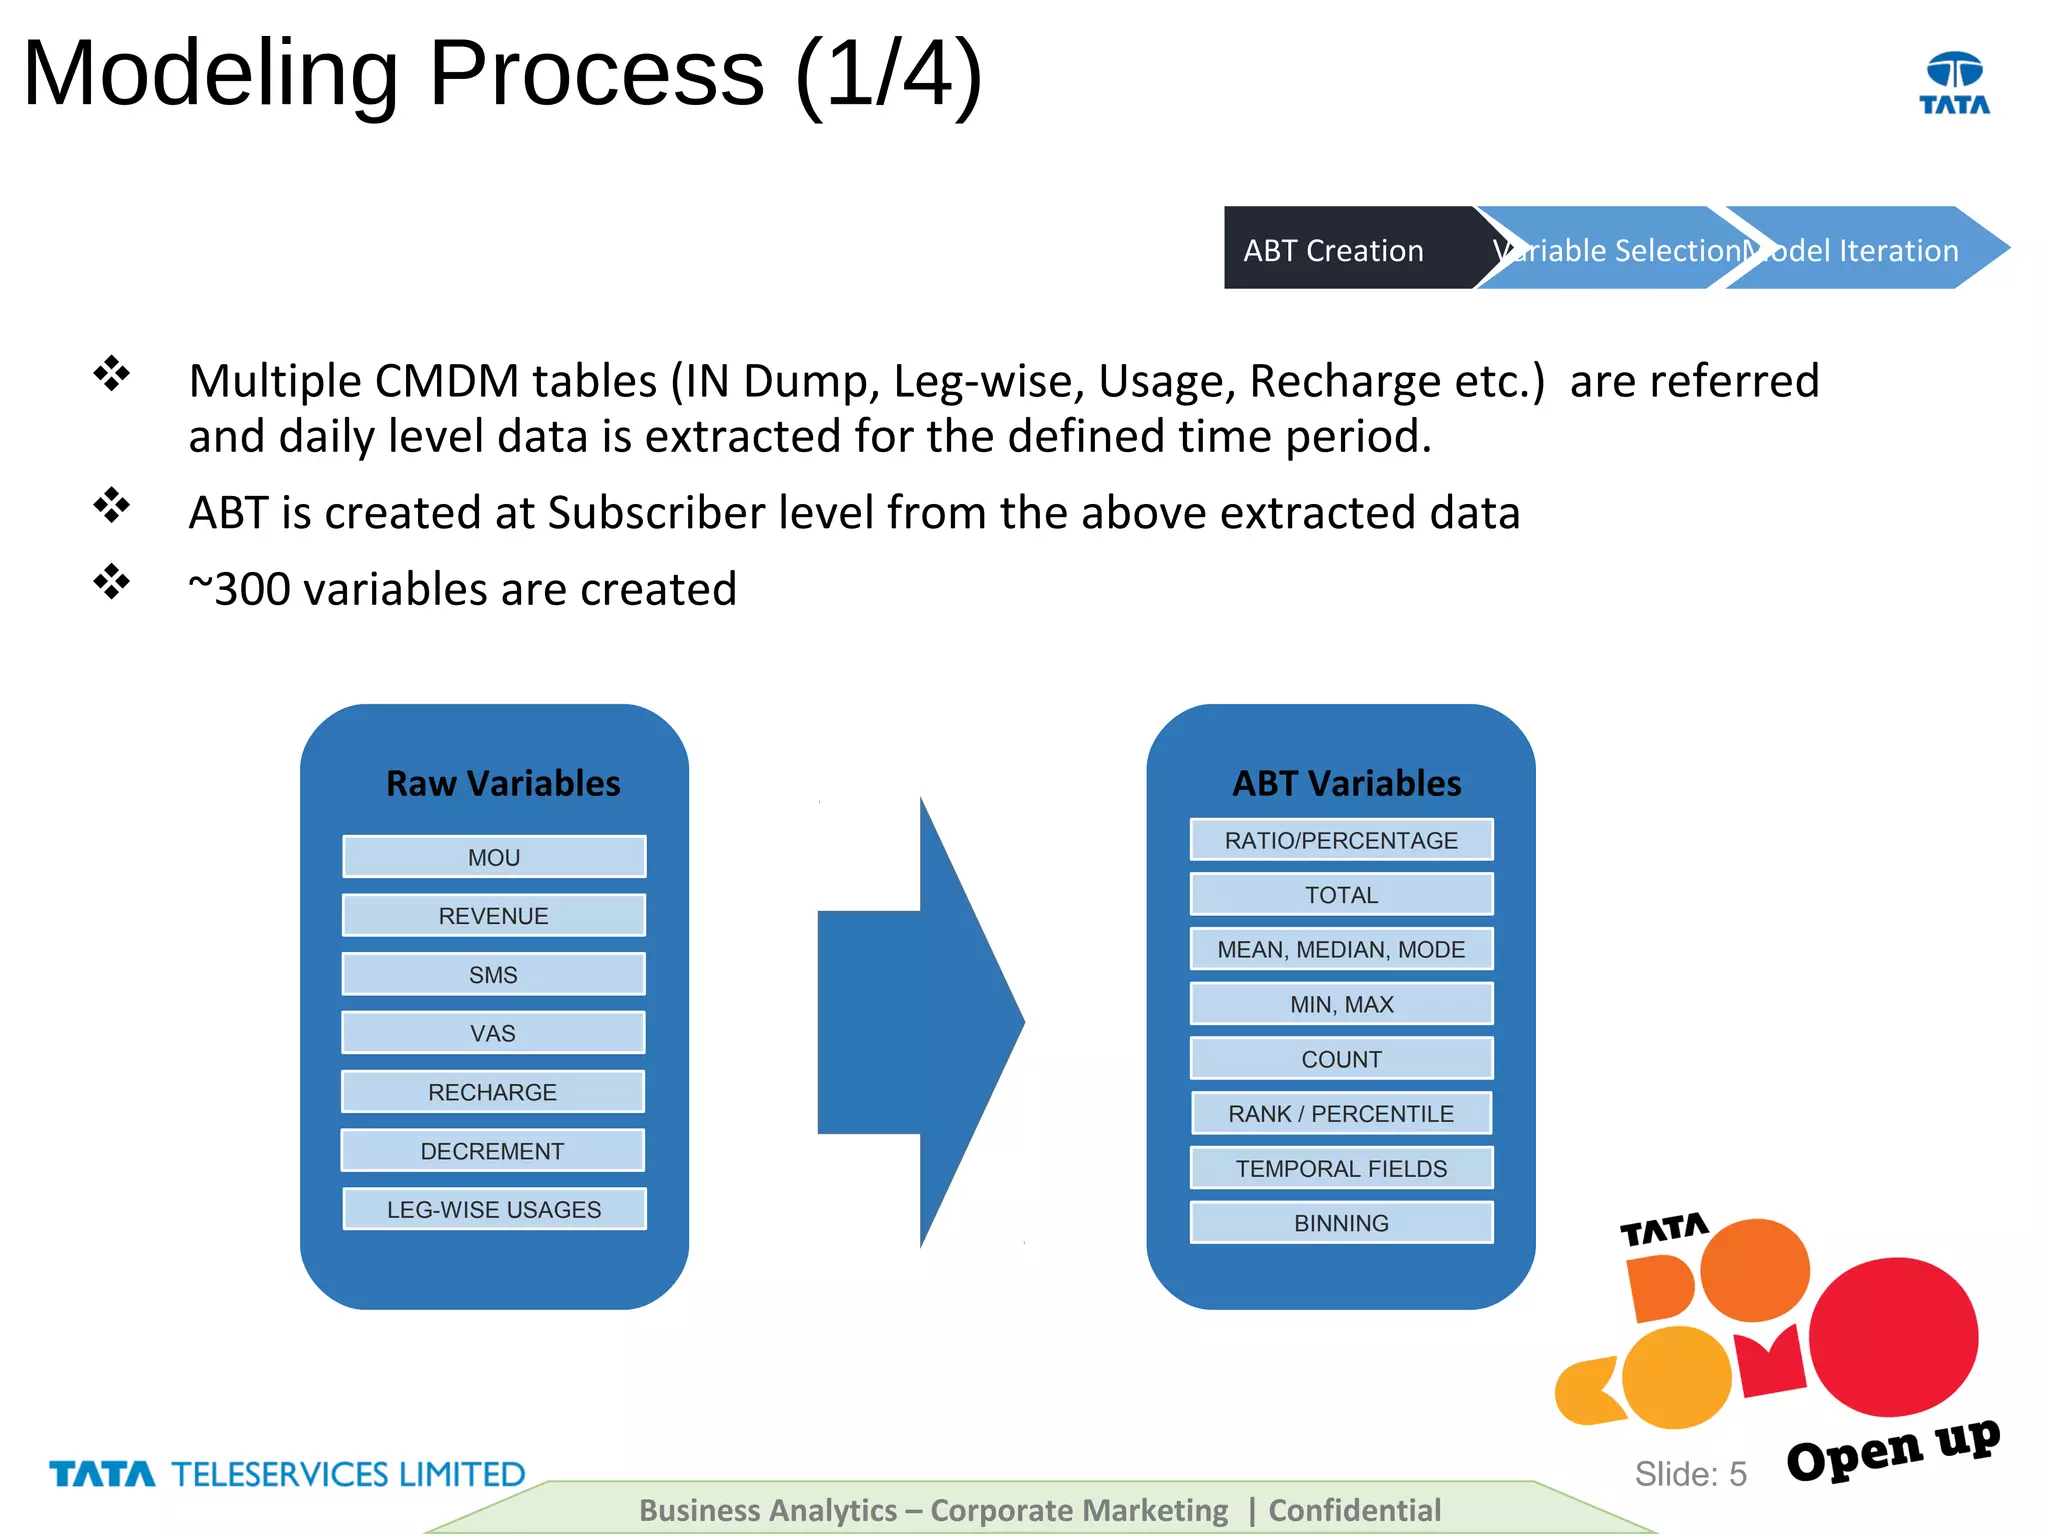
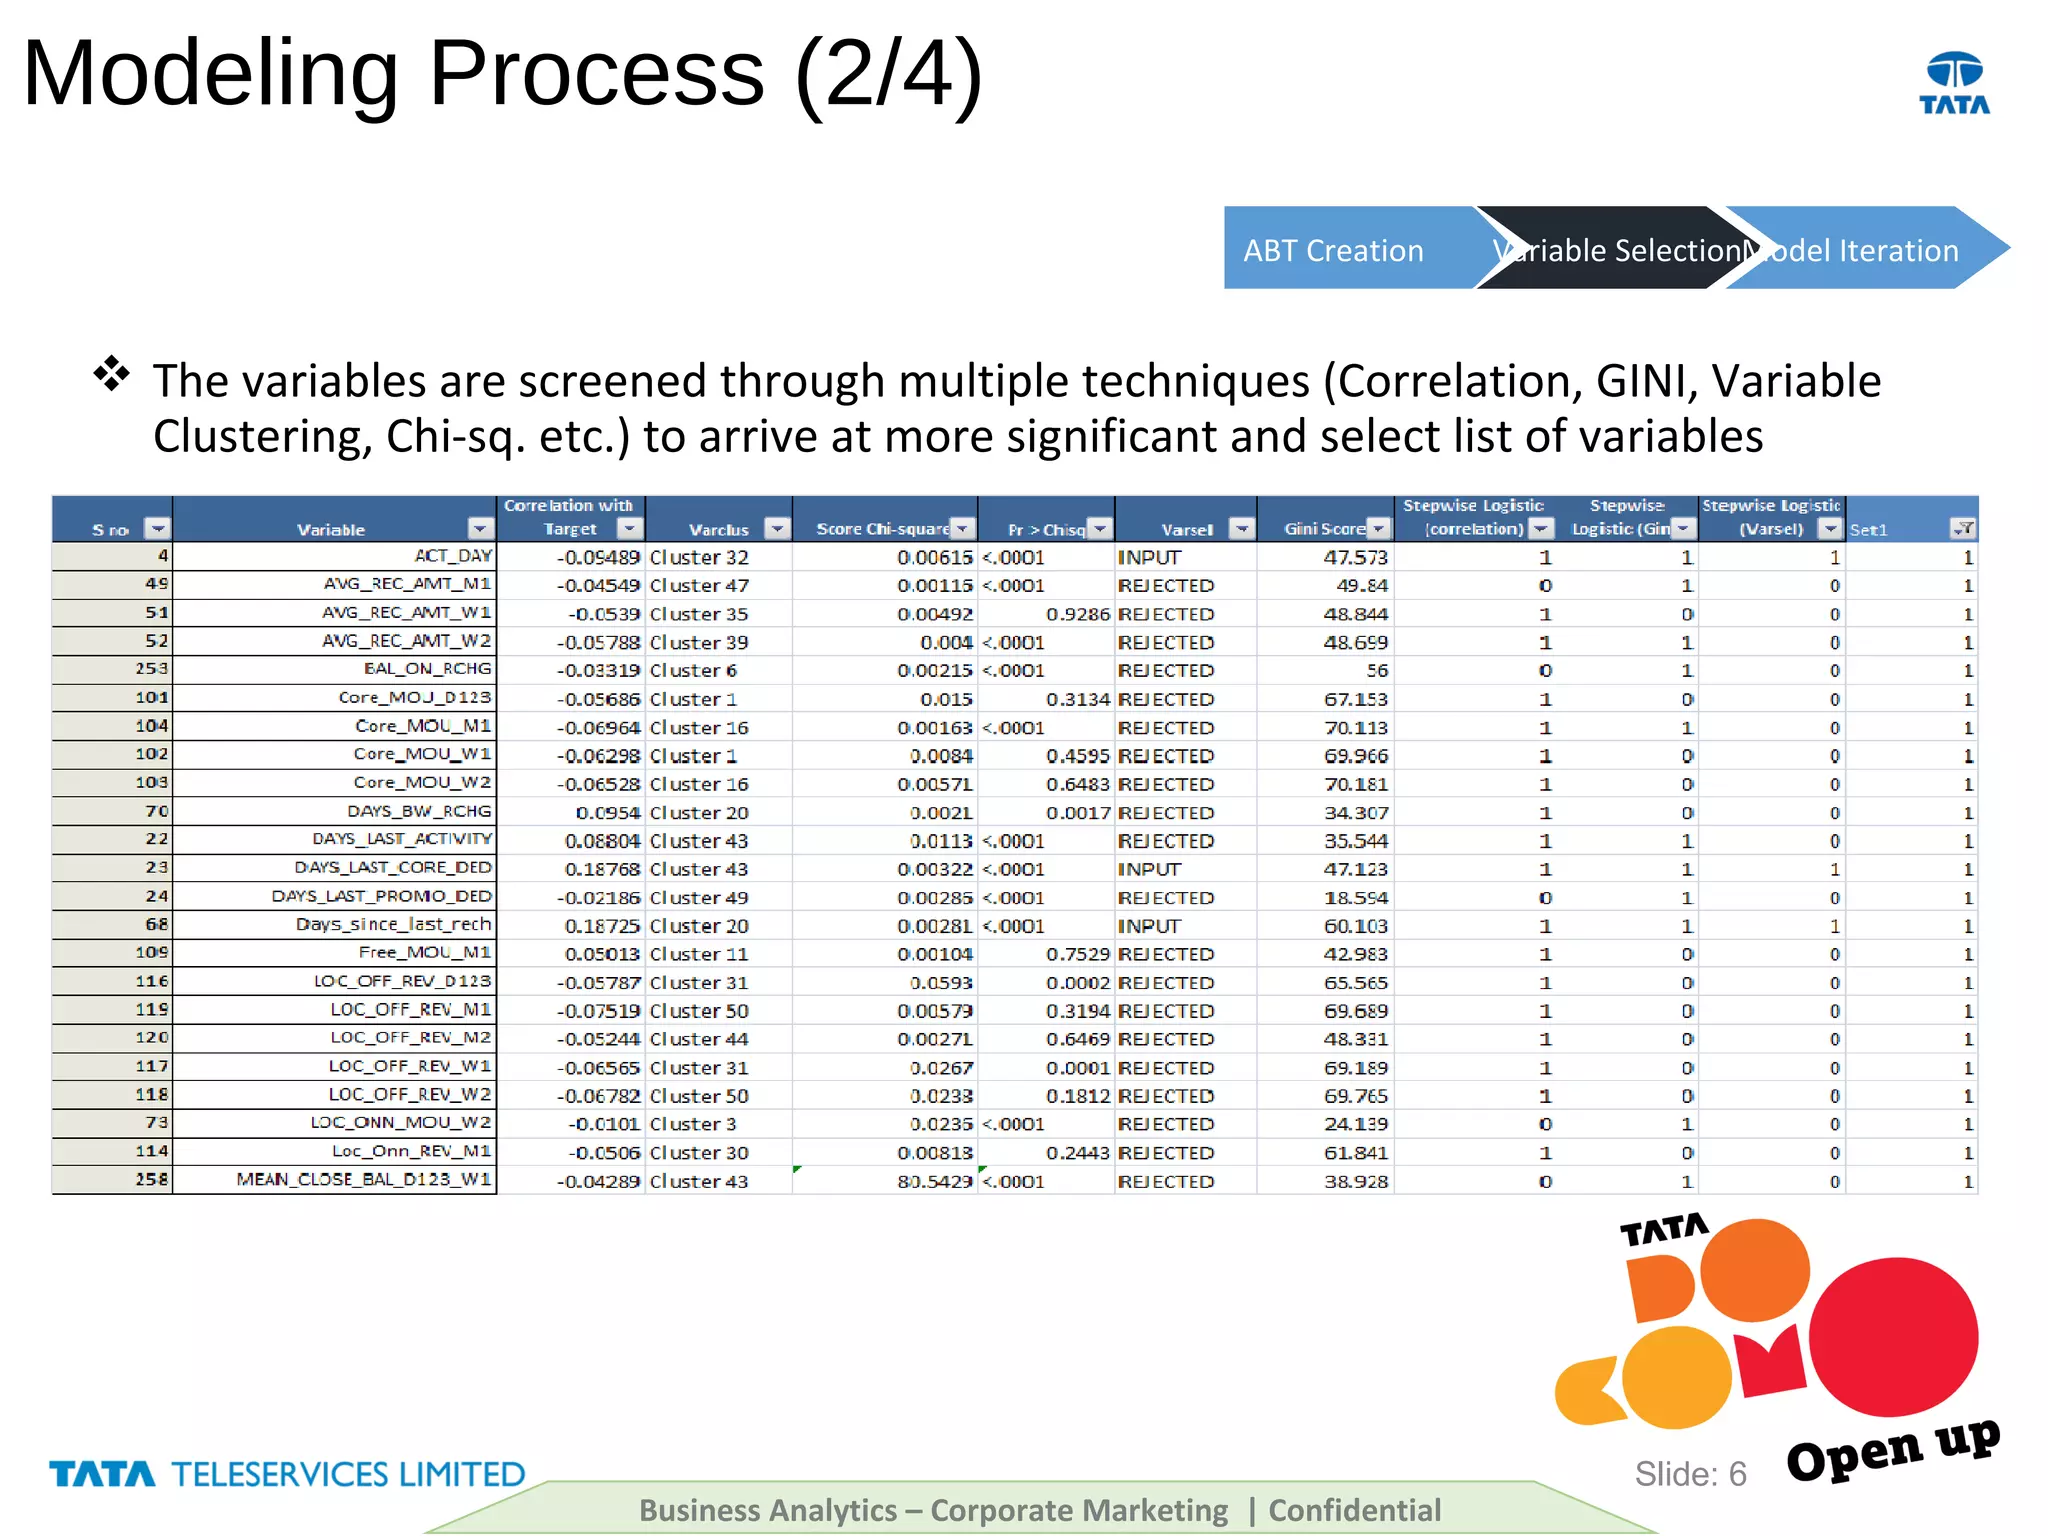
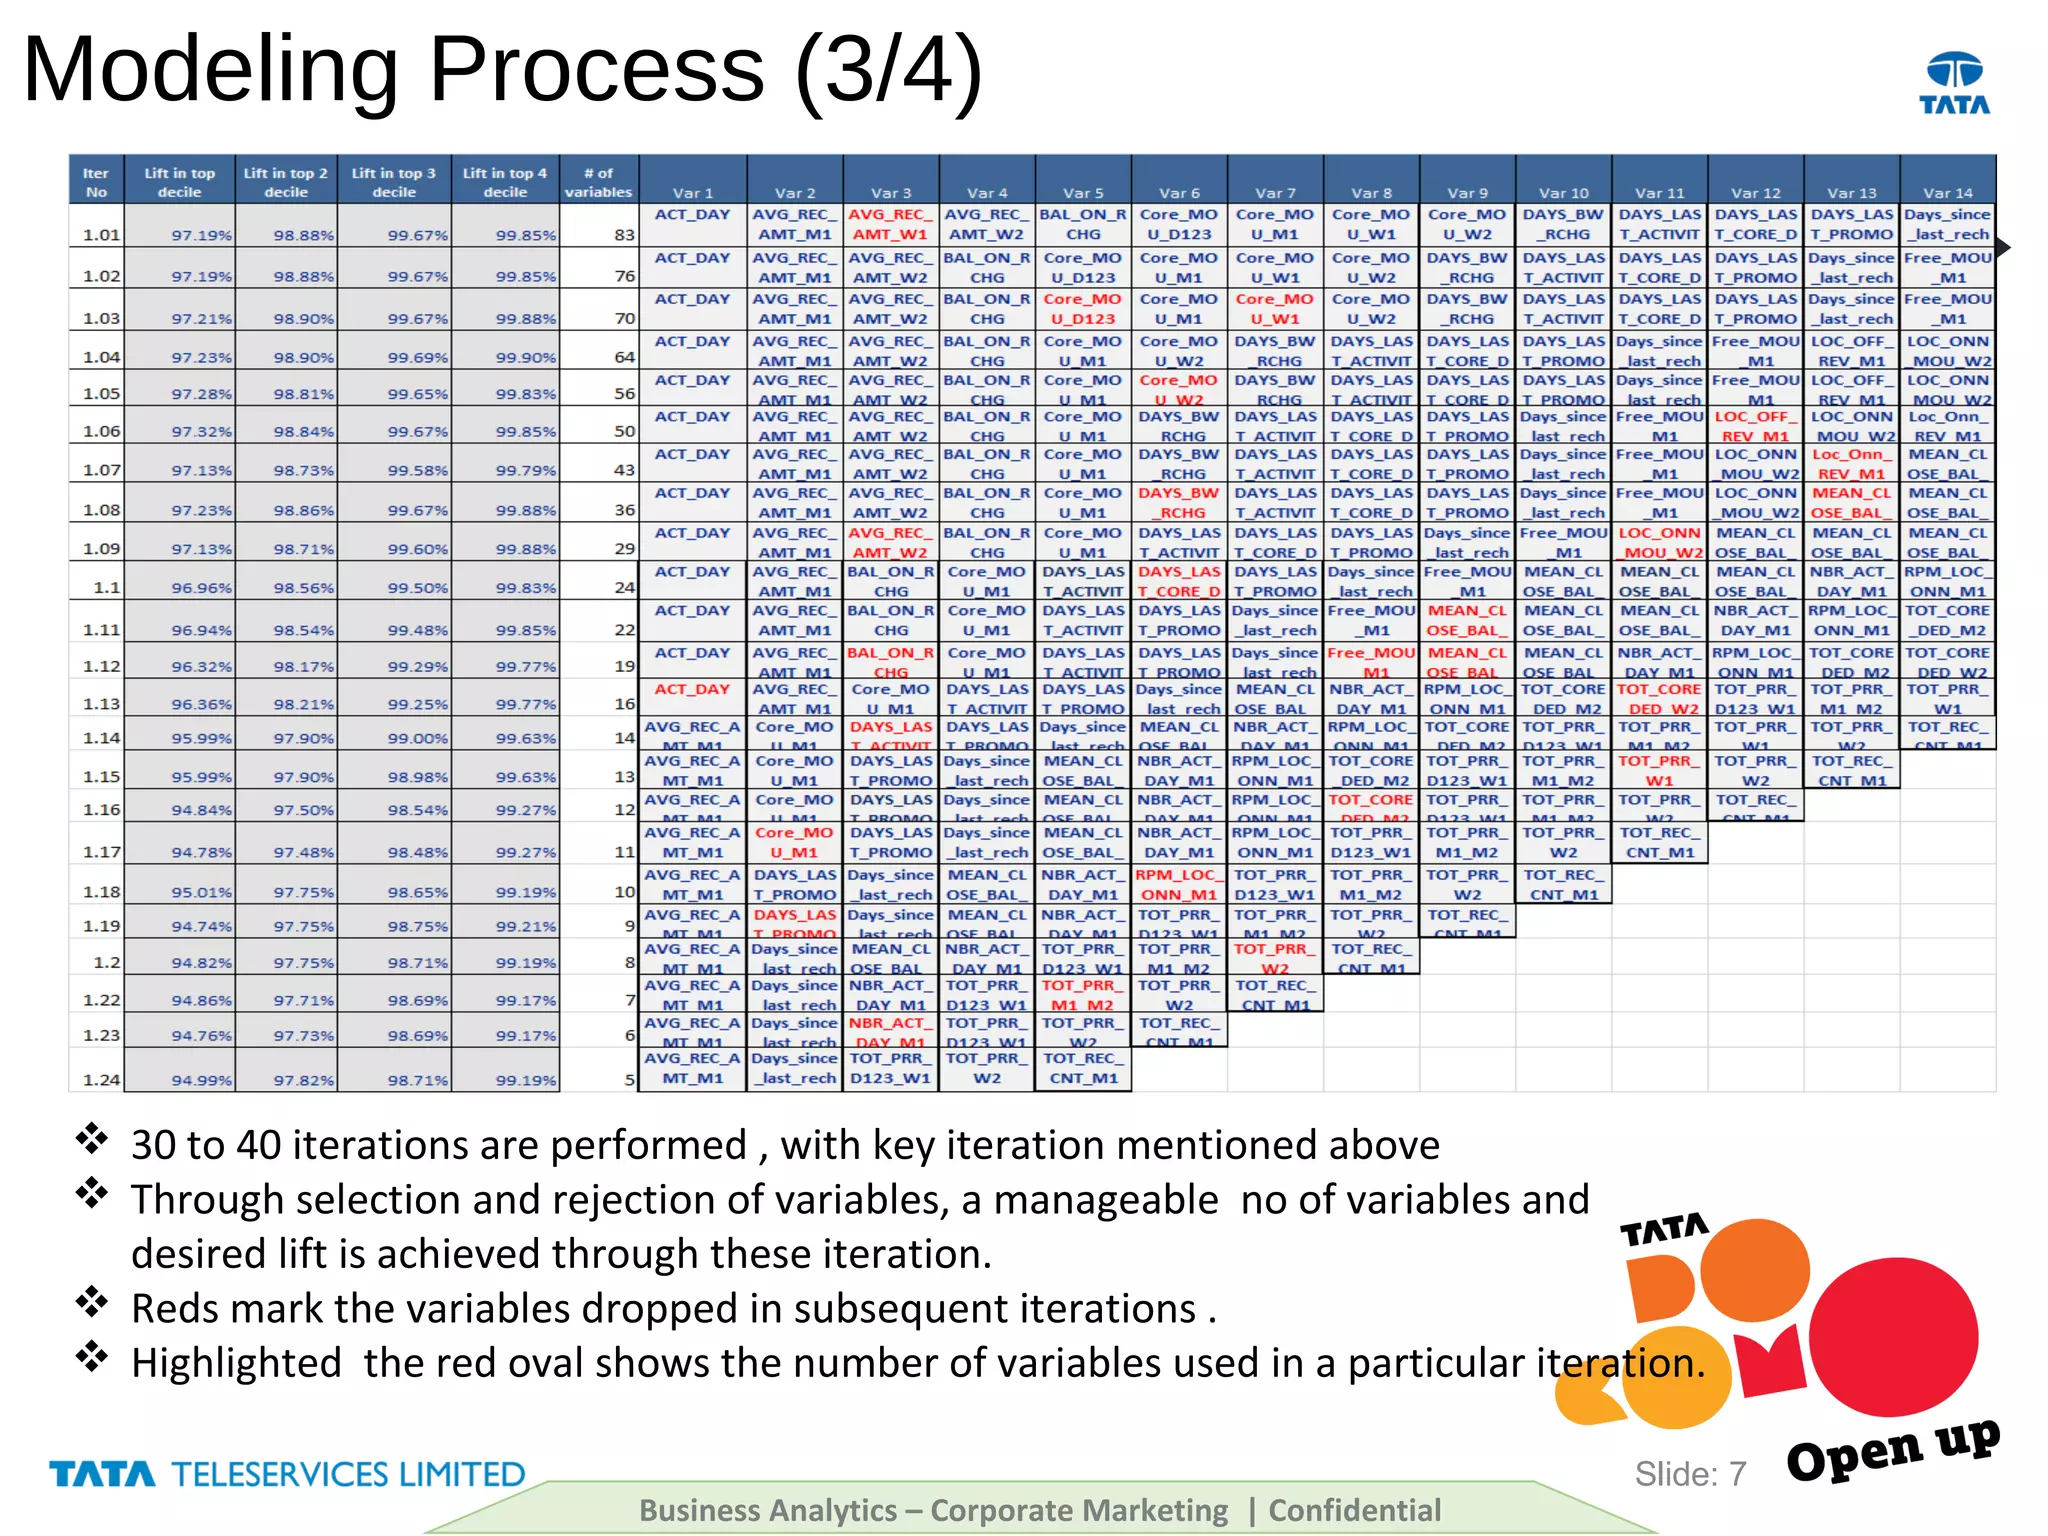
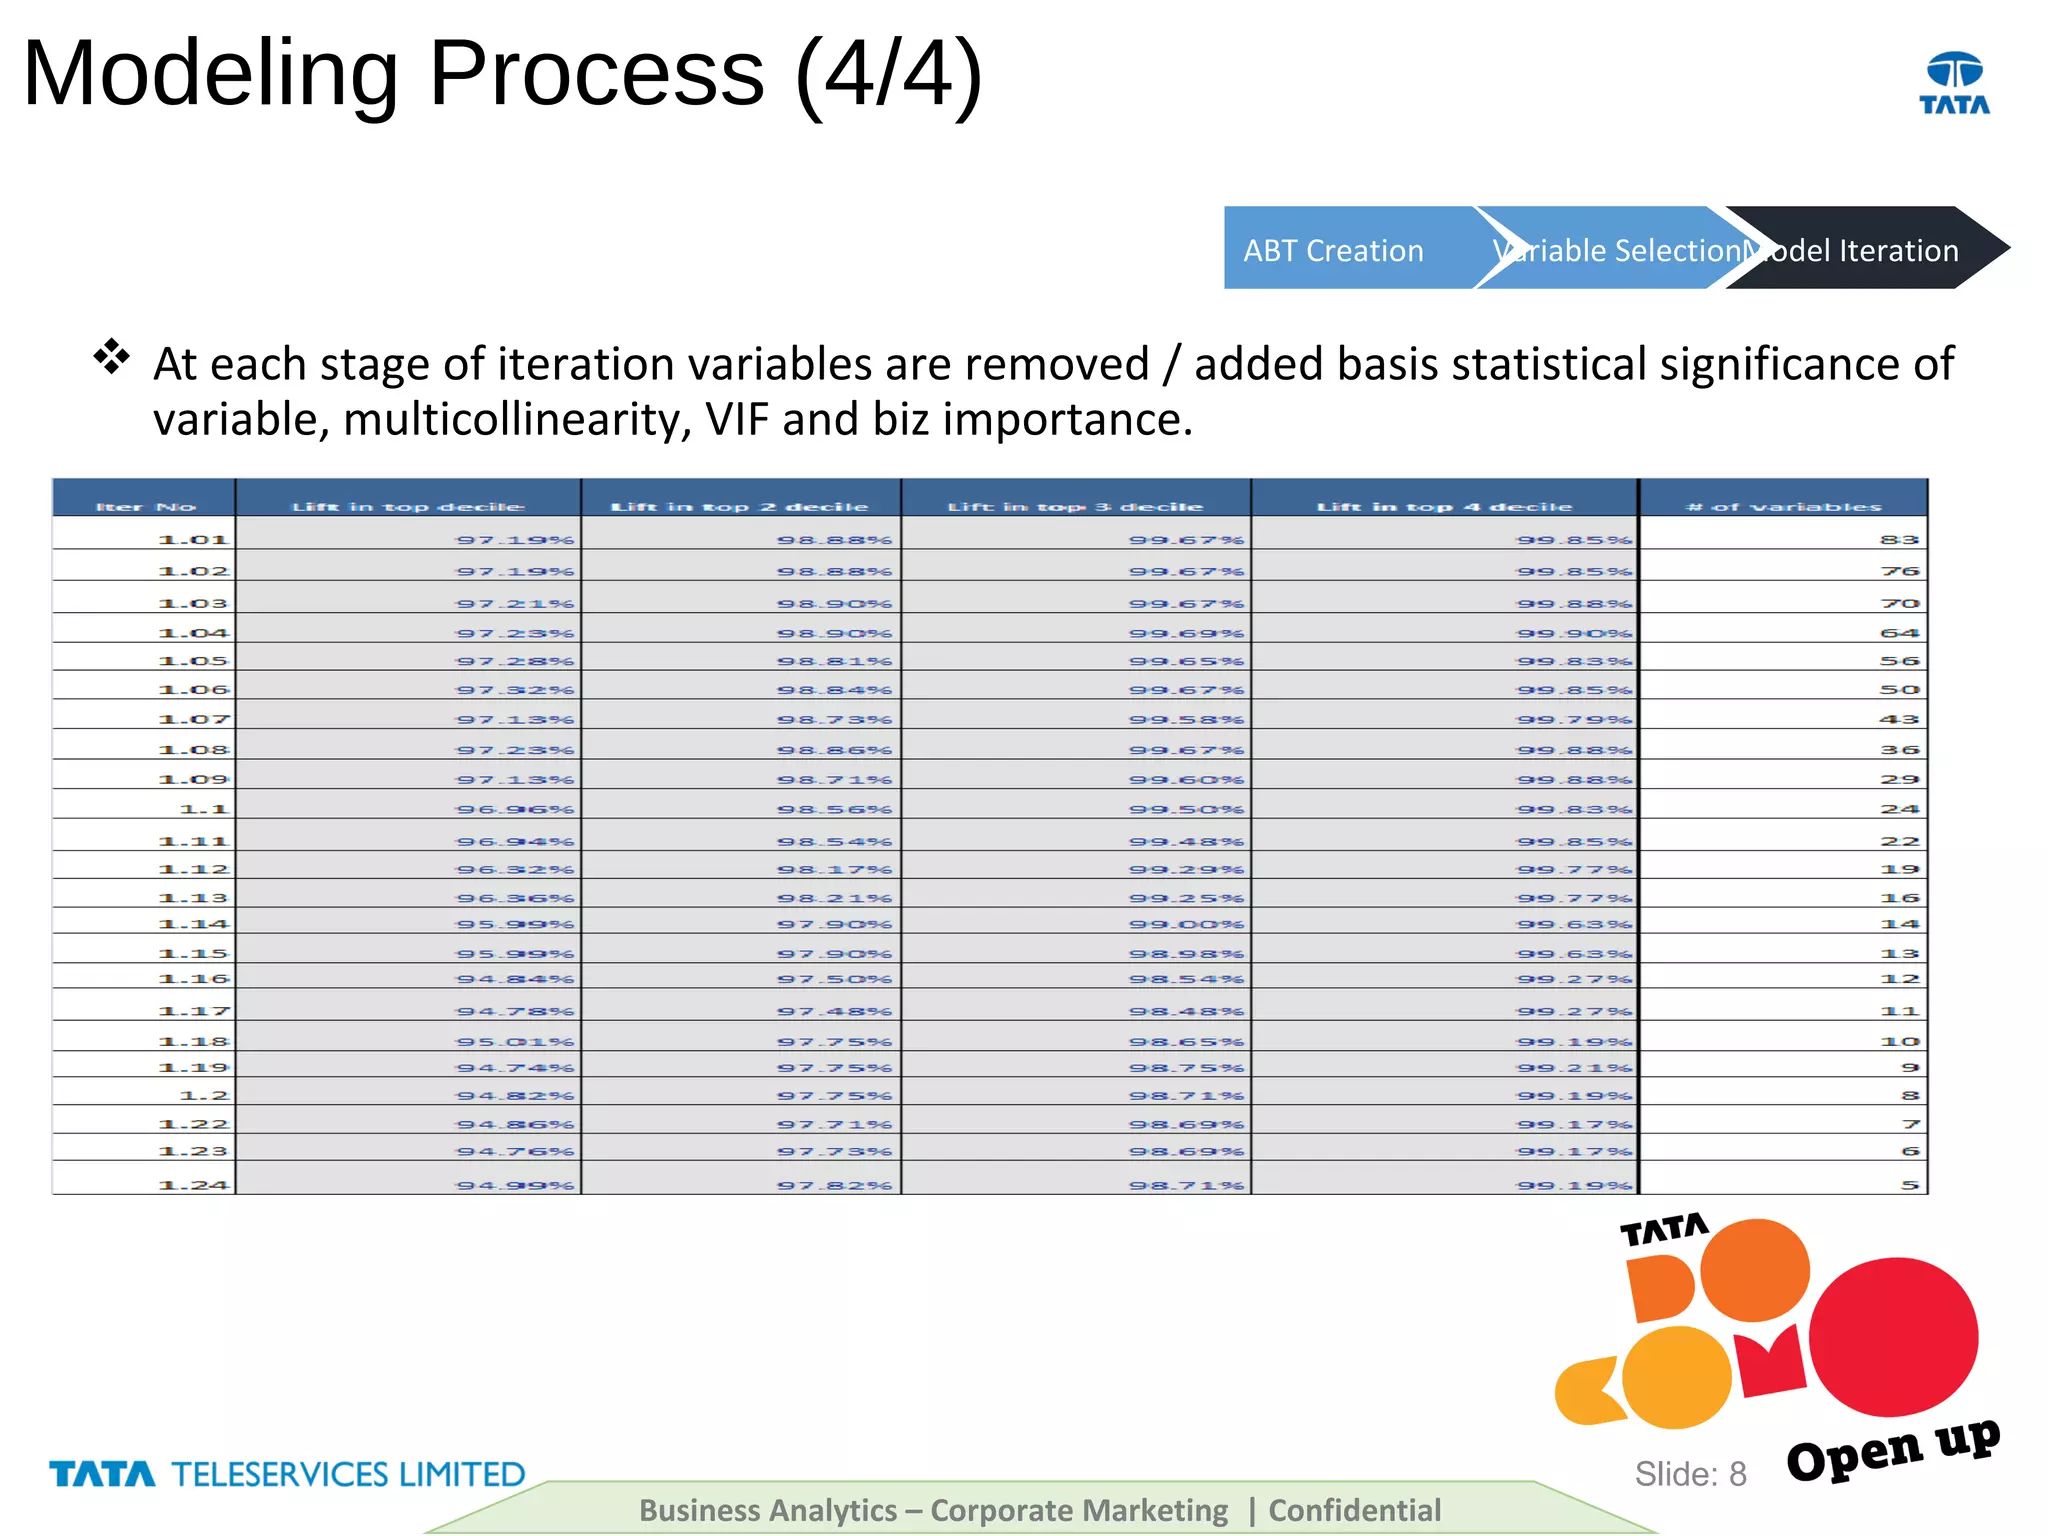
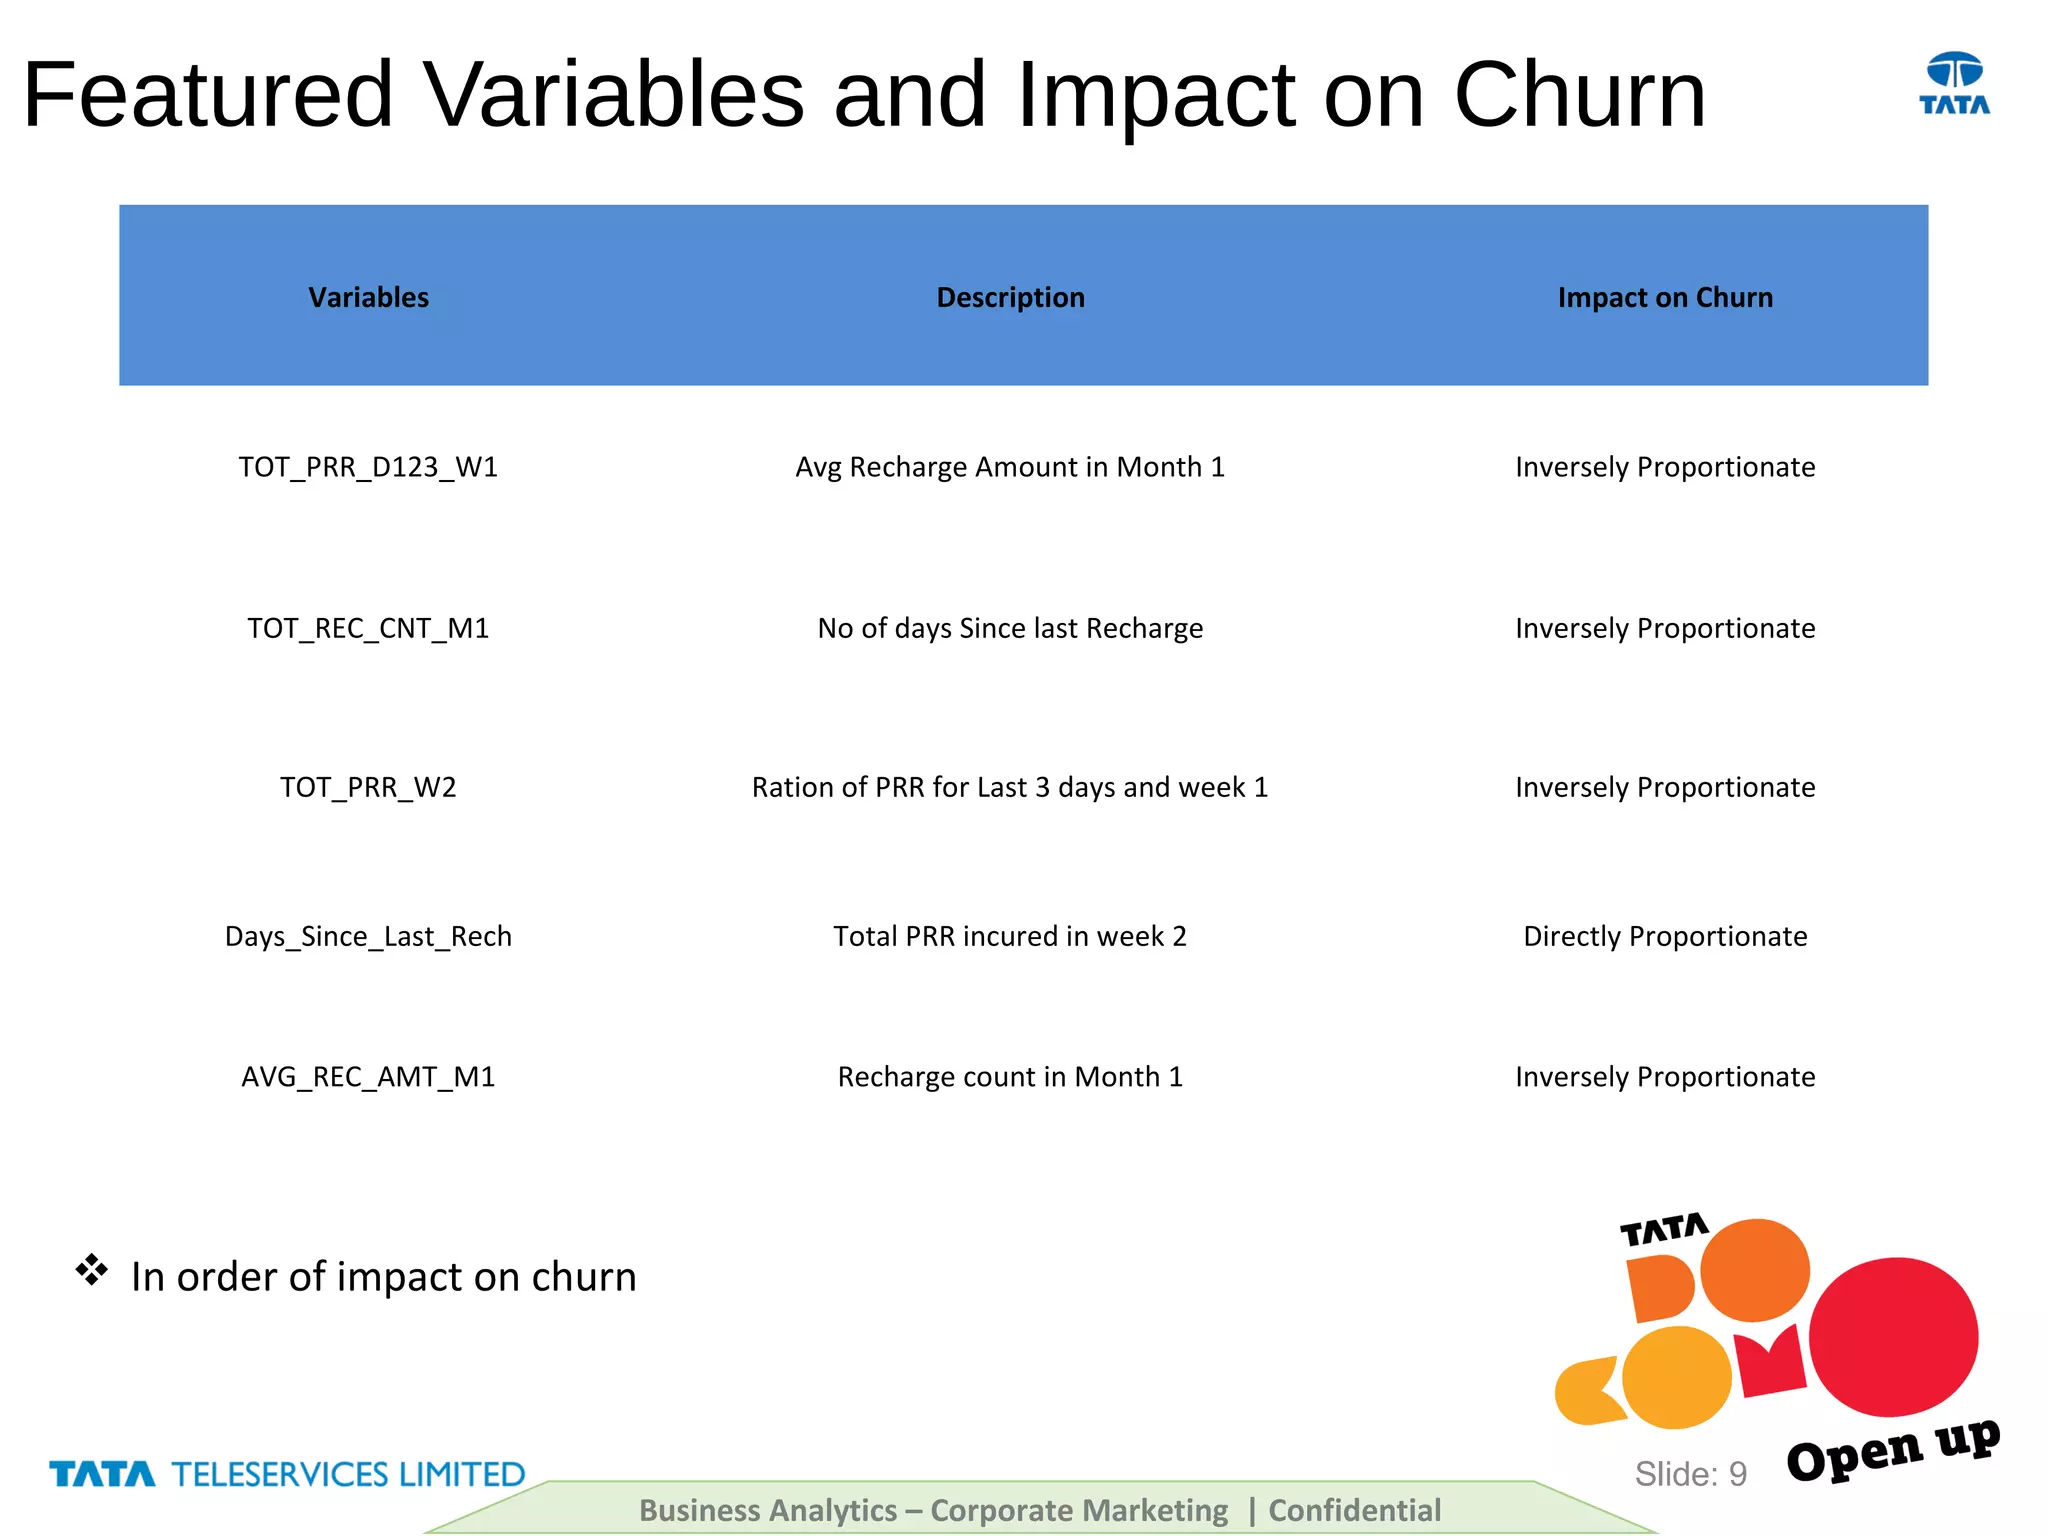
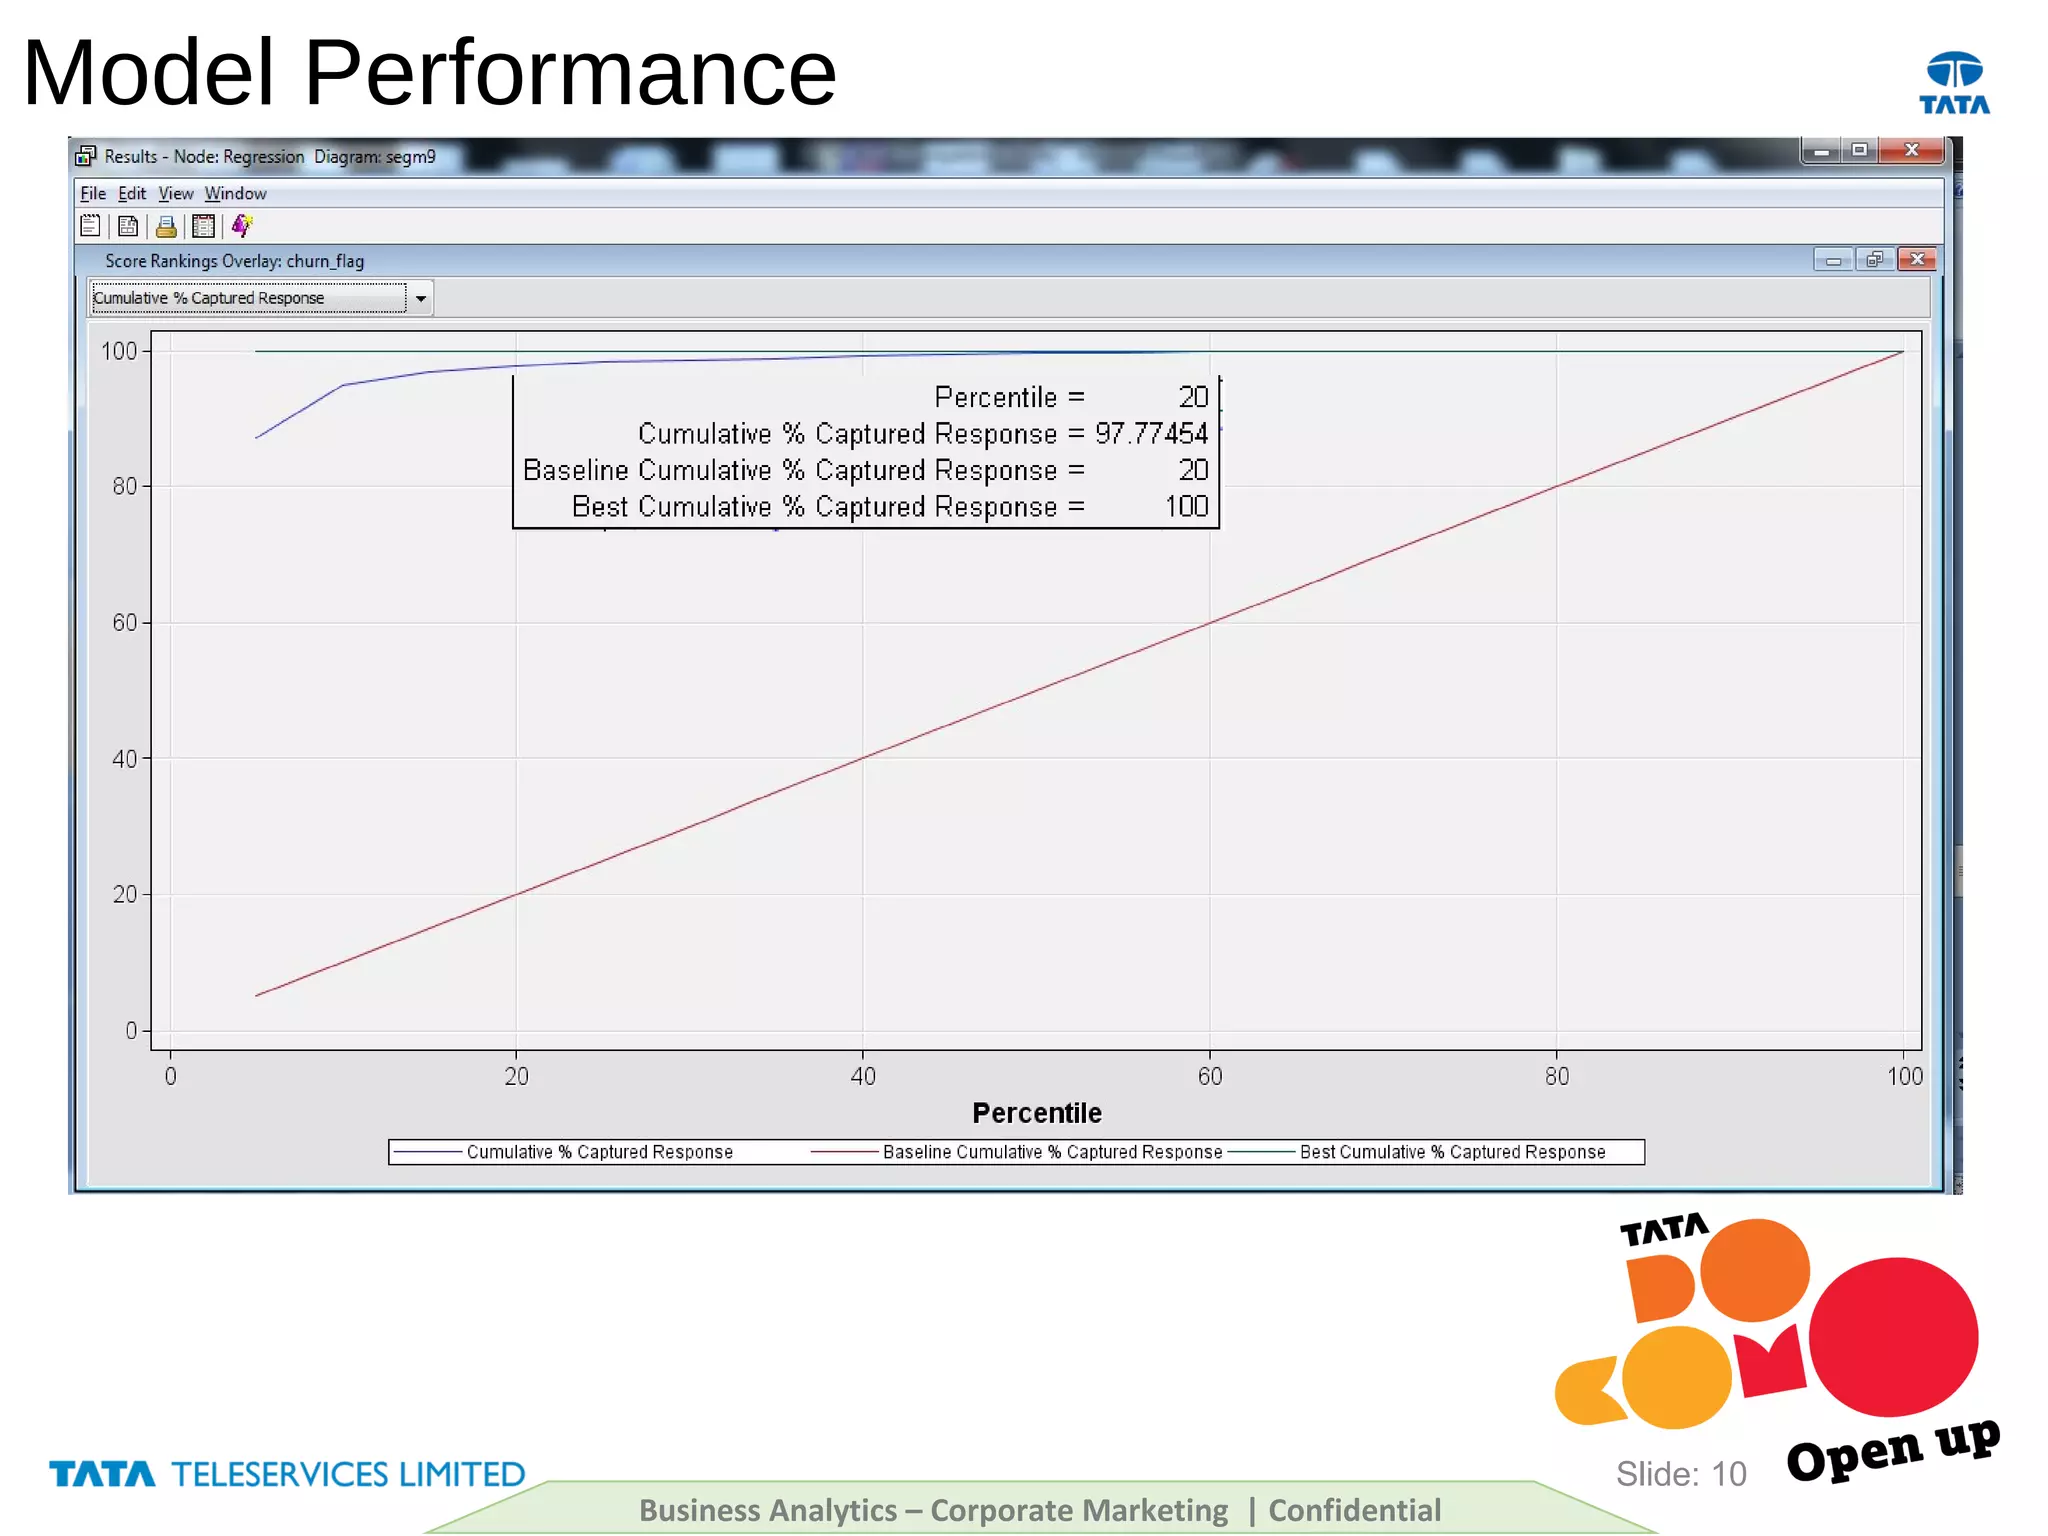
Predictive Churn ModelPredictive Churn Model
Segment 9Segment 9
20th
Nov ‘ 2014
Please Observe Safety procedures andPlease Observe Safety procedures and
take time to note location of nearesttake time to note location of nearest
Fire ExitsFire Exits
Slide: 3
Content
Definition, Objective and Scope
Modeling Process
 ABT Creation
 Variable Selection
 Model Iterations
Final Model – Select Variables
Model Performance
Business Analytics – Corporate Marketing | Confidential
Churn Definition, Objective & Scope
 Definition – A subscriber who moves from REC base to Non-REC base in a period of
one month (Performance period)
 Objective – To predict probability of moving from REC base to Non-REC base over
the next 1 month for each of the subscriber
 Scope –
REC base
Segment 9: “FEATURE PHONE + VOICE+DATA(1 Mb+) + Single S ”
AON >90 days
Slide: 4
# of Subscribers
Total Population
6,77,367
# of Churners 48,09
Churn Rate 1.%
Start Date End Date
M2 30-JULY-14 30-AUG-14
M1 31-AUG-14 30-SEP-14
Performance Period 01-OCT-14 30-OCT-14
Business Analytics – Corporate Marketing | Confidential
Modeling Process (1/4)
 Multiple CMDM tables (IN Dump, Leg-wise, Usage, Recharge etc.) are referred
and daily level data is extracted for the defined time period.
 ABT is created at Subscriber level from the above extracted data
 ~300 variables are created
Slide: 5
ABT Creation Variable SelectionModel Iteration
RATIO/PERCENTAGE
TOTAL
MIN, MAX
COUNT
RANK / PERCENTILE
TEMPORAL FIELDS
BINNING
MEAN, MEDIAN, MODE
ABT VariablesRaw Variables
MOU
REVENUE
SMS
VAS
RECHARGE
DECREMENT
LEG-WISE USAGES
Business Analytics – Corporate Marketing | Confidential
Modeling Process (2/4)
 The variables are screened through multiple techniques (Correlation, GINI, Variable
Clustering, Chi-sq. etc.) to arrive at more significant and select list of variables
Slide: 6
ABT Creation Variable SelectionModel Iteration
Business Analytics – Corporate Marketing | Confidential
Modeling Process (3/4)
Slide: 7
 30 to 40 iterations are performed , with key iteration mentioned above
 Through selection and rejection of variables, a manageable no of variables and
desired lift is achieved through these iteration.
 Reds mark the variables dropped in subsequent iterations .
 Highlighted the red oval shows the number of variables used in a particular iteration.
Business Analytics – Corporate Marketing | Confidential
ABT Creation Variable SelectionModel Iteration
Modeling Process (4/4)
 At each stage of iteration variables are removed / added basis statistical significance of
variable, multicollinearity, VIF and biz importance.
Slide: 8
ABT Creation Variable SelectionModel Iteration
Business Analytics – Corporate Marketing | Confidential
Featured Variables and Impact on Churn
Slide: 9
Business Analytics – Corporate Marketing | Confidential
 In order of impact on churn
Variables Description Impact on Churn
TOT_PRR_D123_W1 Avg Recharge Amount in Month 1 Inversely Proportionate
TOT_REC_CNT_M1 No of days Since last Recharge Inversely Proportionate
TOT_PRR_W2 Ration of PRR for Last 3 days and week 1 Inversely Proportionate
Days_Since_Last_Rech Total PRR incured in week 2 Directly Proportionate
AVG_REC_AMT_M1 Recharge count in Month 1 Inversely Proportionate
Model Performance
Slide: 10
Business Analytics – Corporate Marketing | Confidential
Thank you
Business Analytics – Corporate Marketing |Business Analytics – Corporate Marketing | ConfidentialConfidential
For any query or concerns please contact: Ankur Shrivastava – ankur.shrivastava@tatatel.co.in or call +91-8655007666
List of Abbreviations frequently used
Business Analytics – Corporate Marketing | Confidential
Chi-square :A statistical test used for comparison of goodness of fit. In other words, the difference between observed and expected outcome
Clustering :A group of elements shows similar characteristics put together giving a certain statistical inference
Co-relation :A mutual linear relationship between any two elements without infer to causal impact.
GINI Ordering/Index A statistical measurement of dispersion or inequality of population
GVC : Good value customer segment
HVC : High value customer segment
LVC : Low value customer segment
Multicolinearity/VIF : A statistical event to measure the multiple relationship of predictor/independent variables and target variable
PCM: Predictive Churn model
Segment -1: SmartPhone - V+D (300MB+)-S
Segment -10: Data Phone - V+D (1MB+)-M
Segment -11: Data Phone - V/D only-S
Segment -12: Data Phone - V/D only-M
Segment -13: Basic - V/D only-S
Segment -14: Basic - V/D only-M
Segment -2: SmartPhone - V+D (300MB+)-M
Segment -3: SmartPhone - V+D (1MB+)-S
Segment -4: SmartPhone - V+D (1MB+)-M
Segment -5: SmartPhone - V/D only-S
Segment -6: SmartPhone - V/D only-M
Segment -7: Data Phone - V+D (300MB+)-S
Segment -8: Data Phone - V+D (300MB+)-M
Segment -9: Data Phone - V+D (1MB+)-S
uHVC – Ultra high value customer segment
uLVC – ultra low value customer segment

Churn model for telecom

  • 1.
    Predictive Churn ModelPredictiveChurn Model Segment 9Segment 9 20th Nov ‘ 2014
  • 2.
    Please Observe Safetyprocedures andPlease Observe Safety procedures and take time to note location of nearesttake time to note location of nearest Fire ExitsFire Exits
  • 3.
    Slide: 3 Content Definition, Objectiveand Scope Modeling Process  ABT Creation  Variable Selection  Model Iterations Final Model – Select Variables Model Performance Business Analytics – Corporate Marketing | Confidential
  • 4.
    Churn Definition, Objective& Scope  Definition – A subscriber who moves from REC base to Non-REC base in a period of one month (Performance period)  Objective – To predict probability of moving from REC base to Non-REC base over the next 1 month for each of the subscriber  Scope – REC base Segment 9: “FEATURE PHONE + VOICE+DATA(1 Mb+) + Single S ” AON >90 days Slide: 4 # of Subscribers Total Population 6,77,367 # of Churners 48,09 Churn Rate 1.% Start Date End Date M2 30-JULY-14 30-AUG-14 M1 31-AUG-14 30-SEP-14 Performance Period 01-OCT-14 30-OCT-14 Business Analytics – Corporate Marketing | Confidential
  • 5.
    Modeling Process (1/4) Multiple CMDM tables (IN Dump, Leg-wise, Usage, Recharge etc.) are referred and daily level data is extracted for the defined time period.  ABT is created at Subscriber level from the above extracted data  ~300 variables are created Slide: 5 ABT Creation Variable SelectionModel Iteration RATIO/PERCENTAGE TOTAL MIN, MAX COUNT RANK / PERCENTILE TEMPORAL FIELDS BINNING MEAN, MEDIAN, MODE ABT VariablesRaw Variables MOU REVENUE SMS VAS RECHARGE DECREMENT LEG-WISE USAGES Business Analytics – Corporate Marketing | Confidential
  • 6.
    Modeling Process (2/4) The variables are screened through multiple techniques (Correlation, GINI, Variable Clustering, Chi-sq. etc.) to arrive at more significant and select list of variables Slide: 6 ABT Creation Variable SelectionModel Iteration Business Analytics – Corporate Marketing | Confidential
  • 7.
    Modeling Process (3/4) Slide:7  30 to 40 iterations are performed , with key iteration mentioned above  Through selection and rejection of variables, a manageable no of variables and desired lift is achieved through these iteration.  Reds mark the variables dropped in subsequent iterations .  Highlighted the red oval shows the number of variables used in a particular iteration. Business Analytics – Corporate Marketing | Confidential ABT Creation Variable SelectionModel Iteration
  • 8.
    Modeling Process (4/4) At each stage of iteration variables are removed / added basis statistical significance of variable, multicollinearity, VIF and biz importance. Slide: 8 ABT Creation Variable SelectionModel Iteration Business Analytics – Corporate Marketing | Confidential
  • 9.
    Featured Variables andImpact on Churn Slide: 9 Business Analytics – Corporate Marketing | Confidential  In order of impact on churn Variables Description Impact on Churn TOT_PRR_D123_W1 Avg Recharge Amount in Month 1 Inversely Proportionate TOT_REC_CNT_M1 No of days Since last Recharge Inversely Proportionate TOT_PRR_W2 Ration of PRR for Last 3 days and week 1 Inversely Proportionate Days_Since_Last_Rech Total PRR incured in week 2 Directly Proportionate AVG_REC_AMT_M1 Recharge count in Month 1 Inversely Proportionate
  • 10.
    Model Performance Slide: 10 BusinessAnalytics – Corporate Marketing | Confidential
  • 11.
    Thank you Business Analytics– Corporate Marketing |Business Analytics – Corporate Marketing | ConfidentialConfidential For any query or concerns please contact: Ankur Shrivastava – ankur.shrivastava@tatatel.co.in or call +91-8655007666
  • 12.
    List of Abbreviationsfrequently used Business Analytics – Corporate Marketing | Confidential Chi-square :A statistical test used for comparison of goodness of fit. In other words, the difference between observed and expected outcome Clustering :A group of elements shows similar characteristics put together giving a certain statistical inference Co-relation :A mutual linear relationship between any two elements without infer to causal impact. GINI Ordering/Index A statistical measurement of dispersion or inequality of population GVC : Good value customer segment HVC : High value customer segment LVC : Low value customer segment Multicolinearity/VIF : A statistical event to measure the multiple relationship of predictor/independent variables and target variable PCM: Predictive Churn model Segment -1: SmartPhone - V+D (300MB+)-S Segment -10: Data Phone - V+D (1MB+)-M Segment -11: Data Phone - V/D only-S Segment -12: Data Phone - V/D only-M Segment -13: Basic - V/D only-S Segment -14: Basic - V/D only-M Segment -2: SmartPhone - V+D (300MB+)-M Segment -3: SmartPhone - V+D (1MB+)-S Segment -4: SmartPhone - V+D (1MB+)-M Segment -5: SmartPhone - V/D only-S Segment -6: SmartPhone - V/D only-M Segment -7: Data Phone - V+D (300MB+)-S Segment -8: Data Phone - V+D (300MB+)-M Segment -9: Data Phone - V+D (1MB+)-S uHVC – Ultra high value customer segment uLVC – ultra low value customer segment