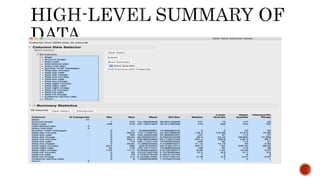
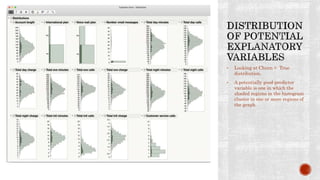
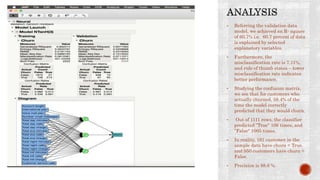
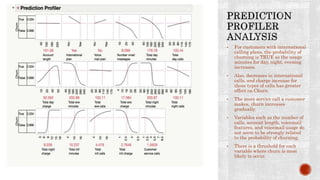
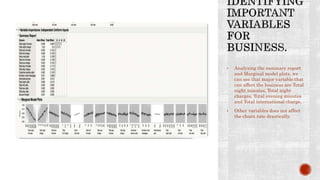
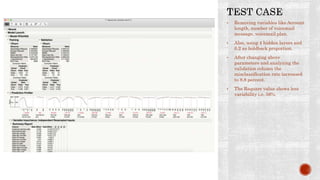
Prepared by: Guided by:
Rohan Choksi Prof. Stephan Kudyba
Mohit Surana
Sagar Sharma
Saurabh Gangar
 Customer retention is a challenge in the ultracompetitive mobile phone industry.
A mobile phone company is studying factors related to customer churn, a term
used for customers who have moved to another service provider.
 The company would like to build a model to predict which customers are most
likely to move their service to a competitor. This knowledge will be used to identify
customers for targeted interventions, with the ultimate goal of reducing churn.
Source - https://bigml.com/dashboard/dataset/58ec1a610144045d39000eac
 The sample data set is of telecom industry consists of 3,332 customer records. The
target variable of interest is the column called Churn, which takes two values:
 True: The customer has moved to another service provider.
 False: The customer still uses “our” service.
 Attributes of churn dataset (some of the variables are self explanatory)
 State
 Account length – Number of months customer was subscribed.
 Area Code
 International Plan – Customer having international plan enrolled. If YES – enrolled,
NO- not enrolled.
 Voicemail Plan - If YES – enrolled, NO- not enrolled.
 All the attributes described below are “Numerical Variables ”
 Number of voicemail messages
 Total day minutes
 Total day calls
 Total day charge
 Total evening minutes
 Total evening calls
 Total evening charge
 Total night minutes
 Total night calls
 Total night charge
 Total international minutes
 Total international calls
 Total international charge
 Customer service calls
 As we see from high-level summary, there are 3 categorical variable.
 State – 51 categories
 International Plan – 2 categories
 Voicemail Plan – 2 categories
 There are no missing values in the data, if any variable is missing values, we’d see
a column ‘N Missing’ under Summary Statistics.
 Our response variable, Churn, is a two-level categorical variable. In figure, we see
that 14.5 percent of the data is for those who have “churned.”
• Looking at Churn = True
distribution.
• A potentially good predictor
variable is one in which the
shaded regions in the histogram
cluster in one or more regions of
the graph.
 The final goal of the model is to predict whether the customer is likely to churn or
not.
 We are using Neural Network Model to mine the data.
 Before selecting mining method we ran data through regression and classification
and found that Neural networks will help in better mining and understanding the
data.
 After exploring our variables and gaining an understanding of potential
relationships we fit a neural network. We omit the variable State and Area and
focus on predictors related to call and plan information.
 We use the default model that has a single hidden layer with three nodes.
 We also use the default Holdback Validation Method, one-third of random data for
model validation.
• Referring the validation data
model, we achieved an R- square
of 60.7% i.e. 60.7 percent of data
is explained by selected
explanatory variables.
• Furthermore, the
misclassification rate is 7.11%,
and rule of thumb states – lower
misclassification rate indicates
better performance.
• Studying the confusion matrix,
we see that for customers who
actually churned, 58.4% of the
time the model correctly
predicted that they would churn.
• Out of 1111 rows, the classifier
predicted ”True" 106 times, and
”False" 1005 times.
• In reality, 161 customer in the
sample data have churn = True,
and 950 customers have churn =
False.
• Precision is 88.6 %.
• For customers with international
calling plans, the probability of
churning is TRUE as the usage
minutes for day, night, evening
increases.
• Also, decreases in international
calls, and charge increase for
those types of calls has greater
effect on Churn.
• The more service call a customer
makes, churn increases
gradually.
• Variables such as the number of
calls, account length, voicemail
features, and voicemail usage do
not seem to be strongly related
to the probability of churning.
• There is a threshold for each
variable where churn is most
likely to occur.
• Analyzing the summary report
and Marginal model plots, we
can see that major variable that
can affect the business are Total
night minutes, Total night
charges, Total evening minutes
and Total international charge.
• Other variables does not affect
the churn rate drastically.
• Removing variables like Account
length, number of voicemail
message, voicemail plan.
• Also, using 4 hidden layers and
0.2 as holdback proportion.
• After changing above
parameters and analyzing the
validation column the
misclassification rate increased
to 8.8 percent.
• The Rsquare value shows less
variability i.e. 56%.
Examining the data we came to know which factors were responsible for Churn of
customers.
 Increase in usage of day, evening and night minutes has high likelihood of Churn.
 Categorical profiler shows that International plan has the major impact on the
churn rate.
 Telecom company should focus on creating contracts or monthly plan with good
offers on International calling.
 Another major factor for Churn is more customer service calls, which clearly
depicts that company may be facing some infrastructure or technical issue in
certain areas.
Data mining and analysis of customer churn dataset

Data mining and analysis of customer churn dataset

  • 1.
    Prepared by: Guidedby: Rohan Choksi Prof. Stephan Kudyba Mohit Surana Sagar Sharma Saurabh Gangar
  • 2.
     Customer retentionis a challenge in the ultracompetitive mobile phone industry. A mobile phone company is studying factors related to customer churn, a term used for customers who have moved to another service provider.  The company would like to build a model to predict which customers are most likely to move their service to a competitor. This knowledge will be used to identify customers for targeted interventions, with the ultimate goal of reducing churn.
  • 3.
  • 4.
     The sampledata set is of telecom industry consists of 3,332 customer records. The target variable of interest is the column called Churn, which takes two values:  True: The customer has moved to another service provider.  False: The customer still uses “our” service.  Attributes of churn dataset (some of the variables are self explanatory)  State  Account length – Number of months customer was subscribed.  Area Code  International Plan – Customer having international plan enrolled. If YES – enrolled, NO- not enrolled.  Voicemail Plan - If YES – enrolled, NO- not enrolled.  All the attributes described below are “Numerical Variables ”  Number of voicemail messages  Total day minutes
  • 5.
     Total daycalls  Total day charge  Total evening minutes  Total evening calls  Total evening charge  Total night minutes  Total night calls  Total night charge  Total international minutes  Total international calls  Total international charge  Customer service calls
  • 7.
     As wesee from high-level summary, there are 3 categorical variable.  State – 51 categories  International Plan – 2 categories  Voicemail Plan – 2 categories  There are no missing values in the data, if any variable is missing values, we’d see a column ‘N Missing’ under Summary Statistics.  Our response variable, Churn, is a two-level categorical variable. In figure, we see that 14.5 percent of the data is for those who have “churned.”
  • 8.
    • Looking atChurn = True distribution. • A potentially good predictor variable is one in which the shaded regions in the histogram cluster in one or more regions of the graph.
  • 9.
     The finalgoal of the model is to predict whether the customer is likely to churn or not.  We are using Neural Network Model to mine the data.  Before selecting mining method we ran data through regression and classification and found that Neural networks will help in better mining and understanding the data.  After exploring our variables and gaining an understanding of potential relationships we fit a neural network. We omit the variable State and Area and focus on predictors related to call and plan information.  We use the default model that has a single hidden layer with three nodes.  We also use the default Holdback Validation Method, one-third of random data for model validation.
  • 10.
    • Referring thevalidation data model, we achieved an R- square of 60.7% i.e. 60.7 percent of data is explained by selected explanatory variables. • Furthermore, the misclassification rate is 7.11%, and rule of thumb states – lower misclassification rate indicates better performance. • Studying the confusion matrix, we see that for customers who actually churned, 58.4% of the time the model correctly predicted that they would churn. • Out of 1111 rows, the classifier predicted ”True" 106 times, and ”False" 1005 times. • In reality, 161 customer in the sample data have churn = True, and 950 customers have churn = False. • Precision is 88.6 %.
  • 11.
    • For customerswith international calling plans, the probability of churning is TRUE as the usage minutes for day, night, evening increases. • Also, decreases in international calls, and charge increase for those types of calls has greater effect on Churn. • The more service call a customer makes, churn increases gradually. • Variables such as the number of calls, account length, voicemail features, and voicemail usage do not seem to be strongly related to the probability of churning. • There is a threshold for each variable where churn is most likely to occur.
  • 12.
    • Analyzing thesummary report and Marginal model plots, we can see that major variable that can affect the business are Total night minutes, Total night charges, Total evening minutes and Total international charge. • Other variables does not affect the churn rate drastically.
  • 13.
    • Removing variableslike Account length, number of voicemail message, voicemail plan. • Also, using 4 hidden layers and 0.2 as holdback proportion. • After changing above parameters and analyzing the validation column the misclassification rate increased to 8.8 percent. • The Rsquare value shows less variability i.e. 56%.
  • 14.
    Examining the datawe came to know which factors were responsible for Churn of customers.  Increase in usage of day, evening and night minutes has high likelihood of Churn.  Categorical profiler shows that International plan has the major impact on the churn rate.  Telecom company should focus on creating contracts or monthly plan with good offers on International calling.  Another major factor for Churn is more customer service calls, which clearly depicts that company may be facing some infrastructure or technical issue in certain areas.