Download to read offline


![• The term β represents the ability of the model to identify would-be
3-12-2014 pag. 8
churners, and 훽 = 훽0휆(훼):
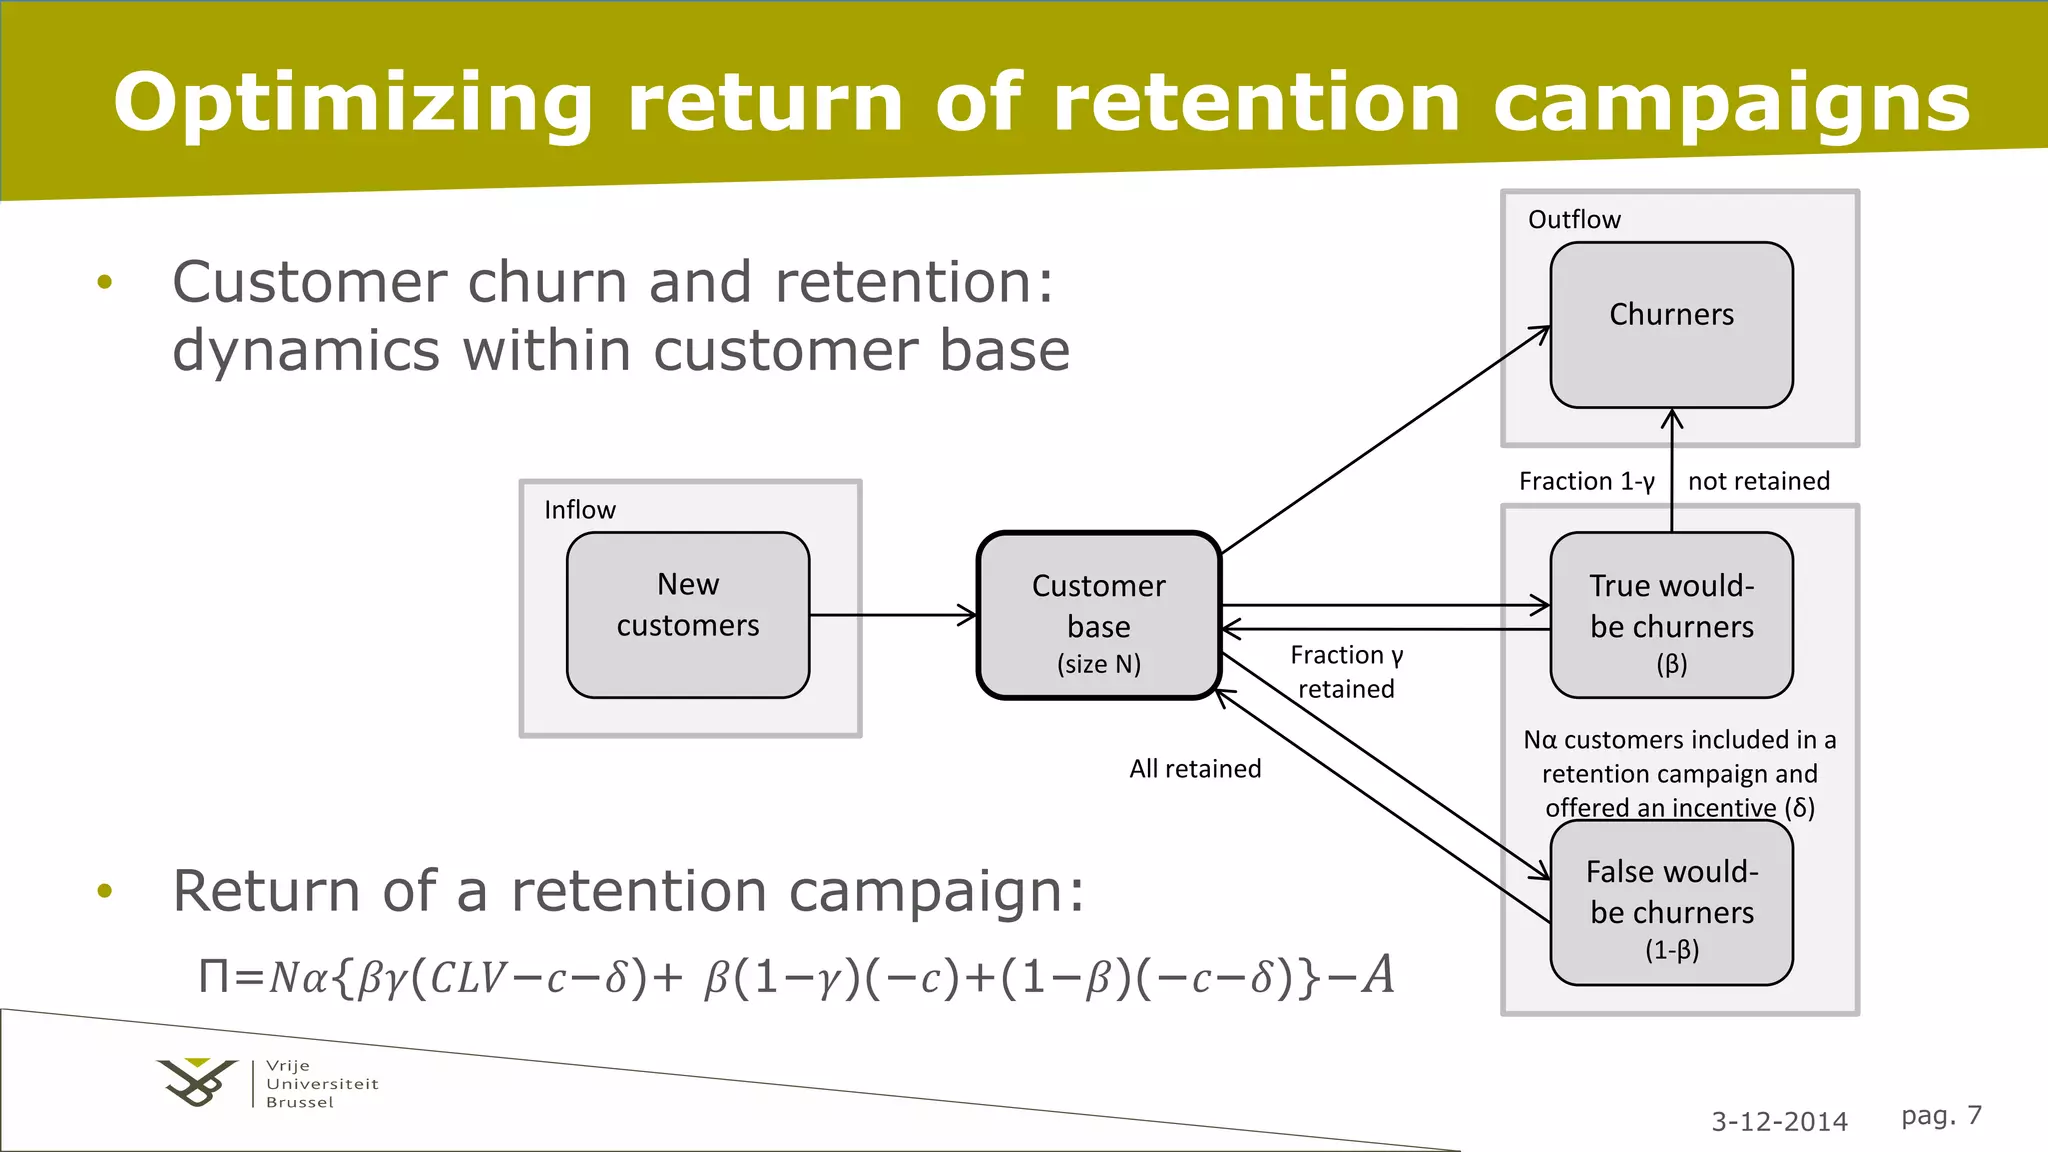
Π = 푁훼 [훾퐶퐿푉 + 훿(1 − 훾)]훽0휆(훼) − 훿 − 푐 − 퐴
• The maximum profit measure is defined as:
MP = max
훼
(П)
• Managerial implications: 훼표푝푡푖푚푎푙
• Benchmarking study: significant profit gains!](https://image.slidesharecdn.com/02-baqmarpresentation26-11-2014-marketics-wouterverbeke-ok-141203152547-conversion-gate02/75/Wouter-Verbeke-Marketics-Adapted-Analytics-for-Marketing-Applications-8-2048.jpg)


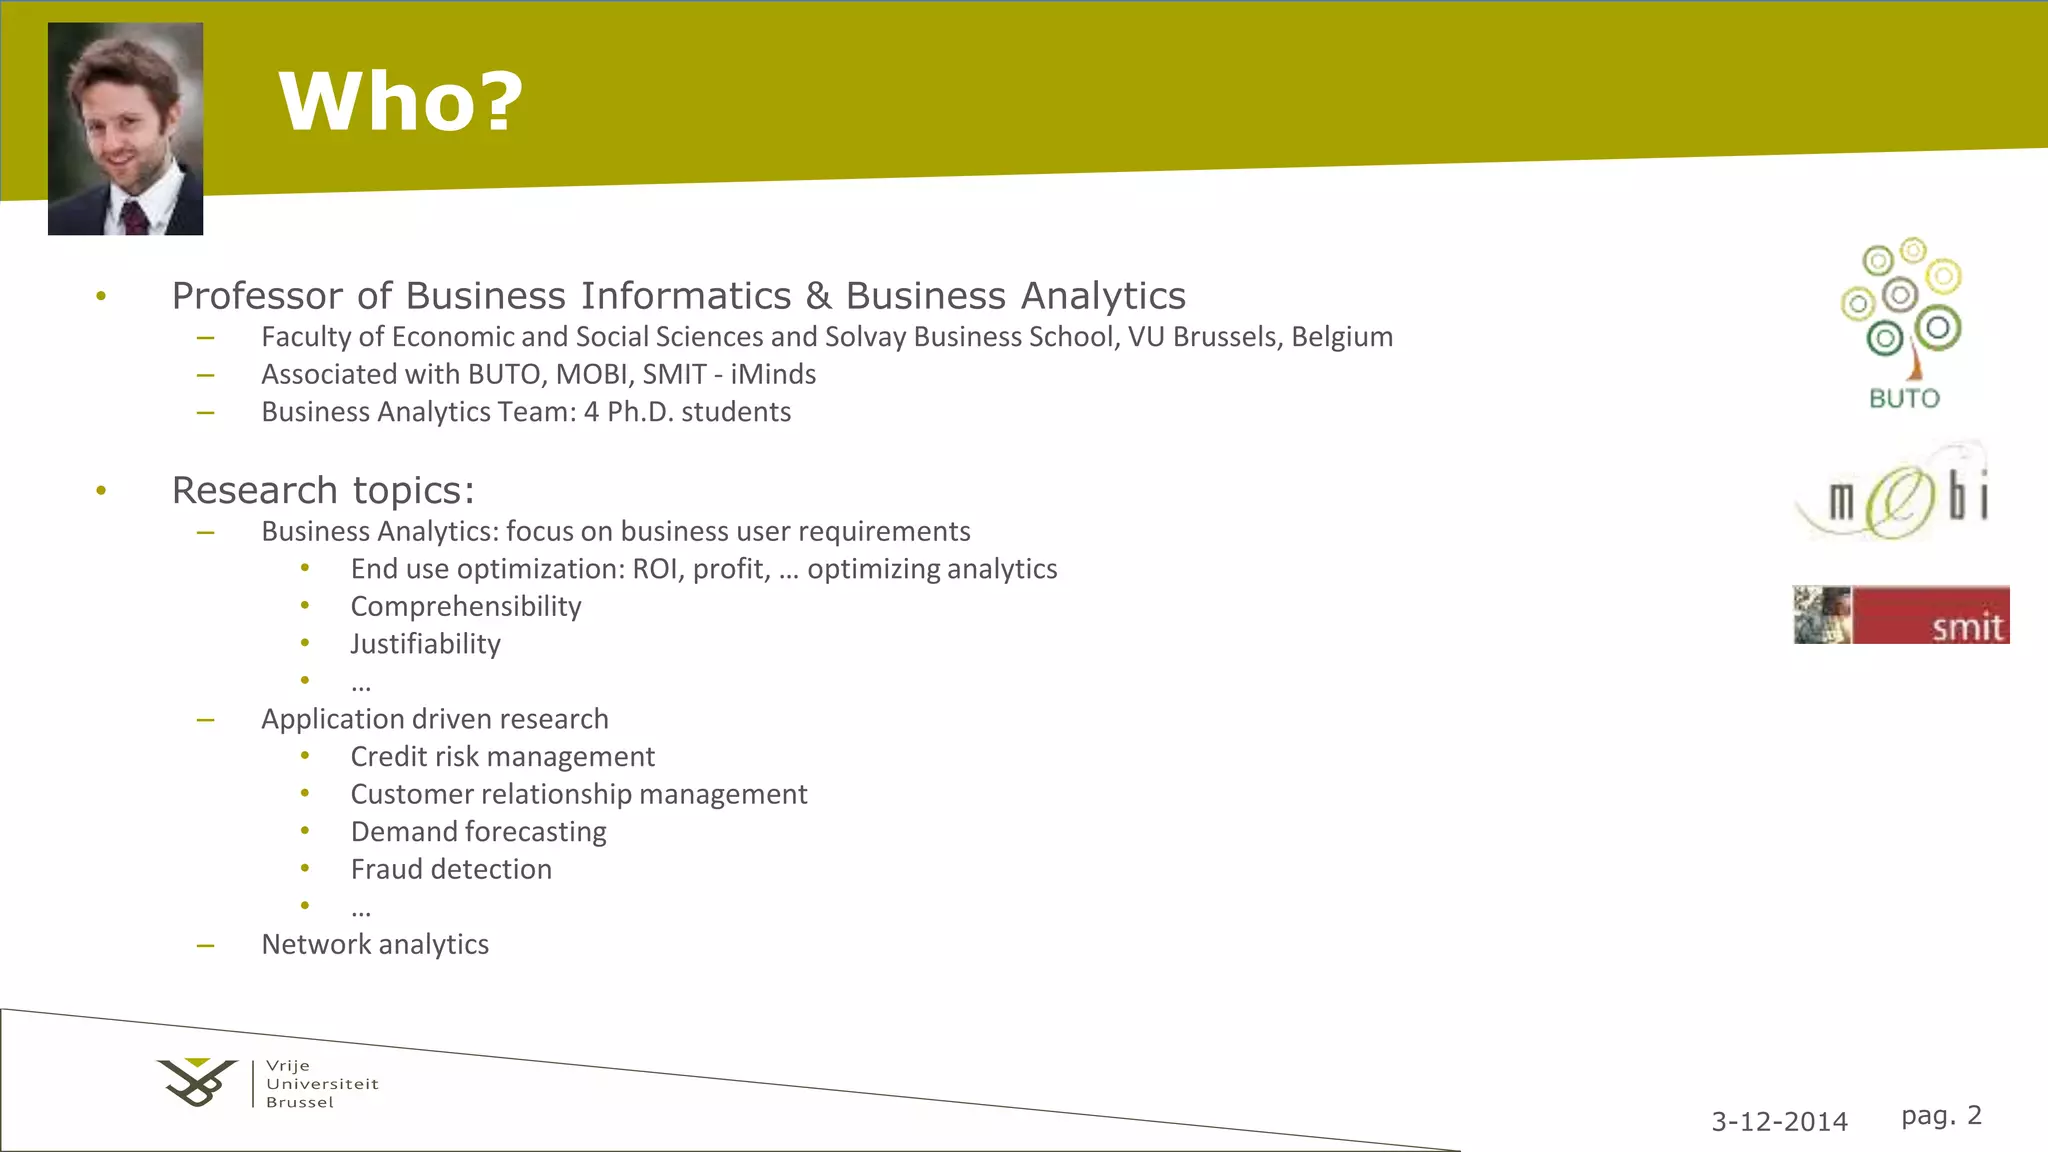
This document summarizes a presentation by Professor Wouter Verbeke on adapting analytics for marketing applications. Some key points: - Verbeke leads a research team focusing on business analytics and applications in areas like credit risk, customer retention, and fraud detection. - The team's work emphasizes optimizing models for business users and ensuring comprehensibility and justifiability of results. - Research includes predicting customer churn, optimizing retention campaigns, evaluating models using control groups, and applying social network analysis to descriptive and predictive problems in marketing.