Chisq.pptx
•Download as PPTX, PDF•
0 likes•49 views
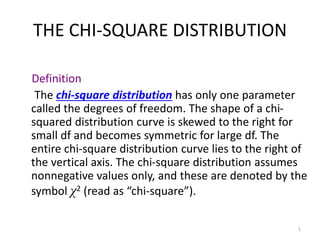
1) The document discusses the chi-square distribution and its properties including that it has one parameter called degrees of freedom, assumes only nonnegative values denoted by χ2, and its curve shape depends on the degrees of freedom. 2) It provides an example of finding the value of χ2 for 7 degrees of freedom and an area of 0.10 in the right tail. 3) It discusses contingency tables and tests of independence, defining them as testing whether two attributes in a population are related. The test statistic is calculated as the sum of the squared differences between observed and expected frequencies divided by the expected frequencies.
Report
Share
Report
Share

Recommended
One. Clark Heter is an industrial engineer at Lyons Products. He .docx
One. Clark Heter is an industrial engineer at Lyons Products. He would like to determine whether there are more units produced on the night shift than on the day shift. A sample of 50 day-shift workers showed that the mean number of units produced was 353, with a population standard deviation of 25. A sample of 55 night-shift workers showed that the mean number of units produced was 363, with a population standard deviation of 31 units.
At the .01 significance level, is the number of units produced on the night shift larger?
(a)
This is a -tailed test.
(b)
The decision rule is to reject if Z < . (Negative amount should be indicated by a minus sign. Round your answer to 2 decimal places.)
(c)
The test statistic is Z = . (Negative amount should be indicated by a minus sign. Round your answer to 2 decimal places.)
TWO
Each month the National Association of Purchasing Managers publishes the NAPM index. One of the questions asked on the survey to purchasing agents is: Do you think the economy is contracting? Last month, of the 310 responses, 164 answered yes to the question. This month, 177 of the 291 responses indicated they felt the economy was contracting.
At the .02 significance level, can we conclude that a larger proportion of the agents believe the economy is contracting this month?
pc = . (Do not round the intermediate value. Round your answer to 2 decimal places.)
The test statistic is . (Negative amount should be indicated by a minus sign. Do not round the intermediate value. Round your answer to 2 decimal places.)
Decision: the null. H0 : π1 ≥ π2
THREE
The manufacturer of an MP3 player wanted to know whether a 10 percent reduction in price is enough to increase the sales of its product. To investigate, the owner randomly selected eight outlets and sold the MP3 player at the reduced price. At seven randomly selected outlets, the MP3 player was sold at the regular price. Reported below is the number of units sold last month at the sampled outlets.
Regular price
133
124
88
112
144
128
96
Reduced price
124
134
152
134
114
109
113
114
At the .050 significance level, can the manufacturer conclude that the price reduction resulted in an increase in sales? Hint: For the calculations, assume the Reduced price as the first sample.
The pooled variance is . (Round your answer to 2 decimal places.)
The test statistic is . (Round your answer to 2 decimal places.)
H0.
FOUR
One of the music industry's most pressing questions is: Can paid download stores contend nose-to-nose with free peer-to-peer download services? Data gathered over the last 12 months show Apple's iTunes was used by an average of 1.81 million households with a sample standard deviation of .47 million family units. Over the same 12 months WinMX (a no-cost P2P download service) was used by an average of 2.21 million families with a sample standard deviation of .32 million. Assume the population standard deviations are not the sam.
1. Consider the following partially completed computer printout fo.docx
1. Consider the following partially completed computer printout for a regression analysis where the dependent variable is the price of a personal computer and the independent variable is the size of the hard drive.
Based on the information provided, what is the F statistic?
About 8 .33
Just over 2.35
About 4.76
About 69.5
4 points
QUESTION 2
1. The standard error of the estimate is a measure of
total variation of the Y variable.
the variation around the sample regression line.
explained variation.
the variation of the X variable.
4 points
QUESTION 3
3.Nintendo Sony would like to test the hypothesis that a difference exists in the average age of users of a Wii, a PlayStation, or an Xbox console game. The following data represent the age of a random sample of Wii, PlayStation, and Xbox users.
Wii
PlayStation
Xbox
37
26
31
31
21
20
47
24
38
29
24
31
36
25
30
Using α = 0.05, the conclusion for this hypothesis test would be that because the test statistic is
more than the critical value, we cannot conclude that there is a difference in the average age of users of a Wii, a PlayStation, or an Xbox console game.
less than the critical value, we cannot conclude that there is a difference in the average age of users of a Wii, a PlayStation, or an Xbox console game.
more than the critical value, we can conclude that there is a difference in the average age of users of a Wii, a PlayStation, or an Xbox console game.
less than the critical value, we can conclude that there is a difference in the average age of users of a Wii, a PlayStation, or an Xbox console game.
4 points
QUESTION 4
1. The relationship of Y to four other variables was established as Y = 12 + 3X1 - 5X2 + 7X3 + 2X4. When X1 increases 5 units and X2 In a sample of n = 23, the Student's t test statistic for a correlation of r = .500 would be:
2.559
2.819
2.646
can’t say without knowing α (alpha)
4 points
QUESTION 5
1. Given the following ANOVA table (some information is missing), find the F statistic.
3.71
0.99
0.497
4.02
4 points
QUESTION 6
1. Examine the following two-factor analysis of variance table:
Complete the analysis of variance table.
MSA = 40.928, F Factor A =3.35, SSB = 85.35, Factor B df = 3, F Factor B = 2.316, MSAB = 21.859, F Factor AB = 1.8, SSE = 789.29, SSE df = 66, MSE = 12.143
MSA = 40.928, F Factor A = 3.35, SSB = 85.35, Factor B df = 4, F Factor B = 2.316, MSAB = 21.859, F Factor AB = 2.1 SSE = 789.29, SSE df = 66, MSE = 12.143
MSA = 40.698, F Factor A = 3.35, SSB = 84.35, Factor B df = 5, F Factor B = 2.316, MSAB = 21.859, F Factor AB = 2.1, SSE = 789.29, SSE df = 65, MSE = 12.143
MSA = 40.698, F Factor A = 3.35, SSB = 84.35, Factor B df = 3, F Factor B = 2.316, MSAB = 21.859, F Factor AB = 1.8, SSE = 789.29, SSE df = 65, MSE = 12.143
4 points
QUESTION 7
1. The critical value for a two-tailed test of H0: ß1 = 0 at a (alpha) = .05 in a simple regression with 22 observations is:
+ or - 1.725 ...
Analysis of variance (ANOVA)
ANOVA is very important statistical tool for analysis of data in specific case.
Practice test ch 10 correlation reg ch 11 gof ch12 anova
Please Subscribe to this Channel for more solutions and lectures
http://www.youtube.com/onlineteaching
Elementary Statistics Practice Test 5
Module 5
Chapter 10: Correlation and Regression
Chapter 11: Goodness of Fit and Contingency Tables
Chapter 12: Analysis of Variance
1. fj What value of the constant c will make the following lim.docx
1. fj What value of the constant c will make the following limit exist?
[(
2X + [x I) ]M~ x (x2 + C - 2)
following statements are true and give an explanation to justify your answer.
1
-6 -5 -4 -3 -2 -1 o 1 2 3 4 5 6
-1
(a). limx-->_2 f(x) = 1
(b).f( -2) = f(2)
-( \
(c). y = 3 is a horizontal asymptote of [,
(d).f'(l) = 4
(e). [is not differentiable at three values ofx.
(f). limX-.l [(x) = [(1)
(g). f' (-3) + f' (2.5) = 0
3. 4••• ~Find :~ for the following functions. Simplify your solution if possible.
(a). y = 41n(x2 - 3x + 4)
(b). y = xtan(x)
(c). y = e21n(X)
4. ~ One bicyclist is 4 miles east of an intersection and is traveling toward the
intersection at a rate of9 mph. At the same time, a second bicyclist is 3 miles south of the
intersection and is traveling away from the intersection at a rate of 10 mph. Is the distance
between the two bicyclists increasing, or is it decreasing? At what rate is the distance changing?
5..~ -' -~ Finding an equation of the line tangent to the following curves at the given point.
(a). y = 4x5 + cos x; X = 0
(b). xy +.JXY = 6; (x,y) = (1,4)
Question 1
An independent-measures t test produced a t statistic with df = 20. If the same data had been evaluated with an analysis of variance, what would be the df values for the F-ratio?
Answer
a.
1, 20
b.
2, 20
c.
1, 19
d.
2, 19
Question 2
An analysis of variance comparing three treatment conditions produces dftotal = 24. For this ANOVA, what is the value of dfwithin?
Answer
a.
3
b.
2
c.
21
d.
22
Question 3
A researcher uses analysis of variance to test for mean differences among four treatments with a sample of n = 6 in each treatment. The F-ratio for this analysis would have what df values?
Answer
a.
df = 3, 15
b.
df = 4, 24
c.
df = 3, 5
d.
df = 3, 20
Question 4
For an analysis of variance comparing four treatments, MSbetween = 12. What is the value of SSbetween?
Answer
a.
4
b.
48
c.
36
d.
3
Question 5
An analysis of variance produces SSwithin = 40 and MSwithin = 10. In this analysis, how many treatment conditions are being compared?
Answer
a.
4
b.
5
c.
50
d.
30
Question 6
An analysis of variance comparing three treatment conditions produces dftotal = 24. For this ANOVA, what is the value of dfbetween?
Answer
a.
2
b.
3
c.
22
d.
21
Question 7
An independent-measures research study compares three treatment conditions using a sample of n = 5 in each treatment. For this study, the three sample totals are, T1 = 5, T2 = 10, and T3 = 15. What value would be obtained for SSbetween?
Answer
a.
15
b.
5
c.
1
d.
10
Question 8
An independent-measures research study compares three treatment conditions using a sample of n = 5 in each treatment. For this study, the three sample totals are, T1 = 5, T2 = 10, T3 = 15, and 2 = 75 for the entire set of scores. What value would be obtained for SStotal?
Answer
a.
15
b.
5
c.
10
d.
1
Question 9
The following table shows the results of an analysis of variance. Based on this tabl ...
Probability distribution of a random variable module
This is a module 1 for Statistics and Probability for Grade 11
Educational Psychology 565 Practice Quiz(use α = .05 unl.docx
Educational Psychology 565 Practice Quiz
(use α = .05 unless otherwise stated).
1. A small school district wants to know what type of teaching/learning is most effective at helping students learn to read. Three methods are proposed (top-down, bottom-up, and interactive). It is believed that the gender of the teacher may also be important in student learning, so the study also aims to determine if gender of the teacher is important. There are 12 schools in the district, and each school has 1 second grade class (each class has 10 students). Two female teachers and two male teachers’ classrooms are randomly assigned to each of the three methods (all 12 teachers have just been hired in the district). At the end of the year, the students all took a 100 item standardized multiple-choice reading test called the “EZreading” test (note: the analysis was performed at the student level).
Coding:
teachgender = gender of teacher: 1= men, 2 = women
Teachmeth = teaching method (1=top-down, 2=bottom-up, 3=interactive)
EZread = scores on the Ezread reading test
Use SPSS output “SPSS printout for question 1”to help answer the parts below.
a. What is/are the independent variable(s) in this experiment (Be specific)? What level of measurement is/are the IV(s)? Explain why?
b. What is/are the dependent variable(s) in this experiment (Be specific)? What level of measurement is/are the DV(s)? Explain why?
c. State the null hypotheses and alternative hypotheses for the factors and the interaction in symbols and words.
d. Do you think the assumption of homogeneity of variance has been met? Support your answer.
e. Do you think the assumption of independence has been met? Support your answer.
f. Calculate Cohen’s d for the difference between the top-down and interactive methods. Explain what Cohen’s d means for this comparison.
g. Is the interaction of the two factors statistically significant? Explain your answer.
h. Report the results of the study along with an interpretation for the results. You do not need to write up the results like a results section; you can just report the findings with statements about each factor and the interaction of the two factors. Be sure to cite evidence from your analysis.
i. Based on the results of the study what would you recommend about teaching method and gender of teachers?
2. Answer the following questions.
Source
SS
df
MS
F
Between
100
20
Within
2
50
Total
200
7
a. Complete the ANOVA source table (fill in all blank spaces)
b. How many people are in this study. (hint: use degrees of freedom)
c. What is the critical F at α = .01? Would you reject the null hypothesis? Explain your answer.
d. What are the critical F at α = .05? Would you reject the null hypothesis? Explain your answer.
e. Why do the conclusions from items c and d differ? Explain your answer in terms of Type I and II errors.
3. A researcher wants to kn.
Descriptive Statistics Formula Sheet Sample Populatio.docx
Descriptive Statistics Formula Sheet
Sample Population
Characteristic statistic Parameter
raw scores x, y, . . . . . X, Y, . . . . .
mean (central tendency) M =
∑ x
n
μ =
∑ X
N
range (interval/ratio data) highest minus lowest value highest minus lowest value
deviation (distance from mean) Deviation = (x − M ) Deviation = (X − μ )
average deviation (average
distance from mean)
∑(x − M )
n
= 0
∑(X − μ )
N
sum of the squares (SS)
(computational formula) SS = ∑ x
2 −
(∑ x)2
n
SS = ∑ X2 −
(∑ X)2
N
variance ( average deviation2 or
standard deviation
2
)
(computational formula)
s2 =
∑ x2 −
(∑ x)2
n
n − 1
=
SS
df
σ2 =
∑ X2 −
(∑ X)2
N
N
standard deviation (average
deviation or distance from mean)
(computational formula) s =
√∑ x
2 −
(∑ x)2
n
n − 1
σ =
√∑ X
2 −
(∑ X)2
N
N
Z scores (standard scores)
mean = 0
standard deviation = ± 1.0
Z =
x − M
s
=
deviation
stand. dev.
X = M + Zs
Z =
X − μ
σ
X = μ + Zσ
Area Under the Normal Curve -1s to +1s = 68.3%
-2s to +2s = 95.4%
-3s to +3s = 99.7%
Using Z Score Table for Normal Distribution
(Note: see graph and table in A-23)
for percentiles (proportion or %) below X
for positive Z scores – use body column
for negative Z scores – use tail column
for proportions or percentage above X
for positive Z scores – use tail column
for negative Z scores – use body column
to discover percentage / proportion between two X values
1. Convert each X to Z score
2. Find appropriate area (body or tail) for each Z score
3. Subtract or add areas as appropriate
4. Change area to % (area × 100 = %)
Regression lines
(central tendency line for all
points; used for predictions
only) formula uses raw
scores
b = slope
a = y-intercept
y = bx + a
(plug in x
to predict y)
b =
∑ xy −
(∑ x)(∑ y)
n
∑ x2 −
(∑ x)2
n
a = My - bMx
where My is mean of y
and Mx is mean of x
SEest (measures accuracy of predictions; same properties as standard deviation)
Pearson Correlation Coefficient
(used to measure relationship;
uses Z scores)
r =
∑ xy−
(∑ x)(∑ y)
n
√(∑ x2−
(∑ x)2
n
)(∑ y2−
(∑ y)2
n
)
r =
degree x & 𝑦 𝑣𝑎𝑟𝑦 𝑡𝑜𝑔𝑒𝑡ℎ𝑒𝑟
degree x & 𝑦 𝑣𝑎𝑟𝑦 𝑠𝑒𝑝𝑎𝑟𝑎𝑡𝑒𝑙𝑦
r
2
= estimate or % of accuracy of predictions
PSYC 2317 Mark W. Tengler, M.S.
Assignment #9
Hypothesis Testing
9.1 Briefly explain in your own words the advantage of using an alpha level (α) = .01
versus an α = .05. In general, what is the disadvantage of using a smaller alpha
level?
9.2 Discuss in your own words the errors that can be made in hypothesis testing.
a. What is a type I error? Why might it occur?
b. What is a type II error? How does it happen?
9.3 The term error is used in two different ways in the context of a hypothesis test.
First, there is the concept of sta
Week8 livelecture2010 follow_up
This is just a follow up to the Week 8 Lecture with additional explanations on some problems.
Contingency Tables
Please Subscribe to this Channel for more solutions and lectures
http://www.youtube.com/onlineteaching
Chapter 11: Goodness-of-Fit and Contingency Tables
11.2: Contingency Tables
EPS 525 – Introduction to StatisticsAssignment No. 5 – One-w.docx
EPS 525 – Introduction to Statistics
Assignment No. 5 – One-way Analysis of Variance
Name:
A researcher conducted a study to examine the effects of secure, anxious, and avoidant attachment styles on the physiology of sleep. Participants were selected using a stratified random sampling approach to ensure representation of each of the three styles. The sleep patterns of 30 secure, 30 anxious, and 30 avoidant children were monitored. Of primary importance to the researcher was the overall percentage of time each child spent in deep (delta) sleep. Following is the average amount of time that each child spent in delta sleep, expressed as a percentage of total sleep time (ranging from 0.0 to 100.0). For the attachment styles, 1 = secure, 2 = anxious, and 3 = avoidant.
Data Output for this Assignment is found on the last four pages.
The gray boxes for your answers will expand as necessary for your responses.
1.
(2 points) What would the null hypothesis be for this study? Show/write the appropriate symbols and expression in words.
H0:
.
2.
(2 points) What would the alternative hypothesis be for this study? Show/write the appropriate symbols and expression in words.
Ha:
3.
Prior to examining whether the group means differ; you need to test the underlying assumptions of the one-way analysis of variance.
3.a.
(2 points) Has the assumption of independence been met for this data?
FORMCHECKBOX
Yes
FORMCHECKBOX
No
(check your answer selection)
Indicate how you made your determination.
3.b.
(3 points) Has the assumption of normality been met for this data, using an alpha level of .001?
FORMCHECKBOX
Yes
FORMCHECKBOX
No
(check your answer selection)
Indicate how you made your determination. Be sure to include all applicable values and symbols.
3.c.
(3 points) Has the assumption of homogeneity of variance been met for this data, using an alpha level of .05? That is, is this assumption met or not met?
FORMCHECKBOX
Yes
FORMCHECKBOX
No
(check your answer selection)
Indicate how you came to your conclusion. Be sure to include all applicable values and symbols.
4.
(2 points) The next question that needs to be answered is whether all of the groups are the same in their percentage of time in deep (delta) sleep using an alpha level of .05. If applicable (or indicate why not), use the Welch statistic. What is your conclusion (at this point) from this analysis? Indicate how you came to your conclusion. Be sure to include all applicable values and symbols.
5.
(3 points) Calculate the measure of association and interpret its meaning.
W
T
W
B
MS
SS
MS
K
SS
+
-
-
=
)
1
(
2
wWhere
SSB =
K =
MSW =
SST =
MSW =
Therefore, (2 =
This means:
6.
(1 point) Write the statistical strand for this one-way ANOVA analysis.
7.
(4 points) Assuming that you found a significant F, which pairs of groups differ? Indicate which post hoc procedure you used and why. Indicate your findings fr ...
Practice Test 5B Multinomial Experiments and Contingency Tables Solution
Practice Test 5B Multinomial Experiments and Contingency Tables Solution
Chapter 11 Chi-Square Tests and ANOVA 359 Chapter .docx
Chapter 11: Chi-Square Tests and ANOVA
359
Chapter 11: Chi-Square and ANOVA Tests
This chapter presents material on three more hypothesis tests. One is used to determine
significant relationship between two qualitative variables, the second is used to determine
if the sample data has a particular distribution, and the last is used to determine
significant relationships between means of 3 or more samples.
Section 11.1: Chi-Square Test for Independence
Remember, qualitative data is where you collect data on individuals that are categories or
names. Then you would count how many of the individuals had particular qualities. An
example is that there is a theory that there is a relationship between breastfeeding and
autism. To determine if there is a relationship, researchers could collect the time period
that a mother breastfed her child and if that child was diagnosed with autism. Then you
would have a table containing this information. Now you want to know if each cell is
independent of each other cell. Remember, independence says that one event does not
affect another event. Here it means that having autism is independent of being breastfed.
What you really want is to see if they are not independent. In other words, does one
affect the other? If you were to do a hypothesis test, this is your alternative hypothesis
and the null hypothesis is that they are independent. There is a hypothesis test for this
and it is called the Chi-Square Test for Independence. Technically it should be called
the Chi-Square Test for Dependence, but for historical reasons it is known as the test for
independence. Just as with previous hypothesis tests, all the steps are the same except for
the assumptions and the test statistic.
Hypothesis Test for Chi-Square Test
1. State the null and alternative hypotheses and the level of significance
Ho : the two variables are independent (this means that the one variable is not
affected by the other)
HA : the two variables are dependent (this means that the one variable is affected
by the other)
Also, state your α level here.
2. State and check the assumptions for the hypothesis test
a. A random sample is taken.
b. Expected frequencies for each cell are greater than or equal to 5 (The expected
frequencies, E, will be calculated later, and this assumption means E ≥ 5 ).
3. Find the test statistic and p-value
Finding the test statistic involves several steps. First the data is collected and
counted, and then it is organized into a table (in a table each entry is called a cell).
These values are known as the observed frequencies, which the symbol for an
observed frequency is O. Each table is made up of rows and columns. Then each
row is totaled to give a row total and each column is totaled to give a column
total.
Chapter 11: Chi-Squared Tests and ANOVA
360
The null hypothesis is that the variables are independent. Using the multiplication.
More Related Content
Similar to Chisq.pptx
1. fj What value of the constant c will make the following lim.docx
1. fj What value of the constant c will make the following limit exist?
[(
2X + [x I) ]M~ x (x2 + C - 2)
following statements are true and give an explanation to justify your answer.
1
-6 -5 -4 -3 -2 -1 o 1 2 3 4 5 6
-1
(a). limx-->_2 f(x) = 1
(b).f( -2) = f(2)
-( \
(c). y = 3 is a horizontal asymptote of [,
(d).f'(l) = 4
(e). [is not differentiable at three values ofx.
(f). limX-.l [(x) = [(1)
(g). f' (-3) + f' (2.5) = 0
3. 4••• ~Find :~ for the following functions. Simplify your solution if possible.
(a). y = 41n(x2 - 3x + 4)
(b). y = xtan(x)
(c). y = e21n(X)
4. ~ One bicyclist is 4 miles east of an intersection and is traveling toward the
intersection at a rate of9 mph. At the same time, a second bicyclist is 3 miles south of the
intersection and is traveling away from the intersection at a rate of 10 mph. Is the distance
between the two bicyclists increasing, or is it decreasing? At what rate is the distance changing?
5..~ -' -~ Finding an equation of the line tangent to the following curves at the given point.
(a). y = 4x5 + cos x; X = 0
(b). xy +.JXY = 6; (x,y) = (1,4)
Question 1
An independent-measures t test produced a t statistic with df = 20. If the same data had been evaluated with an analysis of variance, what would be the df values for the F-ratio?
Answer
a.
1, 20
b.
2, 20
c.
1, 19
d.
2, 19
Question 2
An analysis of variance comparing three treatment conditions produces dftotal = 24. For this ANOVA, what is the value of dfwithin?
Answer
a.
3
b.
2
c.
21
d.
22
Question 3
A researcher uses analysis of variance to test for mean differences among four treatments with a sample of n = 6 in each treatment. The F-ratio for this analysis would have what df values?
Answer
a.
df = 3, 15
b.
df = 4, 24
c.
df = 3, 5
d.
df = 3, 20
Question 4
For an analysis of variance comparing four treatments, MSbetween = 12. What is the value of SSbetween?
Answer
a.
4
b.
48
c.
36
d.
3
Question 5
An analysis of variance produces SSwithin = 40 and MSwithin = 10. In this analysis, how many treatment conditions are being compared?
Answer
a.
4
b.
5
c.
50
d.
30
Question 6
An analysis of variance comparing three treatment conditions produces dftotal = 24. For this ANOVA, what is the value of dfbetween?
Answer
a.
2
b.
3
c.
22
d.
21
Question 7
An independent-measures research study compares three treatment conditions using a sample of n = 5 in each treatment. For this study, the three sample totals are, T1 = 5, T2 = 10, and T3 = 15. What value would be obtained for SSbetween?
Answer
a.
15
b.
5
c.
1
d.
10
Question 8
An independent-measures research study compares three treatment conditions using a sample of n = 5 in each treatment. For this study, the three sample totals are, T1 = 5, T2 = 10, T3 = 15, and 2 = 75 for the entire set of scores. What value would be obtained for SStotal?
Answer
a.
15
b.
5
c.
10
d.
1
Question 9
The following table shows the results of an analysis of variance. Based on this tabl ...
Probability distribution of a random variable module
This is a module 1 for Statistics and Probability for Grade 11
Educational Psychology 565 Practice Quiz(use α = .05 unl.docx
Educational Psychology 565 Practice Quiz
(use α = .05 unless otherwise stated).
1. A small school district wants to know what type of teaching/learning is most effective at helping students learn to read. Three methods are proposed (top-down, bottom-up, and interactive). It is believed that the gender of the teacher may also be important in student learning, so the study also aims to determine if gender of the teacher is important. There are 12 schools in the district, and each school has 1 second grade class (each class has 10 students). Two female teachers and two male teachers’ classrooms are randomly assigned to each of the three methods (all 12 teachers have just been hired in the district). At the end of the year, the students all took a 100 item standardized multiple-choice reading test called the “EZreading” test (note: the analysis was performed at the student level).
Coding:
teachgender = gender of teacher: 1= men, 2 = women
Teachmeth = teaching method (1=top-down, 2=bottom-up, 3=interactive)
EZread = scores on the Ezread reading test
Use SPSS output “SPSS printout for question 1”to help answer the parts below.
a. What is/are the independent variable(s) in this experiment (Be specific)? What level of measurement is/are the IV(s)? Explain why?
b. What is/are the dependent variable(s) in this experiment (Be specific)? What level of measurement is/are the DV(s)? Explain why?
c. State the null hypotheses and alternative hypotheses for the factors and the interaction in symbols and words.
d. Do you think the assumption of homogeneity of variance has been met? Support your answer.
e. Do you think the assumption of independence has been met? Support your answer.
f. Calculate Cohen’s d for the difference between the top-down and interactive methods. Explain what Cohen’s d means for this comparison.
g. Is the interaction of the two factors statistically significant? Explain your answer.
h. Report the results of the study along with an interpretation for the results. You do not need to write up the results like a results section; you can just report the findings with statements about each factor and the interaction of the two factors. Be sure to cite evidence from your analysis.
i. Based on the results of the study what would you recommend about teaching method and gender of teachers?
2. Answer the following questions.
Source
SS
df
MS
F
Between
100
20
Within
2
50
Total
200
7
a. Complete the ANOVA source table (fill in all blank spaces)
b. How many people are in this study. (hint: use degrees of freedom)
c. What is the critical F at α = .01? Would you reject the null hypothesis? Explain your answer.
d. What are the critical F at α = .05? Would you reject the null hypothesis? Explain your answer.
e. Why do the conclusions from items c and d differ? Explain your answer in terms of Type I and II errors.
3. A researcher wants to kn.
Descriptive Statistics Formula Sheet Sample Populatio.docx
Descriptive Statistics Formula Sheet
Sample Population
Characteristic statistic Parameter
raw scores x, y, . . . . . X, Y, . . . . .
mean (central tendency) M =
∑ x
n
μ =
∑ X
N
range (interval/ratio data) highest minus lowest value highest minus lowest value
deviation (distance from mean) Deviation = (x − M ) Deviation = (X − μ )
average deviation (average
distance from mean)
∑(x − M )
n
= 0
∑(X − μ )
N
sum of the squares (SS)
(computational formula) SS = ∑ x
2 −
(∑ x)2
n
SS = ∑ X2 −
(∑ X)2
N
variance ( average deviation2 or
standard deviation
2
)
(computational formula)
s2 =
∑ x2 −
(∑ x)2
n
n − 1
=
SS
df
σ2 =
∑ X2 −
(∑ X)2
N
N
standard deviation (average
deviation or distance from mean)
(computational formula) s =
√∑ x
2 −
(∑ x)2
n
n − 1
σ =
√∑ X
2 −
(∑ X)2
N
N
Z scores (standard scores)
mean = 0
standard deviation = ± 1.0
Z =
x − M
s
=
deviation
stand. dev.
X = M + Zs
Z =
X − μ
σ
X = μ + Zσ
Area Under the Normal Curve -1s to +1s = 68.3%
-2s to +2s = 95.4%
-3s to +3s = 99.7%
Using Z Score Table for Normal Distribution
(Note: see graph and table in A-23)
for percentiles (proportion or %) below X
for positive Z scores – use body column
for negative Z scores – use tail column
for proportions or percentage above X
for positive Z scores – use tail column
for negative Z scores – use body column
to discover percentage / proportion between two X values
1. Convert each X to Z score
2. Find appropriate area (body or tail) for each Z score
3. Subtract or add areas as appropriate
4. Change area to % (area × 100 = %)
Regression lines
(central tendency line for all
points; used for predictions
only) formula uses raw
scores
b = slope
a = y-intercept
y = bx + a
(plug in x
to predict y)
b =
∑ xy −
(∑ x)(∑ y)
n
∑ x2 −
(∑ x)2
n
a = My - bMx
where My is mean of y
and Mx is mean of x
SEest (measures accuracy of predictions; same properties as standard deviation)
Pearson Correlation Coefficient
(used to measure relationship;
uses Z scores)
r =
∑ xy−
(∑ x)(∑ y)
n
√(∑ x2−
(∑ x)2
n
)(∑ y2−
(∑ y)2
n
)
r =
degree x & 𝑦 𝑣𝑎𝑟𝑦 𝑡𝑜𝑔𝑒𝑡ℎ𝑒𝑟
degree x & 𝑦 𝑣𝑎𝑟𝑦 𝑠𝑒𝑝𝑎𝑟𝑎𝑡𝑒𝑙𝑦
r
2
= estimate or % of accuracy of predictions
PSYC 2317 Mark W. Tengler, M.S.
Assignment #9
Hypothesis Testing
9.1 Briefly explain in your own words the advantage of using an alpha level (α) = .01
versus an α = .05. In general, what is the disadvantage of using a smaller alpha
level?
9.2 Discuss in your own words the errors that can be made in hypothesis testing.
a. What is a type I error? Why might it occur?
b. What is a type II error? How does it happen?
9.3 The term error is used in two different ways in the context of a hypothesis test.
First, there is the concept of sta
Week8 livelecture2010 follow_up
This is just a follow up to the Week 8 Lecture with additional explanations on some problems.
Contingency Tables
Please Subscribe to this Channel for more solutions and lectures
http://www.youtube.com/onlineteaching
Chapter 11: Goodness-of-Fit and Contingency Tables
11.2: Contingency Tables
EPS 525 – Introduction to StatisticsAssignment No. 5 – One-w.docx
EPS 525 – Introduction to Statistics
Assignment No. 5 – One-way Analysis of Variance
Name:
A researcher conducted a study to examine the effects of secure, anxious, and avoidant attachment styles on the physiology of sleep. Participants were selected using a stratified random sampling approach to ensure representation of each of the three styles. The sleep patterns of 30 secure, 30 anxious, and 30 avoidant children were monitored. Of primary importance to the researcher was the overall percentage of time each child spent in deep (delta) sleep. Following is the average amount of time that each child spent in delta sleep, expressed as a percentage of total sleep time (ranging from 0.0 to 100.0). For the attachment styles, 1 = secure, 2 = anxious, and 3 = avoidant.
Data Output for this Assignment is found on the last four pages.
The gray boxes for your answers will expand as necessary for your responses.
1.
(2 points) What would the null hypothesis be for this study? Show/write the appropriate symbols and expression in words.
H0:
.
2.
(2 points) What would the alternative hypothesis be for this study? Show/write the appropriate symbols and expression in words.
Ha:
3.
Prior to examining whether the group means differ; you need to test the underlying assumptions of the one-way analysis of variance.
3.a.
(2 points) Has the assumption of independence been met for this data?
FORMCHECKBOX
Yes
FORMCHECKBOX
No
(check your answer selection)
Indicate how you made your determination.
3.b.
(3 points) Has the assumption of normality been met for this data, using an alpha level of .001?
FORMCHECKBOX
Yes
FORMCHECKBOX
No
(check your answer selection)
Indicate how you made your determination. Be sure to include all applicable values and symbols.
3.c.
(3 points) Has the assumption of homogeneity of variance been met for this data, using an alpha level of .05? That is, is this assumption met or not met?
FORMCHECKBOX
Yes
FORMCHECKBOX
No
(check your answer selection)
Indicate how you came to your conclusion. Be sure to include all applicable values and symbols.
4.
(2 points) The next question that needs to be answered is whether all of the groups are the same in their percentage of time in deep (delta) sleep using an alpha level of .05. If applicable (or indicate why not), use the Welch statistic. What is your conclusion (at this point) from this analysis? Indicate how you came to your conclusion. Be sure to include all applicable values and symbols.
5.
(3 points) Calculate the measure of association and interpret its meaning.
W
T
W
B
MS
SS
MS
K
SS
+
-
-
=
)
1
(
2
wWhere
SSB =
K =
MSW =
SST =
MSW =
Therefore, (2 =
This means:
6.
(1 point) Write the statistical strand for this one-way ANOVA analysis.
7.
(4 points) Assuming that you found a significant F, which pairs of groups differ? Indicate which post hoc procedure you used and why. Indicate your findings fr ...
Practice Test 5B Multinomial Experiments and Contingency Tables Solution
Practice Test 5B Multinomial Experiments and Contingency Tables Solution
Chapter 11 Chi-Square Tests and ANOVA 359 Chapter .docx
Chapter 11: Chi-Square Tests and ANOVA
359
Chapter 11: Chi-Square and ANOVA Tests
This chapter presents material on three more hypothesis tests. One is used to determine
significant relationship between two qualitative variables, the second is used to determine
if the sample data has a particular distribution, and the last is used to determine
significant relationships between means of 3 or more samples.
Section 11.1: Chi-Square Test for Independence
Remember, qualitative data is where you collect data on individuals that are categories or
names. Then you would count how many of the individuals had particular qualities. An
example is that there is a theory that there is a relationship between breastfeeding and
autism. To determine if there is a relationship, researchers could collect the time period
that a mother breastfed her child and if that child was diagnosed with autism. Then you
would have a table containing this information. Now you want to know if each cell is
independent of each other cell. Remember, independence says that one event does not
affect another event. Here it means that having autism is independent of being breastfed.
What you really want is to see if they are not independent. In other words, does one
affect the other? If you were to do a hypothesis test, this is your alternative hypothesis
and the null hypothesis is that they are independent. There is a hypothesis test for this
and it is called the Chi-Square Test for Independence. Technically it should be called
the Chi-Square Test for Dependence, but for historical reasons it is known as the test for
independence. Just as with previous hypothesis tests, all the steps are the same except for
the assumptions and the test statistic.
Hypothesis Test for Chi-Square Test
1. State the null and alternative hypotheses and the level of significance
Ho : the two variables are independent (this means that the one variable is not
affected by the other)
HA : the two variables are dependent (this means that the one variable is affected
by the other)
Also, state your α level here.
2. State and check the assumptions for the hypothesis test
a. A random sample is taken.
b. Expected frequencies for each cell are greater than or equal to 5 (The expected
frequencies, E, will be calculated later, and this assumption means E ≥ 5 ).
3. Find the test statistic and p-value
Finding the test statistic involves several steps. First the data is collected and
counted, and then it is organized into a table (in a table each entry is called a cell).
These values are known as the observed frequencies, which the symbol for an
observed frequency is O. Each table is made up of rows and columns. Then each
row is totaled to give a row total and each column is totaled to give a column
total.
Chapter 11: Chi-Squared Tests and ANOVA
360
The null hypothesis is that the variables are independent. Using the multiplication.
Similar to Chisq.pptx (20)
1. fj What value of the constant c will make the following lim.docx
1. fj What value of the constant c will make the following lim.docx
Probability distribution of a random variable module
Probability distribution of a random variable module
Educational Psychology 565 Practice Quiz(use α = .05 unl.docx
Educational Psychology 565 Practice Quiz(use α = .05 unl.docx
Descriptive Statistics Formula Sheet Sample Populatio.docx
Descriptive Statistics Formula Sheet Sample Populatio.docx
EPS 525 – Introduction to StatisticsAssignment No. 5 – One-w.docx
EPS 525 – Introduction to StatisticsAssignment No. 5 – One-w.docx
Practice Test 5B Multinomial Experiments and Contingency Tables Solution
Practice Test 5B Multinomial Experiments and Contingency Tables Solution
Chapter 11 Chi-Square Tests and ANOVA 359 Chapter .docx
Chapter 11 Chi-Square Tests and ANOVA 359 Chapter .docx
More from Merwyn Jasper D Reuben
More from Merwyn Jasper D Reuben (20)
Back ground PPT 29082019Back ground .Back ground Back ground pptx
Back ground PPT 29082019Back ground .Back ground Back ground pptx
Repeated Measures AnovaRepeated Measures AnovaRepeated Measures Anova.ppt
Repeated Measures AnovaRepeated Measures AnovaRepeated Measures Anova.ppt
magnetic Hystersis magnetic Hystersis magnetic Hystersis magnetic Hystersis
magnetic Hystersis magnetic Hystersis magnetic Hystersis magnetic Hystersis
Recently uploaded
Salas, V. (2024) "John of St. Thomas (Poinsot) on the Science of Sacred Theol...
I Introduction
II Subalternation and Theology
III Theology and Dogmatic Declarations
IV The Mixed Principles of Theology
V Virtual Revelation: The Unity of Theology
VI Theology as a Natural Science
VII Theology’s Certitude
VIII Conclusion
Notes
Bibliography
All the contents are fully attributable to the author, Doctor Victor Salas. Should you wish to get this text republished, get in touch with the author or the editorial committee of the Studia Poinsotiana. Insofar as possible, we will be happy to broker your contact.
Toxic effects of heavy metals : Lead and Arsenic
Heavy metals are naturally occuring metallic chemical elements that have relatively high density, and are toxic at even low concentrations. All toxic metals are termed as heavy metals irrespective of their atomic mass and density, eg. arsenic, lead, mercury, cadmium, thallium, chromium, etc.
extra-chromosomal-inheritance[1].pptx.pdfpdf
Slide 1: Title Slide
Extrachromosomal Inheritance
Slide 2: Introduction to Extrachromosomal Inheritance
Definition: Extrachromosomal inheritance refers to the transmission of genetic material that is not found within the nucleus.
Key Components: Involves genes located in mitochondria, chloroplasts, and plasmids.
Slide 3: Mitochondrial Inheritance
Mitochondria: Organelles responsible for energy production.
Mitochondrial DNA (mtDNA): Circular DNA molecule found in mitochondria.
Inheritance Pattern: Maternally inherited, meaning it is passed from mothers to all their offspring.
Diseases: Examples include Leber’s hereditary optic neuropathy (LHON) and mitochondrial myopathy.
Slide 4: Chloroplast Inheritance
Chloroplasts: Organelles responsible for photosynthesis in plants.
Chloroplast DNA (cpDNA): Circular DNA molecule found in chloroplasts.
Inheritance Pattern: Often maternally inherited in most plants, but can vary in some species.
Examples: Variegation in plants, where leaf color patterns are determined by chloroplast DNA.
Slide 5: Plasmid Inheritance
Plasmids: Small, circular DNA molecules found in bacteria and some eukaryotes.
Features: Can carry antibiotic resistance genes and can be transferred between cells through processes like conjugation.
Significance: Important in biotechnology for gene cloning and genetic engineering.
Slide 6: Mechanisms of Extrachromosomal Inheritance
Non-Mendelian Patterns: Do not follow Mendel’s laws of inheritance.
Cytoplasmic Segregation: During cell division, organelles like mitochondria and chloroplasts are randomly distributed to daughter cells.
Heteroplasmy: Presence of more than one type of organellar genome within a cell, leading to variation in expression.
Slide 7: Examples of Extrachromosomal Inheritance
Four O’clock Plant (Mirabilis jalapa): Shows variegated leaves due to different cpDNA in leaf cells.
Petite Mutants in Yeast: Result from mutations in mitochondrial DNA affecting respiration.
Slide 8: Importance of Extrachromosomal Inheritance
Evolution: Provides insight into the evolution of eukaryotic cells.
Medicine: Understanding mitochondrial inheritance helps in diagnosing and treating mitochondrial diseases.
Agriculture: Chloroplast inheritance can be used in plant breeding and genetic modification.
Slide 9: Recent Research and Advances
Gene Editing: Techniques like CRISPR-Cas9 are being used to edit mitochondrial and chloroplast DNA.
Therapies: Development of mitochondrial replacement therapy (MRT) for preventing mitochondrial diseases.
Slide 10: Conclusion
Summary: Extrachromosomal inheritance involves the transmission of genetic material outside the nucleus and plays a crucial role in genetics, medicine, and biotechnology.
Future Directions: Continued research and technological advancements hold promise for new treatments and applications.
Slide 11: Questions and Discussion
Invite Audience: Open the floor for any questions or further discussion on the topic.
Comparing Evolved Extractive Text Summary Scores of Bidirectional Encoder Rep...
Comparing Evolved Extractive Text Summary Scores of Bidirectional Encoder Rep...University of Maribor
Slides from:
11th International Conference on Electrical, Electronics and Computer Engineering (IcETRAN), Niš, 3-6 June 2024
Track: Artificial Intelligence
https://www.etran.rs/2024/en/home-english/Deep Software Variability and Frictionless Reproducibility
Deep Software Variability and Frictionless ReproducibilityUniversity of Rennes, INSA Rennes, Inria/IRISA, CNRS
The ability to recreate computational results with minimal effort and actionable metrics provides a solid foundation for scientific research and software development. When people can replicate an analysis at the touch of a button using open-source software, open data, and methods to assess and compare proposals, it significantly eases verification of results, engagement with a diverse range of contributors, and progress. However, we have yet to fully achieve this; there are still many sociotechnical frictions.
Inspired by David Donoho's vision, this talk aims to revisit the three crucial pillars of frictionless reproducibility (data sharing, code sharing, and competitive challenges) with the perspective of deep software variability.
Our observation is that multiple layers — hardware, operating systems, third-party libraries, software versions, input data, compile-time options, and parameters — are subject to variability that exacerbates frictions but is also essential for achieving robust, generalizable results and fostering innovation. I will first review the literature, providing evidence of how the complex variability interactions across these layers affect qualitative and quantitative software properties, thereby complicating the reproduction and replication of scientific studies in various fields.
I will then present some software engineering and AI techniques that can support the strategic exploration of variability spaces. These include the use of abstractions and models (e.g., feature models), sampling strategies (e.g., uniform, random), cost-effective measurements (e.g., incremental build of software configurations), and dimensionality reduction methods (e.g., transfer learning, feature selection, software debloating).
I will finally argue that deep variability is both the problem and solution of frictionless reproducibility, calling the software science community to develop new methods and tools to manage variability and foster reproducibility in software systems.
Exposé invité Journées Nationales du GDR GPL 2024
What is greenhouse gasses and how many gasses are there to affect the Earth.
What are greenhouse gasses how they affect the earth and its environment what is the future of the environment and earth how the weather and the climate effects.
Earliest Galaxies in the JADES Origins Field: Luminosity Function and Cosmic ...
We characterize the earliest galaxy population in the JADES Origins Field (JOF), the deepest
imaging field observed with JWST. We make use of the ancillary Hubble optical images (5 filters
spanning 0.4−0.9µm) and novel JWST images with 14 filters spanning 0.8−5µm, including 7 mediumband filters, and reaching total exposure times of up to 46 hours per filter. We combine all our data
at > 2.3µm to construct an ultradeep image, reaching as deep as ≈ 31.4 AB mag in the stack and
30.3-31.0 AB mag (5σ, r = 0.1” circular aperture) in individual filters. We measure photometric
redshifts and use robust selection criteria to identify a sample of eight galaxy candidates at redshifts
z = 11.5 − 15. These objects show compact half-light radii of R1/2 ∼ 50 − 200pc, stellar masses of
M⋆ ∼ 107−108M⊙, and star-formation rates of SFR ∼ 0.1−1 M⊙ yr−1
. Our search finds no candidates
at 15 < z < 20, placing upper limits at these redshifts. We develop a forward modeling approach to
infer the properties of the evolving luminosity function without binning in redshift or luminosity that
marginalizes over the photometric redshift uncertainty of our candidate galaxies and incorporates the
impact of non-detections. We find a z = 12 luminosity function in good agreement with prior results,
and that the luminosity function normalization and UV luminosity density decline by a factor of ∼ 2.5
from z = 12 to z = 14. We discuss the possible implications of our results in the context of theoretical
models for evolution of the dark matter halo mass function.
Leaf Initiation, Growth and Differentiation.pdf
Leaf initiation, growth and differentiation, genetic control of leaf development.
Observation of Io’s Resurfacing via Plume Deposition Using Ground-based Adapt...
Since volcanic activity was first discovered on Io from Voyager images in 1979, changes
on Io’s surface have been monitored from both spacecraft and ground-based telescopes.
Here, we present the highest spatial resolution images of Io ever obtained from a groundbased telescope. These images, acquired by the SHARK-VIS instrument on the Large
Binocular Telescope, show evidence of a major resurfacing event on Io’s trailing hemisphere. When compared to the most recent spacecraft images, the SHARK-VIS images
show that a plume deposit from a powerful eruption at Pillan Patera has covered part
of the long-lived Pele plume deposit. Although this type of resurfacing event may be common on Io, few have been detected due to the rarity of spacecraft visits and the previously low spatial resolution available from Earth-based telescopes. The SHARK-VIS instrument ushers in a new era of high resolution imaging of Io’s surface using adaptive
optics at visible wavelengths.
Unveiling the Energy Potential of Marshmallow Deposits.pdf
Unveiling the Energy Potential of Marshmallow Deposits: A Revolutionary
Breakthrough in Sustainable Energy Science
Recently uploaded (20)
Salas, V. (2024) "John of St. Thomas (Poinsot) on the Science of Sacred Theol...
Salas, V. (2024) "John of St. Thomas (Poinsot) on the Science of Sacred Theol...
Body fluids_tonicity_dehydration_hypovolemia_hypervolemia.pptx
Body fluids_tonicity_dehydration_hypovolemia_hypervolemia.pptx
PRESENTATION ABOUT PRINCIPLE OF COSMATIC EVALUATION
PRESENTATION ABOUT PRINCIPLE OF COSMATIC EVALUATION
In silico drugs analogue design: novobiocin analogues.pptx
In silico drugs analogue design: novobiocin analogues.pptx
Comparing Evolved Extractive Text Summary Scores of Bidirectional Encoder Rep...
Comparing Evolved Extractive Text Summary Scores of Bidirectional Encoder Rep...
Mammalian Pineal Body Structure and Also Functions
Mammalian Pineal Body Structure and Also Functions
Deep Software Variability and Frictionless Reproducibility
Deep Software Variability and Frictionless Reproducibility
What is greenhouse gasses and how many gasses are there to affect the Earth.
What is greenhouse gasses and how many gasses are there to affect the Earth.
Earliest Galaxies in the JADES Origins Field: Luminosity Function and Cosmic ...
Earliest Galaxies in the JADES Origins Field: Luminosity Function and Cosmic ...
Observation of Io’s Resurfacing via Plume Deposition Using Ground-based Adapt...
Observation of Io’s Resurfacing via Plume Deposition Using Ground-based Adapt...
Unveiling the Energy Potential of Marshmallow Deposits.pdf
Unveiling the Energy Potential of Marshmallow Deposits.pdf
Chisq.pptx
- 1. 1 THE CHI-SQUARE DISTRIBUTION Definition The chi-square distribution has only one parameter called the degrees of freedom. The shape of a chi- squared distribution curve is skewed to the right for small df and becomes symmetric for large df. The entire chi-square distribution curve lies to the right of the vertical axis. The chi-square distribution assumes nonnegative values only, and these are denoted by the symbol χ2 (read as “chi-square”).
- 2. 2 Figure 11.1 Three chi-square distribution curves.
- 3. 3 Example 11-1 Find the value of χ² for 7 degrees of freedom and an area of .10 in the right tail of the chi- square distribution curve.
- 4. 4 Table 11.1 χ2 for df = 7 and .10 Area in the Right Tail Area in the Right Tail Under the Chi-Square Distribution Curve df .995 … .100 … .005 1 2 . 7 . 100 .000 .010 … .989 … 67.328 … … … … … … 2.706 4.605 … 12.017 … 118.498 … … … … … … 7.879 10.597 … 20.278 … 140.169 Required value of χ ²
- 5. 5 CONTINGENCY TABLES Full-Time Part-Time Male 6768 2615 Female 7658 3717 Table 11.5 Total 2002 Enrollment at a University Students who are male and enrolled part-time
- 6. 6 A Test of Independence Definition A test of independence involves a test of the null hypothesis that two attributes of a population are not related. The degrees of freedom for a test of independence are df = (R – 1)(C – 1) Where R and C are the number of rows and the number of columns, respectively, in the given contingency table.
- 7. 7 Test Statistic for a Test of Independence The value of the test statistic χ2 for a test of independence is calculated as where O and E are the observed and expected frequencies, respectively, for a cell. A Test of Independence cont. E E O 2 2 ) (
- 8. 8 Example 11-5 Violence and lack of discipline have become major problems in schools in the United States. A random sample of 300 adults was selected, and they were asked if they favor giving more freedom to schoolteachers to punish students for violence and lack of discipline. The two-way classification of the responses of these adults is represented in the following table.
- 9. 9 Calculate the expected frequencies for this table assuming that the two attributes, gender and opinions on the issue, are independent. Example 11-5 In Favor (F) Against (A) No Opinions (N) Men (M) Women (W) 93 87 70 32 12 6
- 10. 10 Table 11.6 Solution 11-5 In Favor (F) Against (A) No Opinion (N) Row Totals Men (M) 93 70 12 175 Women (W) 87 32 6 125 Column Totals 180 102 18 300
- 11. 11 Expected Frequencies for a Test of Independence The expected frequency E for a cell is calculated as size sample ) lumn total total)(Co Row ( E
- 12. 12 Table 11.7 Solution 11-5 In Favor (F) Against (A) No Opinion (O) Row Totals Men (M) 93 (105.00) 70 (59.50) 12 (10.50) 175 Women (W) 87 (75.00) 32 (42.50) 6 (7.50) 125 Column Totals 180 102 18 300
- 13. 13 Example 11-6 Reconsider the two-way classification table given in Example 11-5. In that example, a random sample of 300 adults was selected, and they were asked if they favor giving more freedom to schoolteachers to punish students for violence and lack of discipline. Based on the results of the survey, a two-way classification table was prepared and presented in Example 11-5. Does the sample provide sufficient information to conclude that the two attributes, gender and opinions of adults, are dependent? Use a 1% significance level.
- 14. 14 Solution 11-6 • H0: Gender and opinions of adults are independent • H1: Gender and opinions of adults are dependent
- 15. 15 Solution 11-6 • α = .01 • df = (R – 1)(C – 1) = (2 – 1)(3 – 1) = 2 • The critical value of χ2 = 9.210
- 16. 16 Figure 11.6 Reject H0 Do not reject H0 α = .01 9.210 χ2 Critical value of χ2
- 17. 17 Table 11.8 In Favor (F) Against (A) No Opinion (N) Row Totals Men (M) 93 (105.00) 70 (59.50) 12 (10.50) 175 Women (W) 87 (75.00) 32 (42.50) 6 (7.50) 125 Column Totals 180 102 18 300
- 18. 18 Solution 11-6 252 . 8 300 . 594 . 2 920 . 1 214 . 853 . 1 371 . 1 50 . 7 50 . 7 6 50 . 42 50 . 42 32 00 . 75 00 . 75 87 50 . 10 50 . 10 12 50 . 59 50 . 59 70 00 . 105 00 . 105 93 ) ( 2 2 2 2 2 2 2 2 E E O
- 19. 19 Solution 11-6 • The value of the test statistic χ2 = 8.252 - It is less than the critical value of χ2 - It falls in the nonrejection region • Hence, we fail to reject the null hypothesis